

Abstract
Objective
Accelerated transmembrane transport of long‐chain fatty acids dependent on fatty acid transporters is responsible for lipid accumulation and, eventually, the development of metabolic syndrome. This study determined the content of lipids (ceramide [CER], diacylglycerol [DAG], triacylglycerol, and free fatty acid [FFA]) and the expression of fatty acid translocase (FAT/CD36) and plasma membrane fatty acid‐binding protein in visceral adipose tissue (VAT) and subcutaneous adipose tissue of women with morbid obesity without metabolic syndrome (MetSx−) or with metabolic syndrome (MetSx+) and compared the results with those of lean controls without metabolic syndrome.
Methods
Lipid content and fatty acid composition in each lipid subclass were estimated by gas liquid chromatography. For total, plasma membrane, and mitochondrial expression of fatty acid transporters, subfractionation with subsequent Western blot technique was used.
Results
A greater content of triacylglycerol in VAT of participants with obesity (MetSx−) was found. However, only the MetSx+ subjects had increased content of CER in VAT in relation to subcutaneous adipose tissue in MetSx+ and lean individuals. This was accompanied by increased total and membrane expression of FAT/CD36 in VAT in MetSx+ subjects. Accordingly, mitochondrial expression of FAT/CD36 and plasma membrane fatty acid‐binding protein was decreased in both groups of subjects with obesity.
Conclusions
Metabolic syndrome is associated with the accumulation of CER in VAT, possibly related to increased FAT/CD36 protein expression.
Introduction
Nowadays, obesity is considered to be one of the most serious health problems, affecting more than 600 million adults worldwide in 2014 1. The primary and classical roles of adipose tissue as a storage place of fatty acids have been replaced by the fact that adipose tissue represents a key driver for the development of metabolic dysfunctions, collectively referred to as metabolic syndrome (MetS) 2, 3. Current data strongly suggest that metabolic complications of obesity also depend on the deposition of adipose tissue in the human body. Increased mass of visceral adipose tissue (VAT) is widely seen as a defining factor of MetS 4. Interestingly, lipid deposition is significantly higher in women than in men in both types of adipose tissue 5. Although knowledge of this subject is constantly expanding, the cause of some individuals developing MetS remains unclear.
Fatty acids are stored primarily as triacylglycerols (TAG) in subcutaneous adipose tissue and deep VAT. These depots are large (in the body of a 70‐kg man, there is ~9‐15 kg of adipose tissue) and represent approximately 95% of the total energy stores in the human body. Physiologic stimuli lead to the hydrolysis of adipocytes’ TAG, which results in an increase in plasma long‐chain fatty acid (LCFA) content and subsequent ectopic lipid accumulation 6. The resultant lipid overload, especially with diacylglycerol (DAG) and ceramide (CER), directly interferes with insulin signal transduction and is responsible for the development of insulin resistance and MetS in the insulin‐sensitive tissues 7. It has been suggested that lipid accumulation, observed in obesity and MetS, results from increased transmembrane transport of LCFAs, regulated mainly by fatty acid transport proteins (FATPs) 8, 9, 10, 11, including fatty acid translocase (FAT/CD36), plasma membrane fatty acid‐binding protein (FABPpm), and FATPs. Recent evidence has demonstrated that both FAT/CD36 and FABPpm are present not only within the plasma membrane but also intracellularly and in the mitochondrial membrane.
Because it is well known that lipid metabolism is dysregulated in obesity, a lot of attention has been paid to examining the role of fatty acid transporters in this pathological phenomenon. However, there are only limited data on the role of FATPs in the metabolism of bioactive lipids (DAG and CER) in human adipose tissue of patients with morbid obesity. Therefore, the aim of our study was to assess the content and fatty acid composition of the selected lipid fractions: TAG, DAG, and CER as well as the total, plasma membrane, and mitochondrial expression of fatty acid transport proteins (FAT/CD36 and FABPpm) in both VAT and SAT from patients with morbid obesity without metabolic syndrome (MetSx−) and with metabolic syndrome (MetSx+) compared with lean individuals. We hypothesized that the accumulation of CER in adipose tissue may be an important factor that contributes to the development of metabolic complications in obesity.
Methods
Subject selection
The study included 28 patients with class 3 obesity (BMI > 40 kg/m2; women from 18 to 65 years of age) who underwent elective bariatric surgery. The patients were divided into two groups: morbid obesity without metabolic syndrome (MetSx−) (n = 12) and morbid obesity with metabolic syndrome (MetSx+) (n = 16). MetS was diagnosed in accordance with the International Diabetes Federation. Additionally, seven patients were treated for type 2 diabetes mellitus (T2DM), and five patients were treated for hypertension. The control material was collected from a group of 16 lean patients (BMI < 25 kg/m2; women from 21 to 60 years of age) who underwent elective laparoscopic cholecystectomy. Furthermore, one woman in the MetSx− group, five women in the MetSx+ group, and two women in the lean group were postmenopausal. Patients with obesity had a mean weight loss of 5 ± 0.6 kg for a time interval of 10 to 30 days prior to surgery, which was associated with a low‐calorie diet (part of preparation for surgery). Patients with acute inflammatory changes and a history of malignancy were excluded from the study. Patients were treated at the First Department of General and Endocrinological Surgery at the University Hospital in Białystok. All procedures were designed, conducted, and reported in compliance with the Declaration of Helsinki and were approved by the Ethics Committee of the Medical University of Białystok (permission R‐I‐002/187/2017), functioning according to the Guidelines for Good Clinical Practice. All patients gave their informed consent after the purpose and nature of all procedures were fully explained.
Sample preparation and laboratory measurements
All samples were collected from patients in the overnight fasting state. Blood samples were obtained before surgery to EDTA‐coated tubes and centrifuged for 10 minutes at 4,000 rpm. Plasma triglycerides, total cholesterol, low‐density lipoprotein (LDL) and high‐density lipoprotein (HDL) cholesterol, C‐reactive protein (CRP), alanine transaminase, aspartate transaminase, the full blood count, fibrinogen, the international normalized ratio, glucose, and insulin were quantified by using an Abbott analyzer (Abbott Diagnostics, Wiesbaden, Germany). At the end of the surgical intervention, the samples of VAT and SAT were excised from the upper abdomen and cleaned of blood. The samples were promptly frozen in liquid nitrogen and stored at −80°C until final examinations.
Subcellular fractionation
Subcellular fractionation was undertaken by using the sucrose technique according to the protocol of Gargiulo et al. 12, with some modifications. Briefly, adipose tissue weighing approximately 250 mg was resuspended in 2.5 mL of sucrose homogenization buffer (SHB) buffer with protease and phosphatase inhibitor cocktail as well as Triton X‐100 (Sigma‐Aldrich, St. Louis, Missouri). The samples were homogenized in a Teflon homogenizer and then centrifuged for 10 minutes at 500g. The pellet was resuspended in 0.5 mL of SHB buffer and layered onto a 1‐mL sucrose cushion as well as centrifuged for 25 minutes at 180,000g. The membrane fractions were yielded from the supernatant and mitochondrial fraction by resuspending the pellet in 0.5 mL of SHB buffer without Triton‐X100. Protein quantity per fraction was determined by using bicinchoninic acid assay.
First, to exclude the cross contamination between studied fractions, we evaluated the purity of the tissue homogenate plasma membrane and mitochondrial fractions (Figure 1). Using the Western blot method, we confirmed the presence of α subunit Na+/K+ pump (Santa Cruz Biotechnology, Inc., Dallas, Texas) in the plasma membrane fraction and the lack of mitochondrial cytochrome c (Abcam, Cambridge, Massachusetts), a protein present only in the mitochondrial fraction. Additionally, the presence of sarcoendoplasmic reticulum calcium ATPase and P‐nuc (Abcam), which are nuclear proteins, was not found. Figure 1 indicates that neither Na+/K+ ATPase nor glucose transporter 1 was present in the mitochondrial membrane‐rich fraction, whereas cytochrome c was not present in the plasma membrane‐rich fraction. This means that the plasma membrane and mitochondrial fractions were not polluted mutually and nuclear fraction with plasma membrane.
Figure 1.
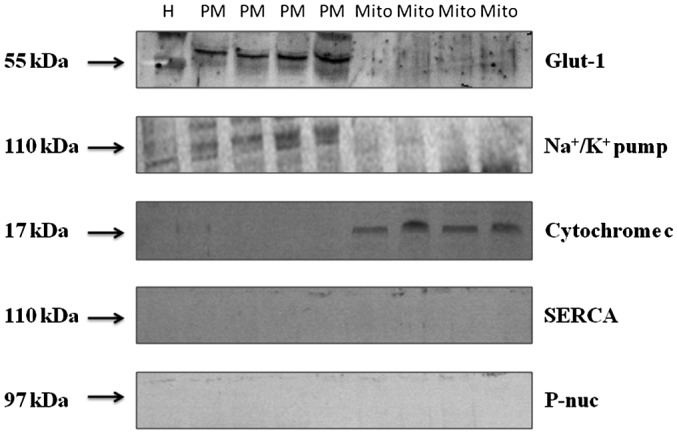
Representative Western blot images of Glut‐1, α‐subunits of Na+/K+ pump, mitochondrial enzyme cytochrome c, SERCA, and P‐nuc nuclear protein, used as specific subcellular protein markers, as detected in the tissue homogenate as well as PM and Mito fractions in adipose tissue. Glut‐1, glucose transporter 1; H, tissue homogenate; Mito, mitochondria; PM, plasma membrane; SERCA, sarcoendoplasmic reticulum calcium ATPase.
Western blot analysis
The Western blot procedure was used to determine protein content as described in detail by us and others 13, 14, 15. Briefly, the adipose tissue was homogenized in ice‐cold radioimmunoprecipitation assay buffer for 1 minute at 4°C. Total protein content in each sample was determined by the bicinchoninic acid assay method. Then the proteins (30 µg) were subjected to sodium dodecyl sulfate (SDS)‐polyacrylamide gel electrophoresis (PAGE) and transferred to nitrocellulose membranes (0.75 A for 1 hour). Next, membranes were blocked in TTBS (Tris‐buffered saline, Tween 20) buffer (Bio‐Rad, Warsaw, Poland) comprising 5% nonfat dry milk for 90 minutes at room temperature. Subsequently, membranes were incubated overnight with primary antibodies: anti‐FAT/CD36, anti‐β‐tubulin, and anti‐nuclear factor‐κβ (NF‐κβ) (Novus Biologicals, Centennial, Colorado); anti‐FABPpm (gift from A. Bonen); anti‐citrate synthase (CS), anti‐glucose transporter 1, anti‐Na+/K+ pump, and anti‐tumor necrosis factor (TNF)‐α (Santa Cruz Biotechnology); and anti‐cytochrome c oxidase (COX IV), anti‐cytochrome c, anti‐sarcoendoplasmic reticulum calcium ATPase, anti‐SERCA, and anti‐P‐nuc (Abcam). Thereafter, the primary antibodies were detected with antirabbit or antigoat IgG horseradish peroxidase‐conjugated secondary antibody (Santa Cruz Biotechnology). The protein bands were visualized by using an enhanced chemiluminescence substrate (Thermo Scientific, Waltham, Massachusetts) and quantified by densitometry (Bio‐Rad). Eventually, the protein expression (optical density arbitrary units) was normalized to β‐tubulin expression and was related to the control group.
Lipid analyses
Adipose tissue (TAG, DAG, and CER) and plasma lipids (free fatty acids [FFA] and TAG) were analyzed by gas liquid chromatography as described previously 16, 17. The studied lipid fractions were extracted by using Bligh and Dyer’s method 18. The adipose tissue (10 mg) and plasma (200 µL) samples were extracted with chloroform‐methanol (2:1 vol/vol) with antioxidant. Moreover, an internal standard (100 μL) containing heptadecanoic acid (C17:0 FFA), 1,2‐diheptadecanoin (C17:0 DAG), and triheptadecanoin (C17:0 TAG) (Sigma‐Aldrich) was added. After overnight extraction, the water was imparted. Next, the samples were separated by using thin‐layer chromatography on silica gel plates (Silica Plate 60, 0.25 mm; Merck, Darmstadt, Germany) with a diethyl ether/hexane/acetic acid (90:10:1, vol/vol/vol) resolving solution for CER, DAG, and TAG, whereas plasma TAG and FFA separation was done in a solvent containing heptane, isopropyl, and acetic acid (60:40:3, vol/vol/vol) as previously described 19. Then dried silica plates were visualized under ultraviolet light. In the CER class of the lipids, pentadecanoic acid (C15:0; Sigma‐Aldrich) was used as an internal standard and transmethylated in 14% boron trifluoride‐methanol (BF3) solution. Similarly, FFA was transmethylated with BF3 methanol 20, whereas the DAG fraction was eluted by using a chloroform‐methanol solution (9:1, vol/vol); and finally, an organic phase was redissolved in BF3‐methanol solution as described 21. Finally, the TAG fraction was eluted and methylated according to Christie 22. The fatty acid methyl esters were extracted by using pentane. Thereafter, samples were dissolved in hexane and analyzed by using a Hewlett‐Packard 5890 Series II gas chromatograph, an Agilent J&W CP‐Sil 88 capillary column (50 m × 0.25 mm inner diameter), and a flame‐ionization detector (Agilent Technologies, Santa Clara, California). The individual fatty acids were quantified according to the standard retention times. The total plasma FFA and TAG and tissue TAG, DAG, and CER concentrations were estimated as the sum of the particular fatty acid species content of the assessed fraction. The value was expressed as nanomoles per milliliter in plasma and as nanomoles per gram of adipose tissue wet weight.
Statistical analysis
The results were statistically analyzed by using Statistica 10 (StatSoft, Krakow, Poland). The data were analyzed by using analysis of variance (ANOVA) followed by post hoc Tukey test for groups with normal distribution and homogeneity of variances. Whenever these assumptions did not hold, the nonparametric Kruskal‐Wallis rank test with the subsequent pairwise Wilcoxon test was conducted. For consistency of the data in the graphs, the results are presented as mean ± SEM. P < 0.05 was considered to be statistically significant.
Results
Table 1 shows a comparison of the clinical and laboratory characteristics of the lean patients, patients with morbid obesity without metabolic syndrome (MetSx‐), and patients with morbid obesity and metabolic syndrome (MetSx+). We found significantly higher values in BMI, waist‐hip ratio, and waist circumference as well as in CRP, white blood cell, fibrinogen, glucose, and insulin levels and homeostatic model assessment of insulin resistance in both groups of patients with obesity compared with lean subjects. Total cholesterol, low‐density lipoprotein concentration, and blood pressure were greater in MetSx+ patients compared with controls, whereas HDL levels were decreased. Additionally, we noticed significant differences between MetSx+ and MetSx− regarding the following: hypertension, fasting plasma glucose, insulin, TAG, CRP, homeostatic model assessment of insulin resistance, HDL, and white blood cells (Table 1).
Table 1.
Clinical characteristics of lean subjects, patients with morbid obesity without metabolic syndrome (MetSx−) and patients with morbid obesity and metabolic syndrome (MetSx+)
| Lean subjects (n = 16) | Obese MetSx− (n = 12) | Obese MetSx+ (n = 16) | |
|---|---|---|---|
| Age | 41.5 ± 3.05 | 39.7 ± 3.98 | 42.4 ± 2.43 |
| BMI (kg/m2) | 23.4 ± 0.37 | 45.1 ± 1.7*** | 45.9 ± 1.85*** |
| WHR | 0.7 ± 0.02 | 0.91 ± 0.03*** | 0.98 ± 0.05*** |
| Waist circumference (cm) | 80 ± 2.22 | 124.6 ± 4.07** | 129.7 ± 4.30*** |
| Blood pressure (mmHg) | 121/83 ± 2/2.5 | 128/80 ± 3.3/2.1 | 147/98 ± 2.7/2.8*,# |
| CRP (mg/L) | 5.5 ± 0.35 | 9.8 ± 1.65* | 10.8 ± 1.58***,# |
| Glucose (mmol/L) | 4.3 ± 0.12 | 5.6 ± 0.29*** | 7.7 ± 0.48***,# |
| Insulin (pmol/L) | 36.6 ± 3.45 | 113.4 ± 17.49*** | 146.4 ± 18.75***,# |
| HOMA‐IR | 1.2 ± 0.1 | 5.1 ± 0.69*** | 8.3 ± 1.23***,# |
| ALT (IU/L) | 22.3 ± 1.8 | 31.7 ± 4.36 | 27.4 ± 3.03 |
| AST (IU/L) | 21.0 ± 1.87 | 23.9 ± 1.96 | 20.1 ± 1.53 |
| Cholesterol (mmol/L) | 4.7 ± 0.07 | 5.1 ± 0.38 | 5.6 ± 0.2* |
| LDL (mmol/L) | 3.1 ± 0.12 | 3.3 ± 0.32 | 3.9 ± 0.18* |
| TAG (mmol/L) | 1.3 ± 0.02 | 1.5 ± 0.17 | 1.9 ± 0.15*,# |
| HDL (mmol/L) | 1.6 ± 0.05 | 1.4 ± 0.09* | 1.2 ± 0.03***,# |
| WBC (103/µL) | 7.4 ± 0.42 | 8.7 ± 0.52* | 9.7 ± 0.83***,# |
| RBC (106/µL) | 4.8 ± 0.07 | 4.8 ± 0.12 | 4.6 ± 0.18 |
| HGB (g/dL) | 13.8 ± 0.25 | 13.2 ± 0.32 | 13.1 ± 0.43 |
| HCT (%) | 42.4 ± 0.8 | 40.5 ± 0.95 | 40.4 ± 1.35 |
| PLT (103/µL) | 294.4 ± 11.52 | 335.9 ± 14.87 | 278.5 ± 13.63 |
| Fibrinogen (mg/dL) | 376.1 ± 16.5 | 437.6 ± 23.56* | 475.4 ± 23.55* |
| INR | 0.82 ± 0.015 | 0.93 ± 0.02 | 0.91 ± 0.02 |
Data given as ± SEM.
*P < 0.05 and ***P < 0.001 indicate significant differences from lean subjects.
# P < 0.05 indicates significant difference from MetSx− subjects with obesity.
ALT, alanine transaminase; AST, aspartate transaminase; CRP, C‐reactive protein; HCT, hematocrit; HDL, high‐density lipoprotein; HGB, hemoglobin; HOMA‐IR, homeostatic model assessment of insulin resistance; INR, international normalized ratio; LDL, low‐density lipoprotein; MetSx−, without metabolic syndrome; MetSx+, with metabolic syndrome; PLT, platelet count; RBC, red blood cell count; TAG, triacylglycerol; WBC, white blood cell count; WHR, waist‐hip ratio.
TAG, DAG, and CER content of VAT and SAT
The content of TAG in VAT was significantly greater in MetSx− subjects (+46%; VAT of MetSx− vs. lean subjects; P < 0.05) in comparison with lean subjects (Figure 2A). In the MetSx+ group, the saturated fatty acid (SFA) to unsaturated fatty acid (USFA) ratio composing the TAG fraction decreased significantly in both adipose tissues (VAT: −16%, P < 0.05; SAT: −19%, P < 0.05; Figure 2B). Additionally, neither the total concentration of DAG nor the SFA/USFA ratio in the DAG subclass changed significantly in any group of subjects with obesity (Figure 2C‐2D).
Figure 2.
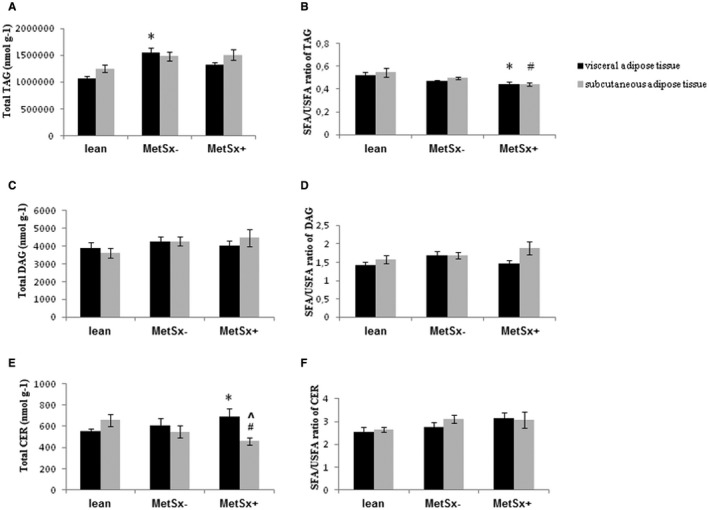
Total content and the SFA/USFA ratio of (A,B) TAG, (C,D) DAG, and (E,F) CER in VAT and SAT of lean subjects, subjects with morbid obesity without metabolic syndrome (MetSx‐), and subjects with morbid obesity and metabolic syndrome (MetSx+). Results are presented as mean ± SEM. *P < 0.05 indicates a significant difference from the VAT of lean patients; # P < 0.05 indicates a significant difference from the SAT of lean patients; and ^P < 0.05 indicates a significant difference from the VAT of MetSx+ patients with obesity. TAG, triacylglycerol; DAG, diacylglycerol; CER, ceramide; SAT, subcutaneous adipose tissue; SFA, saturated fatty acid; USFA, unsaturated fatty acid; VAT, visceral adipose tissue.
We observed a greater concentration of CER in VAT of MetSx+ subjects (+21%; MetSx+ vs. lean subjects; P < 0.05) in contrast to SAT, in which the total content decreased (−30%; MetSx+ vs. lean subjects; P < 0.05) compared with lean subjects (Figure 2E). Consequently, we noticed an increase of palmitic and stearic fatty acid (+69% and +34%, respectively, in MetSx+ vs. lean subjects; +31% and +45%, respectively, in MetSx+ vs. MetSx− subjects; P < 0.05) levels in VAT of MetSx+ subjects (Table 2). Most interestingly, the total concentration of CER in MetSx+ subjects was significantly higher in VAT (+30%; P < 0.05) than in SAT (Figure 2E, Table 2), caused by significant increment in the pool of SFA, i.e., palmitic, stearic, arachidic, behenic, and nervonic acid (+57%, +56%, +61%, +64%, and +125%, respectively; P < 0.05; Table 2).
Table 2.
Fatty acid–ceramide composition in lean subjects, patients with morbid obesity without metabolic syndrome (MetSx‐), and patients with morbid obesity and metabolic syndrome (MetSx+)
| Lean subjects (n = 16) | Obese MetSx− (n = 12) | Obese MetSx+ (n = 16) | ||||
|---|---|---|---|---|---|---|
| VAT | SAT | VAT | SAT | VAT | SAT | |
| 14:0 | 20.2 ± 2.1 | 26.9 ± 2.8 | 17.8 ± 2.3 | 16.7 ± 2.2 | 21.7 ± 2.7 | 15.8 ± 2.1** |
| 16:0 | 122 ± 9 | 189 ± 19 | 157 ± 23 | 163 ± 22 | 206 ± 21*,# | 131 ± 12^ |
| 16:1 | 17.4 ± 5.7 | 13.1 ± 1.4 | 11.4 ± 2 | 10.6 ± 1.5 | 14.9 ± 3.3 | 10.8 ± 3.4 |
| 18:0 | 177 ± 11 | 229 ± 30 | 163 ± 20 | 202 ± 27 | 237 ± 20*,# | 152 ± 17^ |
| 18:1n9c | 47 ± 8.3 | 41.5 ± 4.4 | 71.3 ± 17.9 | 46.8 ± 8.3 | 61.2 ± 17.2 | 38.4 ± 10.7 |
| 18:2n6c | 3.6 ± 0.4 | 3.0 ± 1.2 | 6.8 ± 2.4 | 2.9 ± 0.7 | 7.6 ± 3.4 | 1.5 ± 0.7 |
| 20:0 | 12.4 ± 0.6 | 12.2 ± 1.2 | 8.8 ± 0.8* | 9.7 ± 1.4* | 10.6 ± 0.7 | 6.6 ± 0.7**,^ |
| 18n3 | 4.1 ± 0.4 | 4.6 ± 0.5 | 2.3 ± 0.2** | 2 ± 0.3*** | 2.7 ± 0.9* | 2.5 ± 1** |
| 22:0 | 17.1 ± 1.4 | 17.1 ± 1.3 | 14.4 ± 1.1 | 12.1 ± 0.9** | 14.9 ± 1.3 | 9.1 ± 0.6**,^ |
| 20:4n6 | 7.1 ± .5 | 6.8 ± 0.5 | 3.6 ± 0.5* | 4.4 ± 0.8** | 4.2 ± 0.6 | 3.0 ± 0.4*** |
| 20:5n3 | 14.1 ± 1.5 | 10.7 ± 1.2 | 14.7 ± 2 | 12.8 ± 1.3 | 15.1 ± 2.8 | 9 ± 1# |
| 24:1 | 34.4 ± 2 | 43.6 ± 3.3 | 31.2 ± 2.6 | 24.8 ± 1.9*** | 45 ± 14.2 | 20 ± 1.7***,^ |
| 22:6n3 | 50.3 ± 4.2 | 49.4 ± 6.2 | 29.8 ± 2.9** | 32 ± 3.1** | 33.2 ± 3* | 23.6 ± 1.9** |
| 24:0 | 23.8 ± 1.4 | 20.1 ± 1.9 | 14.1 ± 1.6* | 11.9 ± 1.5** | 12.7 ± 1** | 11 ± 1.1** |
| Saturated | 372 ± 13 | 495 ± 54 | 355 ± 40 | 416 ± 53 | 503 ± 40 | 332 ± 27*,^^ |
| Unsaturated | 170 ± 26 | 162 ± 12 | 168 ± 23 | 136 ± 15 | 153 ± 16 | 128 ± 19 |
| MUFA | 99.2 ± 15.6 | 96.4 ± 6.4 | 98.9 ± 10 | 83.5 ± 7.3 | 90.4 ± 15 | 80.2 ± 16.3 |
| PUFA ‐ n3 | 55.2 ± 4.4 | 53.7 ± 7.5 | 53.7 ± 1.2 | 42.9 ± 2.1 | 48.3 ± 5.2 | 39.7 ± 6.4 |
| PUFA ‐ n6 | 15.6 ± 3.9 | 11.9 ± 0.6 | 15.4 ± 1.7 | 9.6 ± 1.6 | 14.3 ± 4.6 | 8.1 ± 4.7 |
| Total | 542 ± 25 | 657 ± 56 | 523 ± 77 | 552 ± 67 | 656 ± 77* | 460 ± 34^ |
Data presented as mean ± SEM.
*P < 0.05, **P < 0.01, and ***P < 0.001 indicate significant differences from lean subjects.
# P < 0.05 indicates significant difference from MetSx− subjects with obesity.
^ P < 0.05 and ^^ P < 0.01 indicate significant differences from VAT of MetSx+ subjects with obesity.
MetSx−, without metabolic syndrome; MetSx+, with metabolic syndrome; MUFA, monounsaturated fatty acid; PUFA, polyunsaturated fatty acid; SAT, subcutaneous adipose tissue; VAT, visceral adipose tissue.
Plasma FFA and TAG
The concentrations of total plasma FFA were significantly increased in both groups of subjects with morbid obesity (MetSx−: +180%, P < 0.001; MetSx+: +207%, P < 0.001) compared with lean subjects (Figure 3A). However, the SFA/USFA ratio in the plasma FFA fraction was significantly decreased in all subjects with obesity (−32% and −38% in MetSx− and MetSx+ vs. lean subjects, respectively; P < 0.05; Figure 3B).
Figure 3.
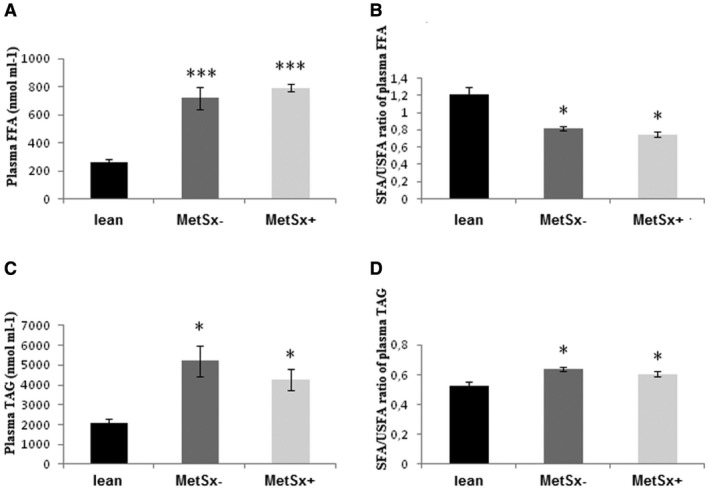
Plasma concentration and the SFA/USFA ratio of (A,B) FFA and (C,D) TAG in lean subjects, subjects with morbid obesity without metabolic syndrome (MetSx‐), and subjects with morbid obesity and metabolic syndrome (MetSx+). Results are presented as mean ± SEM. *P < 0.05 and ***P < 0.001 indicate significant differences from lean patients. FFA, free fatty acid; TAG, triacylglycerol; SFA, saturated fatty acid; USFA, unsaturated fatty acid.
With respect to the plasma TAG (Figure 3C), we observed increased content of the fraction in the MetSx− and MetSx+ groups (+95% and +66% in MetSx− and MetSx+ vs. lean subjects, respectively; P < 0.05; Figure 3C). Moreover, the SFA/USFA ratio in the plasma TAG fraction was significantly increased in both studied groups (MetSx−: +21%, P < 0.05; MetSx+: +14%, P < 0.05; Figure 3D).
FAT/CD36 expression
Total FAT/CD36 protein expression was significantly higher in VAT of MetSx+ subjects compared with lean subjects (+41%; P < 0.001; Figure 4A), as well as in MetSx− individuals (+21%; P < 0.05; Figure 4A).
Figure 4.
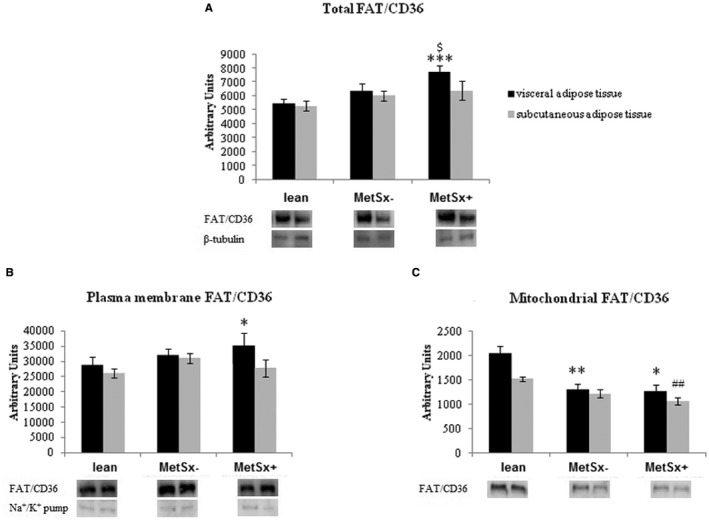
(A) Total, (B) plasma membrane, and (C) mitochondrial expression of FAT/CD36 protein in VAT and SAT of lean subjects, subjects with morbid obesity without metabolic syndrome (MetSx‐), and subjects with morbid obesity and metabolic syndrome (MetSx+) Results are shown in arbitrary units and presented as mean ± SEM. *P < 0.05, **P < 0.01, and ***P < 0.001 indicate significant differences from the VAT of lean patients; ## P < 0.01 indicates a significant difference from the SAT of lean patients; and $ P < 0.05 indicates a significant difference from the VAT of MetSx− patients with obesity. FAT/CD36, fatty acid translocase; SAT, subcutaneous adipose tissue; VAT, visceral adipose tissue.
Furthermore, we observed increase in plasma membrane FAT/CD36 expression in VAT of MetSx+ subjects (+22% in MetSx+ vs. lean subjects; P < 0.05; Figure 4B).
Interestingly, in VAT, mitochondrial FAT/CD36 expression was significantly decreased in both studied groups (−36% and −38% in MetSx− and MetSx+ vs. lean subjects, respectively; P < 0.01 and P < 0.05, respectively; Figure 4C). Moreover, mitochondrial FAT/CD36 expression also decreased in SAT of MetSx+ subjects (−31%; P < 0.01) compared with lean subjects (Figure 4C).
FABPpm expression
As illustrated in Figure 5A, there was a trend to an increase in total FABPpm expression in VAT and SAT in MetSx+ subjects (+31% and +54%, respectively; P > 0.05 and P = 0.0599, respectively) compared with lean subjects.
Figure 5.
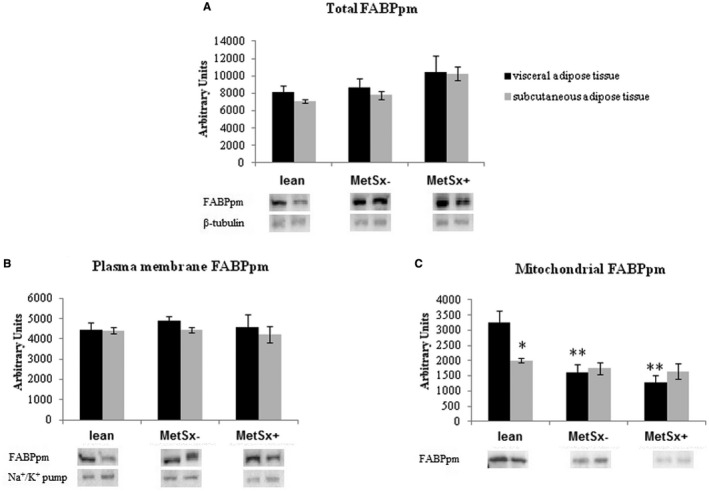
(A) Total, (B) plasma membrane, and (C) mitochondrial expression of FABPpm in VAT and SAT of lean subjects, subjects with morbid obesity without metabolic syndrome (MetSx‐), and subjects with morbid obesity and metabolic syndrome (MetSx+). Results are shown in arbitrary units and presented as mean ± SEM. *P < 0.05 and **P < 0.01 indicate significant differences from the VAT of lean patients. FABPpm, plasma membrane fatty acid‐binding protein; SAT, subcutaneous adipose tissue; VAT, visceral adipose tissue.
Total and plasma membrane FABPpm expression did not significantly differ between both types of adipose tissue in participants with obesity. (Figure 5B).
Interestingly, mitochondrial FABPpm expression in VAT was significantly decreased in both groups of patients with morbid obesity: MetSx− (−50% in MetSx− vs. lean subjects; P < 0.01; Figure 4C) and MetSx+ (−60% in MetSx+ vs. lean subjects; P < 0.01; Figure 5C). In addition, in lean patients, mitochondrial expression of FABPpm had higher values in VAT (+61%; P < 0.05) compared with SAT, with lack of changes in both studied groups (Figure 5C).
Expression of mitochondrial proteins
In VAT, a statistically significant reduction in the expression of COX IV was observed in MetSx − subjects (−53% in MetSx− vs. lean subjects; P < 0.001), as well as in MetSx + subjects (−45% in MetSx+ vs. lean subjects; P < 0.05; Figure 6A). Consistently (also in SAT), the expression of COX IV was diminished in the MetSx− group (−44%; P < 0.01) compared with the lean group (Figure 6A).
Figure 6.
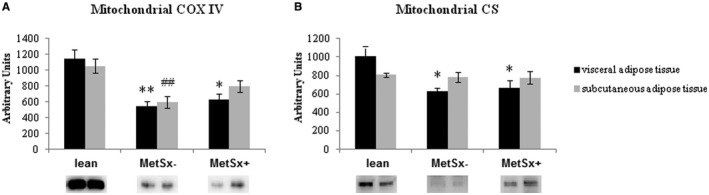
Expression of (A) COX IV and (B) CS mitochondrial proteins in VAT and SAT of lean subjects, subjects with morbid obesity without metabolic syndrome (MetSx‐), and subjects with morbid obesity and metabolic syndrome (MetSx+). Results are shown in arbitrary units and presented as mean ± SEM. *P < 0.05 and **P < 0.01 indicate significant differences from the VAT of lean patients; ## P < 0.01 indicates a significant difference from the SAT of lean patients. COX IV, cytochrome c oxidase; CS, citratesynthase; SAT, subcutaneous adipose tissue; VAT, visceral adipose tissue.
Correspondingly, the expression of CS, a biomarker for the presence of intact mitochondria, significantly decreased in VAT in both groups of patients with morbid obesity: MetSx− (−38%; P < 0.01) and MetSx+ (−34%; P < 0.05).
Expression of inflammatory proteins
The protein expression of TNF‐α was significantly higher in the VAT and SAT depots in both the MetSx− and MetSx+ groups (VAT: +63% and +53% in MetSx− and MetSx+ vs. lean subjects, respectively; SAT: +63% and +54% in MetSx− and MetSx+ vs. lean subjects, respectively; P < 0.01 and P < 0.05, respectively; Supporting Information Figure S1A). Additionally, expression of NF‐κB was significantly increased in individuals with obesity compared with controls (VAT: +72% and +65% in MetSx− and MetSx+ vs. lean subjects, respectively; SAT: +89% and +63% in MetSx− and MetSx+ vs. lean subjects, respectively; P < 0.01 and P < 0.05, respectively; Supporting Information Figure S1B). However, we did not observe any significant differences in the expression of proinflammatory proteins between MetSx+ and MetSx− patients.
Discussion
In recent years, much attention has been paid to the pathogenesis of obesity, which reached a global epidemic proportion. Commonly, obesity is associated with MetS, but there are some individuals with obesity who are defined as metabolically “healthy” patients. For the first time, the current study evaluated lipid concentration as well as expression of FATPs not only in the total homogenate but also in the plasma and mitochondrial membrane fractions in SAT and VAT in patients with obesity. The samples were derived from women with severe obesity (BMI > 40) with or without metabolic syndrome, and the levels of the variables were compared with those of lean individuals without metabolic syndrome (BMI < 25).
It is well known that VAT, in contrast to SAT, is highly active and reacts more dynamically to metabolic changes (i.e., hydrolysis and de novo synthesis of TAG) 2. Women with visceral obesity show less tissue insulin sensitivity compared with women with peripheral fat distribution 23. Additionally, lipid storage is significantly higher in VAT than in SAT, both in women and men with obesity; however, it is greater in both types of adipose tissue in women 5. In accordance with this notion, we decided to study only women. However, our study has some limitations. The distribution of postmenopausal women in each group was not equal; approximately 30% of MetSx+, 8% of MetSx−, and 12% of lean patients were postmenopausal. Because of the study design, the effects of menopause on lipid metabolism could not be excluded.
Obtained data confirm excessive lipid accumulation, mainly as TAG in adipose tissue. It most probably results from the increased concentration of both FFA and TAG in the plasma of patients with morbid obesity, although plasma FFA is believed not to reflect the accumulation of fatty acids in adipose tissue directly because the pool of plasma FFA is small compared with that of plasma TAG. Moreover, available reports have confirmed increased concentration of FFA in patients with obesity compared with lean individuals 24, 25, 26. Nevertheless, in subjects with obesity, a chronic elevation of FFA firmly increases the risk of developing MetS 24. However, the present study demonstrated that plasma FFA content did not differ between MetSx+ or MetSx− patients. It is probably a consequence of the medication in the MetSx+ group because approximately 44% of the patients from this group were treated for T2DM. In accordance with our finding, it has been shown that well‐controlled T2DM patients do not have a higher level of FFA in plasma than healthy individuals 21. Similar to the plasma TAG concentration, an increase of total TAG content was observed in MetSx− patients with obesity, whereas the mitochondrial COX IV and CS expression decreased in both studied groups. Previously, it was believed that obesity and insulin resistance impede and disturb the process of β‐oxidation 26. However, nowadays researchers deny this information and indicate that in both experimental animals and humans with insulin resistance, increases in the number of mitochondria and in β‐oxidation can be observed 27, 28. Therefore, it has been suggested that TAG accumulation in patients with obesity is more likely caused by excessive transmembrane LCFA transport exceeding energy requirements 29, 30. Regarding DAG content in human adipose tissue, the knowledge is limited. In concordance with our results, Kotronen et al. 31 observed no differences in total DAG content between lean individuals and individuals with obesity or between MetSx+ and MetSx− patients. On the contrary, Błachnio‐Zabielska et al. 32 showed greater DAG content in SAT and pericardial adipose tissue in patients with obesity compared with lean subjects.
In this study, we demonstrated that MetSx+ patients had significantly increased content of CER in VAT compared with lean patients as well as in relation to SAT (Figure 2E). There have been very few reports on CER metabolism in human fatty tissue. For instance, Błachnio‐Zabielska et al. 32 showed a greater content of CER in pericardial fat in patients with obesity compared with lean patients. Also, Kotronen et al. 31 observed a greater content of CER in VAT compared with SAT in patients with obesity. On the other hand, the rate of CER synthesis is strongly affected by the supply of plasma FFA 33. The main fatty acid in CER of SAT and pericardial fatty tissue in patients with obesity has been shown to be palmitic acid 32. An increased content of palmitic acid activates serine palmitoyltransferase, which catalyzes the first reaction of CER synthesis 34. In our study, we also noticed that palmitic and stearic acids were the most abundant fatty acids of the CER fraction in both adipose tissues (Table 2). Additionally, the current study demonstrated a significantly greater content of CER in VAT of MetSx+ patients compared with SAT (Figure 2E, Table 2), which is mainly due to increased SFA of CER. Therefore, we propose that increased total content of CER and its saturated fraction in VAT may contribute to the development of MetS.
Because of a minor gradient for passive diffusion of fatty acids between the vascular compartment and the interior of the cell, facilitated fatty acid transport across the plasma membrane constitutes more than 90% 35. The most important fatty acid transporters in adipose tissue are FAT/CD36 and FABPpm 36. We found an increase in total and plasma membrane FAT/CD36 expression in VAT of MetSx+ patients (Figure 4A‐4B), whereas FAT/CD36 mitochondrial content was markedly lower in both adipose depots of patients with morbid obesity (Figure 4C). The inhibition of FAT/CD36 has been shown to decrease palmitate oxidation in the mitochondria of both animals 37 and humans 38, suggesting that FAT/CD36 plays an important role in LCFA transport across the mitochondrial membrane in skeletal muscle 37. The data on FAT/CD36 in human adipose tissue are very sparse. A previous study demonstrated greater expression of FAT/CD36 in VAT in patients with obesity compared with lean patients 39. Fisher et al. 40 observed that the expression of FAT/CD36 was higher in patients with obesity. Similarly, Bonen et al. 41 also observed increased expression of FAT/CD36 in SAT of patients with overweight and obesity as well as in patients with T2DM. In contrast, FAT/CD36 in VAT increased only in patients with T2DM. The discrepancy between our study and the other studies may result from at least two factors: (1) We studied Europeans, whereas Bonen et al. 41 studied Americans; (2) our patients (only women) had class 3 obesity (mean BMI > 40), and those (both gender groups) described by Bonen et al. 41 maximally had class 2 obesity (mean BMI < 35). Furthermore, our results demonstrated decreased mitochondrial FAT/CD36 and FABPpm expression in patients with morbid obesity, which perhaps results in a decrease in LCFA transport toward oxidation and energy production in mitochondria. Thus, LCFAs are transported mainly to the endoplasmic reticulum, where they undergo esterification to TAG, which is confirmed by increased total TAG in patients with obesity. Our observation of significantly decreased COX IV (located in the mitochondrial membrane) expression in both VAT and SAT as well as decreased CS (protein of mitochondrial matrix) in VAT indicates that the number of mitochondria in the adipose tissue of patients with morbid obesity is probably decreased compared with that in lean patients.
Obesity has been characterized by a low‐grade inflammatory state (as evidenced by the high circulating levels of inflammatory cytokines) which contributes to the development of insulin resistance and MetS 42. In accordance with this, we found significantly higher expression of TNF‐α in both depots of adipose tissues in women with morbid obesity. Additionally, we observed that obesity can activate the NF‐κβ signaling pathway. Furthermore, the strong correlation between inflammation and obesity is supported by the marked decrease in circulating proinflammatory markers and by improvements in metabolic function following bariatric surgery 43.
Taken altogether, MetS is associated with CER accumulation in VAT in women with morbid obesity. Furthermore, we demonstrated that total plasma membrane as well as mitochondrial expression of FAT/CD36 and FABPpm in MetSx+ patients with morbid obesity undergoes greater changes in visceral versus subcutaneous fatty tissue. Our finding that the content of CER increases in VAT in relation to SAT in MetSx+ patients with class 3 obesity provides new insight into the potential pathomechanism of insulin resistance typical of MetSx+ patients.
Supporting information
Funding agencies: This work was supported by the National Science Center (grant 2016/23/D/NZ3/01660) and the Medical University of Białystok (grants 133‐40795L, 113‐40698L, and 153‐40749L). AM is supported by the Foundation for Polish Science (FNP) (grants START 67.2018).
Disclosure: The authors declared no conflict of interest.
Author contributions: BC wrote the original draft and was responsible for the generation of figures and the collection of material. JD, AM, AC, and PM designed the study. BC, AM, and HM took measurements, collected the data, and were responsible for the interpretation of the results. HRH searched the literature and approved the submitted work. AM was involved in corrections and critical reading of the final manuscript and was responsible for funding acquisition.
References
- 1. World Health Organization . Obesity and overweight.https://www.who.int/news-room/fact-sheets/detail/obesity-and-overweight. Accessed February 16, 2018.
- 2. Hajer GR, van Haeften TW, Visseren FL. Adipose tissue dysfunction in obesity, diabetes, and vascular diseases. Eur Heart J 2008;29:2959‐2971. [DOI] [PubMed] [Google Scholar]
- 3. Armani A, Berry A, Cirulli F, Caprio M. Molecular mechanisms underlying metabolic syndrome: the expanding role of the adipocyte. FASEB J 2017;31:4240‐4255. [DOI] [PubMed] [Google Scholar]
- 4. Elffers TW, de Mutsert R, Lamb HJ, et al. Body fat distribution, in particular visceral fat, is associated with cardiometabolic risk factors in obese women. PLoS One 2017;12:e0185403. doi: 10.1371/journal.pone.0185403 [DOI] [PMC free article] [PubMed] [Google Scholar]
- 5. Ali AH, Koutsari C, Mundi M, et al. Free fatty acid storage in human visceral and subcutaneous adipose tissue: role of adipocyte proteins. Diabetes 2011;60:2300‐2307. [DOI] [PMC free article] [PubMed] [Google Scholar]
- 6. Bonen A, Dohm GL, van Loon LJ. Lipid metabolism, exercise and insulin action. Essays Biochem 2006;42:47‐59. [DOI] [PubMed] [Google Scholar]
- 7. Consitt LA, Bell JA, Houmard JA. Intramuscular lipid metabolism, insulin action, and obesity. IUBMB Life 2009;61:47‐55. [DOI] [PMC free article] [PubMed] [Google Scholar]
- 8. Bonen A, Holloway GP, Tandon NN, et al. Cardiac and skeletal muscle fatty acid transport and transporters and triacylglycerol and fatty acid oxidation in lean and Zucker diabetic fatty rats. Am J Physiol Regul Integr Comp Physiol 2009;297:R1202‐R1212. [DOI] [PubMed] [Google Scholar]
- 9. Bonen A, Parolin ML, Steinberg GR, et al. Triacylglycerol accumulation in human obesity and type 2 diabetes is associated with increased rates of skeletal muscle fatty acid transport and increased sarcolemmal FAT/CD36. FASEB J 2004;18:1144‐1146. [DOI] [PubMed] [Google Scholar]
- 10. Luiken JJ, Arumugam Y, Dyck DJ, et al. Increased rates of fatty acid uptake and plasmalemmal fatty acid transporters in obese Zucker rats. J Biol Chem 2001;276:40567‐40573. [DOI] [PubMed] [Google Scholar]
- 11. Choromańska B, Myśliwiec P, Dadan J, Hady HR, Chabowski A. The clinical significance of fatty acid binding proteins [in Polish]. Postepy Hig Med Dosw (Online) 2011;65:759‐763. [DOI] [PubMed] [Google Scholar]
- 12. Gargiulo CE, Stuhlsatz‐Krouper SM, Schaffer JE. Localization of adipocyte long‐chain fatty acyl‐CoA synthetase at the plasma membrane. J Lipid Res 1999;40:881‐892. [PubMed] [Google Scholar]
- 13. Mikłosz A, Łukaszuk B, Żendzian‐Piotrowska M, Kurek K, Chabowski A. The effects of AS160 modulation on fatty acid transporters expression and lipid profile in L6 myotubes. Cell Physiol Biochem 2016;38:267‐282. [DOI] [PubMed] [Google Scholar]
- 14. Mikłosz A, Łukaszuk B, Żendzian‐Piotrowska M, Brańska‐Januszewska J, Ostrowska H, Chabowski A. Challenging of AS160/TBC1D4 alters intracellular lipid milieu in L6 myotubes incubated with palmitate. J Cell Physiol 2017;232:2373‐2386. [DOI] [PMC free article] [PubMed] [Google Scholar]
- 15. Alkhateeb H, Chabowski A, Bonen A. Viability of the isolated soleus muscle during long‐term incubation. Appl Physiol Nutr Metab 2006;31:467‐476. [DOI] [PubMed] [Google Scholar]
- 16. Miklosz A, Chabowski A, Zendzian‐Piotrowska M, Gorski J. Effects of hyperthyroidism on lipid content and composition in oxidative and glycolytic muscles in rats. J Physiol Pharmacol 2012;63:403‐410. [PubMed] [Google Scholar]
- 17. Nawrocki A, Górski J. Effect of plasma free fatty acid concentration on the content and composition of the free fatty acid fraction in rat skeletal muscles. Horm Metab Res 2004;36:601‐606. [DOI] [PubMed] [Google Scholar]
- 18. Bligh EG, Dyer WJ. A rapid method of total lipid extraction and purification. Can J Biochem Physiol 1959;37:911‐917. [DOI] [PubMed] [Google Scholar]
- 19. Conquer J, Mahadevappa VG. Evidence for the possible involvement of protein kinase C in the activation of non‐specific phospholipase A2 in human neutrophils. J Lipid Mediat 1991;3:113‐123. [PubMed] [Google Scholar]
- 20. Morrison WR, Smith LM. Preparation of fatty acid methyl esters and dimethylacetals from lipids with boron fluoride–methanol. J Lipid Res 1964;5:600‐608. [PubMed] [Google Scholar]
- 21. Karpe F, Dickmann JR, Frayn KN. Fatty acids, obesity, and insulin resistance: time for a reevaluation. Diabetes 2011;60:2441‐2449. [DOI] [PMC free article] [PubMed] [Google Scholar]
- 22. Christie WW. A simple procedure for rapid transmethylation of glycerolipids and cholesteryl esters. J Lipid Res 1982;23:1072‐1075. [PubMed] [Google Scholar]
- 23. Tankó LB, Bruun JM, Alexandersen P, et al. Novel associations between bioavailable estradiol and adipokines in elderly women with different phenotypes of obesity: Implications for atherogenesis. Circulation 2004;110:2246‐2252. [DOI] [PubMed] [Google Scholar]
- 24. Vistisen B, Hellgren LI, Vadset T, et al. Effect of gender on lipid‐induced insulin resistance in obese subjects. Eur J Endocrinol 2008;158:61‐68. [DOI] [PubMed] [Google Scholar]
- 25. Schmitz‐Peiffer C. Protein kinase C and lipid‐induced insulin resistance in skeletal muscle. Ann N Y Acad Sci 2002;967:146‐157. [DOI] [PubMed] [Google Scholar]
- 26. Holloway GP, Lally J, Nickerson JG, et al. Fatty acid binding protein facilitates sarcolemmal fatty acid transport but not mitochondrial oxidation in rat and human skeletal muscle. J Physiol 2007;582:393‐405. [DOI] [PMC free article] [PubMed] [Google Scholar]
- 27. Holloway GP, Benton CR, Mullen KL, et al. In obese rat muscle transport of palmitate is increased and is channeled to triacylglycerol storage despite an increase in mitochondrial palmitate oxidation. Am J Physiol Endocrinol Metab 2009;296:E738‐E747. [DOI] [PubMed] [Google Scholar]
- 28. Holloway GP, Thrush AB, Heigenhauser GJ, et al. Skeletal muscle mitochondrial FAT/CD36 content and palmitate oxidation are not decreased in obese women. Am J Physiol Endocrinol Metab 2007;292:E1782‐E1789. [DOI] [PubMed] [Google Scholar]
- 29. Jung HL, Kang HY. Effects of endurance exercise and high‐fat diet on insulin resistance and ceramide contents of skeletal muscle in Sprague‐Dawley rats. Korean Diabetes J 2010;34:244‐252. [DOI] [PMC free article] [PubMed] [Google Scholar]
- 30. Ritchie IR, Gulli RA, Stefanyk LE, Harasim E, Chabowski A, Dyck DJ. Restoration of skeletal muscle leptin response does not precede the exercise‐induced recovery of insulin‐stimulated glucose uptake in high‐fat‐fed rats. Am J Physiol Regul Integr Comp Physiol 2011;300:R492‐R500. [DOI] [PubMed] [Google Scholar]
- 31. Kotronen A, Seppänen‐Laakso T, Westerbacka J, et al. Comparison of lipid and fatty acid composition of the liver, subcutaneous and intra‐abdominal adipose tissue, and serum. Obesity (Silver Spring) 2010;18:937‐944. [DOI] [PubMed] [Google Scholar]
- 32. Błachnio‐Zabielska AU, Baranowski M, Hirnle T, et al. Increased bioactive lipids content in human subcutaneous and epicardial fat tissue correlates with insulin resistance. Lipids 2012;47:1131‐1141. [DOI] [PMC free article] [PubMed] [Google Scholar]
- 33. Kolak M, Westerbacka J, Velagapudi VR, et al. Adipose tissue inflammation and increased ceramide content characterize subjects with high liver fat content independent of obesity. Diabetes 2007;56:1960‐1968. [DOI] [PubMed] [Google Scholar]
- 34. Zheng W, Kollmeyer J, Symolon H, et al. Ceramides and other bioactive sphingolipid backbones in health and disease: lipidomic analysis, metabolism and roles in membrane structure, dynamics, signaling and autophagy. Biochim Biophys Acta 2006;1758:1864‐1884. [DOI] [PubMed] [Google Scholar]
- 35. Dubikovskaya E, Chudnovskiy R, Karateev G, Park HM, Stahl A. Measurement of long‐chain fatty acid uptake into adipocytes. Methods Enzymol 2014;538:107‐134. [DOI] [PMC free article] [PubMed] [Google Scholar]
- 36. Hames KC, Koutsari C, Santosa S, Bush NC, Jensen MD. Adipose tissue fatty acid storage factors: effects of depot, sex and fat cell size. Int J Obes (Lond) 2015;39:884‐887. [DOI] [PMC free article] [PubMed] [Google Scholar]
- 37. Bezaire V, Bruce CR, Heigenhauser GJ, et al. Identification of fatty acid translocase on human skeletal muscle mitochondrial membranes: essential role in fatty acid oxidation. Am J Physiol Endocrinol Metab 2006;290:E509‐E515. [DOI] [PubMed] [Google Scholar]
- 38. Campbell SE, Tandon NN, Woldegiorgis G, Luiken JJ, Glatz JF, Bonen A. A novel function for fatty acid translocase (FAT)/CD36: involvement in long chain fatty acid transfer into the mitochondria. J Biol Chem 2004;279:36235‐36241. [DOI] [PubMed] [Google Scholar]
- 39. Grzegorczyk EA, Harasim‐Symbor E, Lukaszuk B, et al. Lack of pronounced changes in the expression of fatty acid handling proteins in adipose tissue and plasma of morbidly obese humans. Nutr Diabetes 2018;8:3. doi: 10.1038/s41387-017-0013-x [DOI] [PMC free article] [PubMed] [Google Scholar]
- 40. Fisher RM, Hoffstedt J, Hotamisligil GS, Thörne A, Rydén M. Effects of obesity and weight loss on the expression of proteins involved in fatty acid metabolism in human adipose tissue. Int J Obes Relat Metab Disord 2002;26:1379‐1385. [DOI] [PubMed] [Google Scholar]
- 41. Bonen A, Tandon NN, Glatz JF, Luiken JJ, Heigenhauser GJ. The fatty acid transporter FAT/CD36 is upregulated in subcutaneous and visceral adipose tissues in human obesity and type 2 diabetes. Int J Obes (Lond) 2006;30:877‐883. [DOI] [PubMed] [Google Scholar]
- 42. Trayhurn P, Wood IS. Adipokines: inflammation and the pleiotropic role of white adipose tissue. Br J Nutr 2004;92:347‐355. [DOI] [PubMed] [Google Scholar]
- 43. Frühbeck G. Bariatric and metabolic surgery: a shift in eligibility and success criteria. Nat Rev Endocrinol 2015;11:465‐477. [DOI] [PubMed] [Google Scholar]
Associated Data
This section collects any data citations, data availability statements, or supplementary materials included in this article.
Supplementary Materials