Abstract
We evaluated the pharmacokinetics, pharmacodynamics, and safety of evolocumab, a fully human monoclonal antibody against proprotein convertase subtilisin kexin type 9 (PCSK9), in an open‐label, parallel‐design study in participants with normal renal function (n = 6), severe renal impairment (RI; n = 6), or end‐stage renal disease (ESRD) receiving hemodialysis (n = 6) who received a single 140‐mg dose of evolocumab. The effects of evolocumab treatment on low‐density lipoprotein cholesterol (LDL‐C) lowering and unbound PCSK9 concentrations were similar in the normal renal function group and the renally impaired groups. Geometric mean Cmax and AUClast values in the severe RI and ESRD hemodialysis groups compared with the normal renal function group were lower but within 37% of the normal renal function group (Jonckheere‐Terpstra trend test; Cmax, P = .23; AUClast, P = .22) and within 26% after adjusting for body weight (mean body weight was approximately 9% higher in the renally impaired groups compared with the normal renal function group). No correlations were observed between exposure and baseline creatinine clearance. No adverse event was determined by the investigators to be related to evolocumab, and there were no trends indicative of clinically important effects on laboratory variables or vital signs. Overall, there were no meaningful differences in evolocumab exposure, as assessed by Cmax and AUClast, in patients with severe RI and ESRD hemodialysis compared with patients with normal renal function, and LDL‐C‐lowering effects were similar across groups. These results support the use of evolocumab without dose adjustment in patients who have severe RI or ESRD.
Keywords: evolocumab, human monoclonal antibody, LDL‐C, pharmacokinetics and pharmacodynamics, PCSK9, renal impairment
Evolocumab is a fully human monoclonal IgG2 antibody that specifically binds to human proprotein convertase subtilisin kexin type 9 (PCSK9), a protein that is primarily synthesized in the liver and secreted in the blood.1 PCSK9 binds to the low‐density lipoprotein (LDL) receptor, a major regulator of LDL cholesterol (LDL‐C), enhances degradation of the LDL receptor, thereby lowering levels of the receptor in circulation and consequently increasing circulating levels of LDL‐C.2 Treatment with evolocumab, through its PCSK9‐inhibitory effects, results in a significant reduction in LDL‐C levels in patients with hypercholesterolemia.3
Evolocumab, like other monoclonal antibodies, undergoes elimination by both linear and nonlinear pathways. As a result of binding to PCSK9, evolocumab exhibits nonlinear pharmacokinetics (PK). This saturable elimination pathway is predominately evident at doses less than 140‐mg.4 At higher doses, evolocumab primarily exhibits nonsaturable elimination by an endogenous IgG clearance mechanism. The maximum suppression of circulating PCSK9 occurs within 4 hours of a single subcutaneous dose of evolocumab. The clearance of evolocumab decreases as the dose and exposure of evolocumab increase. In phase 1 and 2 studies, approximately linear PK was observed for doses greater than 140‐mg.5 Because a portion of overall evolocumab clearance is mediated by PCSK9, differences in PCSK9 concentrations could have an impact on evolocumab PK and LDL‐C lowering, and the impact of severe renal impairment (RI) or end‐stage renal disease (ESRD) on PCSK9 is unknown.
Limited data are available on the effect of chronic RI on the PK and disposition of therapeutic monoclonal antibodies. The available clinical evidence supports a lack of effect of mild or moderate RI on the clearance of evolocumab, which is similar to the clearance of other large monoclonal antibodies.4 Current US Food and Drug Administration recommendations offer minimal guidance on the disposition of therapeutic proteins in patients with RI.6 The recommendations state that RI is not likely to change the PK of monoclonal antibodies enough to warrant an adjustment to dosage; however, a study to confirm this would be beneficial, especially when patients with chronic kidney disease are likely to use a therapeutic protein.
It is unknown whether evolocumab PK, or its effects on LDL‐C and PCSK9 levels, are affected by chronic RI. This study was conducted to assess the impact of severe RI and ESRD on the PK, pharmacodynamics (PD), and safety of evolocumab and on the levels of LDL‐C and PCSK9 after a single 140‐mg subcutaneous evolocumab dose in patients on stable doses of a statin.
Methods
The institutional review board for this study, Schulman Associates Institutional Review Board (Cincinnati, Ohio), approved the study protocol and the informed consent form. All patients provided written informed consent before undergoing any study‐related procedures, including screening procedures.
Study Design
This open‐label, single‐dose study was conducted in 1 center (Denver Nephrologists, Denver, Colorado) in the United States to evaluate the impact of renal function on evolocumab PK/PD. Participants were assigned to 1 of 3 renal function groups based on estimated glomerular filtration rate (eGFR): normal renal function (eGFR ≥ 90 mL/min/1.73 m2), severe RI (eGFR, 15–29 mL/min/1.73 m2), and ESRD receiving hemodialysis (assessed using the Modification of Diet in Renal Disease formula).7 Patients, aged 18 to 70 years, were required to have a body mass index of 18 to 35 kg/m2 and an LDL‐C value of 70 to 190‐mg/dL (inclusive) and be on statin therapy at the time of screening. The statin dose must have been stable for ≥3 months before screening, expected to remain unchanged for the remainder of the study, and be consistent with the prescribing information for the respective statin. On study day 1, eligible patients received a single 140‐mg subcutaneous dose (1 mL) of evolocumab (Amgen Inc., Thousand Oaks, California) administered into the anterior abdominal wall using an autoinjector. Samples were collected for PK, lipid, and PCSK9 analysis on days 1 (predose), 2, 3, 4, 6, 8, 11, 15, 22, 29, 43, 50, and 57; PK and PCSK9 samples were also collected 4 hours postdose on day 1. Serum samples were collected for the measurement of antievolocumab antibodies on days 29 and 57. Baseline creatinine clearance (CrCl) was calculated using the Cockcroft‐Gault formula.8 The primary end points were maximum unbound serum concentration (Cmax) and area under the concentration‐time curve from time 0 to time of last quantifiable concentration (AUClast), and secondary end points included area under the LDL‐C effect‐time curve from day 1 to 57 (AUECday1–57), PCSK9 levels, and safety.
Analytical Methods
A central laboratory analyzed the lipids, high‐density lipoprotein cholesterol, LDL‐C, total cholesterol, and triglycerides. Antievolocumab antibodies were assessed at Amgen Inc.; PK analysis of evolocumab and assessment of PCSK9 levels were performed at PPD LP (Richmond, Virginia).
Unbound evolocumab concentrations in human serum were quantified using a validated enzyme‐linked immunosorbent assay (ELISA) that used highly specific anti‐idiotype antibodies for capture and detection of evolocumab.9 As the anti‐idiotype antibodies bound to the antigen‐combining site of evolocumab, these antibodies do not bind to evolocumab bound to PCSK9. The accuracy (percentage difference from nominal concentration) and precision (percentage coefficient of variation) of the assay were ±15% and ≤15%, respectively, for standards and ±20% and ≤15%, respectively, for quality control samples. The lower limit of quantification of the ELISA assay was 800 ng/mL.
Unbound PCSK9 was measured in human serum using an ELISA method.4, 10 In the assay, evolocumab was used for capture, and a second bioconjugated anti‐PCSK9 antibody was used for detection to ensure PCSK9 bound to evolocumab was not measured. The accuracy and precision of the analytical method for the quantification of PCSK9 in human serum were ±15% and ≤20%, respectively, for standards and ±25% and ≤20%, respectively, for quality control samples. The lower limit of quantification for the assay was 15.0 ng/mL.
Binding antibodies were detected by an electrochemiluminescence‐based bridging immunoassay method using the Meso Scale Discovery platform (Meso Scale Diagnostics, LLC, Rockville, Massachusetts), which followed a 2‐tiered assay approach consisting of a screening assay and a specificity assay. The sensitivities for the screening and specificity assays were 6 and 10.2 ng/mL, respectively, with a lower limit of reliable detection of 160 ng/mL.
Statistical Methods
Unbound evolocumab PK parameters Cmax, AUClast, area under the concentration‐time curve from time zero to infinity (AUCinf), and time to Cmax (tmax) were estimated using noncompartmental PK analysis methods in Phoenix WinNonlin version 6.3 (Pharsight Corporation, St. Louis, Missouri). AUCinf was determined in patients with mean extrapolated AUC < 20%. AUECday1‐57 for LDL‐C was calculated for each patient using the following formula:
The variables include Ci, value of the LDL‐C at time ti; Ci‐1, value of LDL‐C at the previous time of ti‐1; t1, first time within the range; and tT, last time within the range; t1 is day 1 predose for all patients, and tT is day 57 for all patients. All PK and PD data were log‐transformed prior to statistical analysis.
Analysis of variance was performed on the PK parameters AUClast, Cmax, and AUCinf. Ratios of the least‐squares geometric mean differences and corresponding 90% confidence intervals (CIs) between the renally impaired groups (severe RI and ESRD receiving hemodialysis) and the normal renal function group were estimated. Nonparametric statistical tests are more appropriate to use with small sample sizes, as they require less assumption around data normality and equal variances. The nonparametric Jonckheere‐Terpstra (JT) trend test is a rank‐based nonparametric test used to determine if there is statistical significance between an independent variable, such as renal function, and a dependent variable, such as exposure.11 In this study, the JT trend test was used to assess the effect of decreasing renal function (normal renal function > ESRD receiving hemodialysis > severe RI) on evolocumab exposure. The order of the JT test was prespecified in the clinical trial protocol and was based on prior knowledge of the severity of renal function. Regression analysis was used to assess the relationship between baseline CrCl and exposure. Only patients for whom a PK parameter could be derived were included in the statistical analyses.
PD end points (LDL‐C and PCSK9) were analyzed using a repeated‐measures mixed‐effects model (independent variables: renal function group, time, and renal function group by time interaction; covariate: baseline value; and random effect: patient). Analysis of covariance model was performed on the log‐transformed AUECday1‐57 data. The JT trend test evaluated the effect of decreasing renal function (normal renal function > ESRD receiving hemodialysis > severe RI) on PD data (baseline PCSK9, baseline LDL‐C, and AUECday1‐57). Regression analysis was used to assess the relationship between baseline CrCl and AUECday1‐57.
All statistical analyses were performed using SAS version 9.2 software (SAS Institute Inc., Cary, North Carolina); a P < .05 was considered significant.
Safety Analysis
The Medical Dictionary for Regulatory Activities, version 17.1, was used to code all adverse events (AEs) to a system organ class and a preferred term. The incidence of AEs was summarized for overall AEs, serious AEs, serious treatment‐related AEs, and those leading to withdrawal from the study. The severity of each AE was graded using Common Terminology Criteria for Adverse Events, version 4.0.
Results
Baseline Characteristics
Table 1 summarizes baseline characteristics by renal function group. Eighteen patients were enrolled, including 6 in each of the normal, severe RI, and ESRD receiving hemodialysis groups. In this study, 61% of patients were men, 67% were white, and the mean ± standard deviation (SD) age of patients at baseline was 57.2 ± 9.6 years. Patients in the normal renal function group were younger and weighed less. Mean ± SD baseline LDL‐C and PCSK9 levels of the patients were 115.8 ± 38.2 mg/dL and 458.0 ± 150.3 ng/mL, respectively.
Table 1.
Patient Demographics and Baseline Characteristics
| Normal Renal Function | Severe Renal Impairment | ESRD Receiving Hemodialysis | Total | |
|---|---|---|---|---|
| (n = 6) | (n = 6) | (n = 6) | (n = 18) | |
| Male, n (%) | 4 (66.7) | 4 (66.7) | 3 (50.0) | 11 (61.1) |
| Race, n (%) | ||||
| Black (or African American) | 1 (16.7) | 1 (16.7) | 4 (66.7) | 6 (33.3) |
| White | 5 (83.3) | 5 (83.3) | 2 (33.3) | 12 (66.7) |
| Ethnicity, n (%) | ||||
| Hispanic/Latino | 0 (0) | 0 (0) | 0 (0) | 0 (0) |
| Non‐Hispanic/Latino | 6 (100) | 6 (100) | 6 (100) | 18 (100) |
| Age (y) | 51.2 (9.9) | 63.3 (7.8) | 57.0 (8.1) | 57.2 (9.6) |
| Weight (kg) | 79.5 (17.8) | 87.3 (16.7) | 87.6 (12.8) | 84.8 (15.4) |
| BMI (kg/m2) | 25.1 (2.7) | 27.1 (3.7) | 30.3 (4.3) | 27.5 (4.0) |
| eGFRa (mL/min/1.73 m2) | 96.5 (9.1) | 22.3 (5.5) | N/A | N/A |
| CrCl (mL/min) | 105.9 (25.8) | 31.7 (7.3) | 10.7 (3.0) | 49.4 (44.5) |
| LDL‐C, ultracentrifugation (mg/dL) | 131.8 (43.5) | 94.3 (14.1) | 121.2 (44.3) | 115.8 (38.2) |
| PCSK9 (ng/mL) | 464 (89) | 424 (172) | 486 (192) | 458 (150) |
BMI, body mass index; CrCl, creatinine clearance; eGFR, estimated glomerular filtration rate; ESRD, end‐stage renal disease; LDL‐C, low‐density lipoprotein cholesterol; N/A, not applicable; PCSK9, proprotein convertase subtilisin kexin type 9; SD, standard deviation.
Data are presented as mean (SD) unless otherwise noted.
eGFR was not derived for the ESRD receiving hemodialysis group. Patients established on dialysis per protocol are considered to have no clinically meaningful native or endogenous clearance from their kidneys (ie, < 15 mL/min), and as such, there is no need to calculate clearance.
Serum Unbound Evolocumab Pharmacokinetics
Mean ± SD concentration‐time PK profiles of unbound evolocumab are presented in Figure 1. Individual values for Cmax, AUClast, and AUCinf are plotted in Figure 2. A summary of PK parameters by renal function group is provided in Table 2. After a single 140‐mg subcutaneous dose, evolocumab was rapidly absorbed in all groups, with median tmax between 3 and 5 days after dosing (Table 2). The severe RI and ESRD receiving hemodialysis groups had geometric mean Cmax values that were approximately 35% and 33% lower, respectively, than the normal renal function group and AUClast values that were 37% and 35% lower, respectively. AUCinf values were 3% higher for the severe RI group and 33% lower for the ESRD receiving hemodialysis group than the normal renal function group. However, no significant trend was seen between Cmax or AUClast or AUCinf and decreasing level of renal function (P = .23, P = .22, and P = .77, respectively; Table 3), and there was overlap in exposure among the groups (Figure 2). However, due to the limited sample size in the severe RI group, in which AUCinf could not be calculated for 3 patients, caution should be used in the interpretation of these results.
Figure 1.
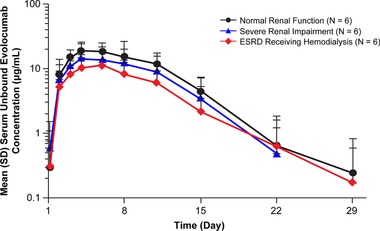
Mean ± standard deviation serum unbound evolocumab concentration‐time profiles from normal renal function, severe renal impairment, or ESRD receiving hemodialysis patients after a single 140‐mg subcutaneous dose of evolocumab, depicted as a log‐linear plot. The lower limit of quantification was 0.8 μg/mL. ESRD, end‐stage renal disease; SD, standard deviation.
Figure 2.
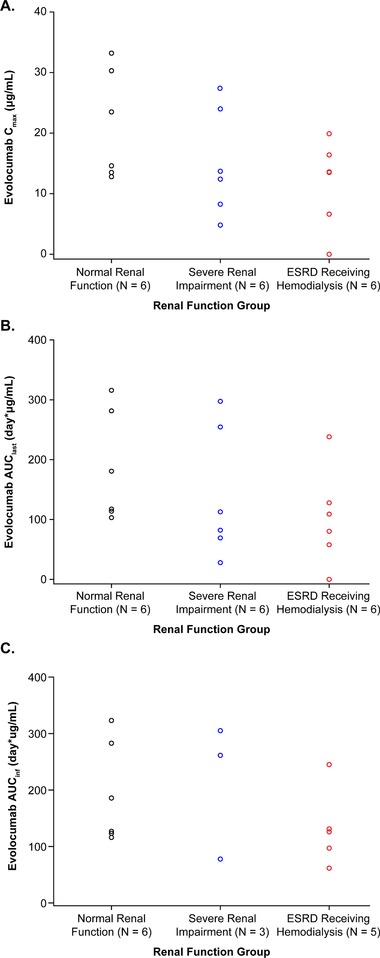
Scatterplots of individual values for (A) Cmax, (B) AUClast, and (C) AUCinf. AUClast, area under the drug concentration‐time curve from time zero to time of last quantifiable concentration; AUCinf, area under the drug concentration‐time curve from time zero to infinity; Cmax, maximum observed drug concentration; ESRD, end‐stage renal disease.
Table 2.
Descriptive Statistics for Pharmacokinetic Parameter Estimates of Unbound Evolocumab After a Single 140‐mg Subcutaneous Dose
| Normal Renal Function | Severe Renal Impairment | ESRD Receiving Hemodialysis | |
|---|---|---|---|
| (n = 6) | (n = 6)a | (n = 6)b | |
| tmax (day), median (Q1, Q3) | 3.1 (3.0, 5.0) | 4.0 (3.0, 5.0) | 4.9 (3.1, 5.0) |
| Cmax (μg/mL), mean (SD) | 21.3 (9.0) | 15.1 (8.9) | 11.7 (7.2) |
| AUClast (day × μg/mL), mean (SD) | 185 (92) | 141 (109) | 102 (80) |
| AUCinf (day × μg/mL), mean (SD) | 195 (90) | 215 (121) | 132 (69) |
AUClast, area under the drug concentration‐time curve from time zero to time of last quantifiable concentration; AUCinf, area under the drug concentration‐time curve from zero to infinity; Cmax, maximum observed drug concentration; ESRD, end‐stage renal disease; Q, quartile; SD, standard deviation; tmax, time to reach Cmax.
Three patients had noncalculable AUCinf.
One patient's serum concentrations were below the lower limit of quantification and were not evaluable for tmax and were set to 0 for estimation of AUClast and Cmax. One patient had noncalculable AUCinf.
Table 3.
Statistical Analysis of Unbound Evolocumab Pharmacokinetic Parameters After a Single Subcutaneous 140‐mg Dose of Evolocumab by Renal Function Group
| Parameter | Renal Function Group | N | LS Geometric Mean | LS Geometric Mean Ratio, % (90%CI)a | JT test P‐Valueb |
|---|---|---|---|---|---|
| Cmax (μg/mL) | Normal | 6 | 19.8 | .23 | |
| Severe renal impairment | 6 | 12.8 | 64.9 (38.4–109.6) | ||
| ESRD receiving hemodialysis | 5 | 13.2 | 66.6 (38.4–115.6) | ||
| AUClast (day × μg/mL) | Normal | 6 | 167.6 | .22 | |
| Severe renal impairment | 6 | 105.2 | 62.8 (31.9–123.4) | ||
| ESRD receiving hemodialysis | 5 | 109.0 | 65.1 (32.0–132.1) | ||
| AUCinf (day × μg/mL) | Normal | 6 | 178.8 | .77 | |
| Severe renal impairment | 3 | 183.6 | 102.7 (52.2–202.1) | ||
| ESRD receiving hemodialysis | 5 | 119.2 | 66.7 (37.3–119.1) |
AUClast, area under the drug concentration‐time curve from time zero to time of last quantifiable concentration; AUCinf, area under the drug concentration‐time curve from zero to infinity; CI, confidence interval; Cmax, maximum observed drug concentration; ESRD, end‐stage renal disease; JT, Jonckheere‐Terpstra; LS, least squares.
LS geometric mean from the SAS PROC MIXED procedure are based on natural log scale data converted back to the original scale. Ratio and CI are multiplied by 100 to express the RI group response as a percentage of the normal renal function group.
P‐value determined using the JT trend test. Group ordering for trend test: normal renal function, ESRD receiving hemodialysis, and severe RI.
Scatterplots of log‐transformed evolocumab Cmax and AUClast versus baseline CrCl are shown in Figure 3. Renal function, as assessed by baseline CrCl, had no significant effect on Cmax (r 2 = 0.06, P = .33) and AUClast (r 2 = 0.03, P = .47).
Figure 3.
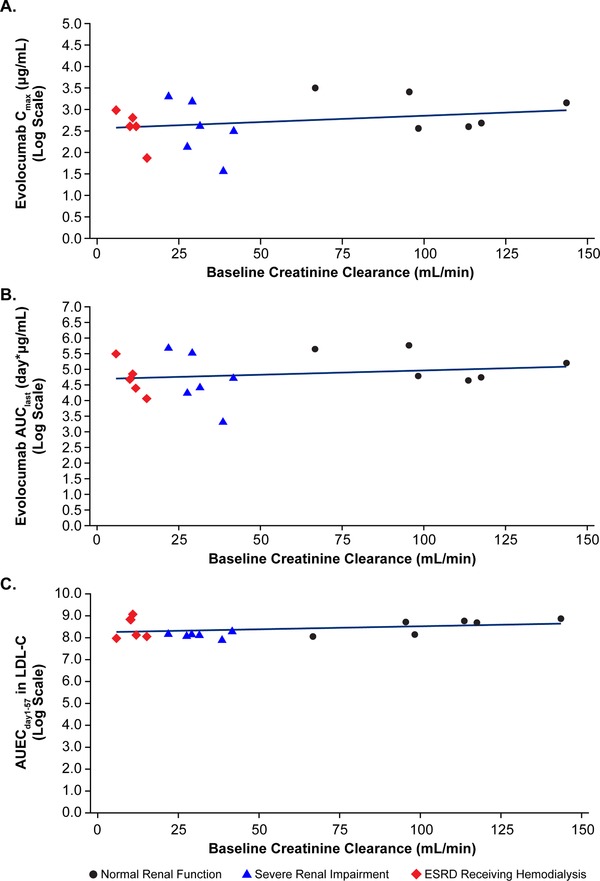
Scatterplots of individual log‐transformed values for (A) Cmax, (B) AUClast, and (C) AUECday1‐57 for LDL‐C versus baseline CrCl with regression line. AUClast, area under the drug concentration‐time curve from time zero to time of last quantifiable concentration; AUECday1‐57, area under the effect‐time curve from day 1 to 57; Cmax, maximum observed drug concentration; CrCl, creatinine clearance; ESRD, end‐stage renal disease; LDL‐C, low‐density lipoprotein cholesterol.
Ultracentrifugation LDL‐C Pharmacodynamics
Mean percent change from baseline in LDL‐C over time for each renal function group is shown in Figure 4. Nadir LDL‐C mean percent change from baseline concentration was observed between study days 11 and 15 in each group. The maximum mean percentage change in LDL‐C (95%CI) from baseline was −60% (−68% to −51%) in the normal renal function group, −58% (−66% to −48%) in the severe RI group, and −49% (−58% to −38%) in the ESRD receiving hemodialysis group. No significant difference in LDL‐C AUECday1‐57 was observed when comparing patients with RI with those with normal renal function. Least‐squares geometric mean values of LDL‐C AUECday1‐57 were 4440, 4090, and 4620 mg·day/dL for patients with normal renal function, severe RI, and ESRD receiving hemodialysis, respectively. Thus, the geometric mean LDL‐C AUECday1‐57 ratios (95%CIs) of severe RI patients and ESRD patients were 0.92 (0.75–1.13) and 1.04 (0.86–1.26), respectively, compared with patients with normal renal function. No significant association was observed with AUECday1–57 for LDL‐C and decreasing level of renal function (JT trend test, P = .23), and renal function as assessed by baseline CrCl had no significant effect on AUECday1–57 for LDL‐C (r 2 = 0.11, P = .19). A scatterplot of log‐transformed evolocumab AUECday1–57 versus baseline CrCl is shown in Figure 3.
Figure 4.
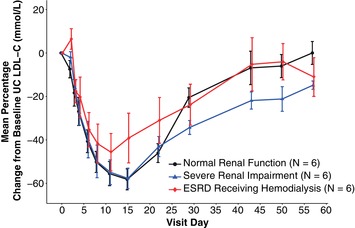
Mean percent change ± standard error from baseline of UC LDL‐C (mg/dL) over time by degree of renal impairment. ESRD, end‐stage renal disease; LDL‐C, low‐density lipoprotein cholesterol; UC, ultracentrifugation.
PCSK9 Pharmacodynamics
Figure 5 shows PCSK9 suppression following a single 140‐mg subcutaneous dose of evolocumab. Mean percent change from baseline in PCSK9 concentration decreased rapidly in each renal function group 4 hours after the first dose (>73%), reaching a nadir of >94% from day 2 through day 11 before gradually returning toward concentrations seen at baseline. Similar magnitudes and durations of reduction in PCSK9 were seen for patients with RI and those with normal renal function.
Figure 5.
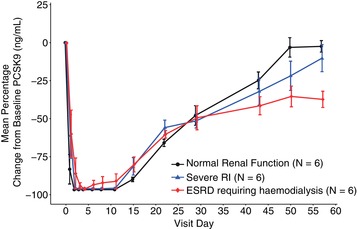
Mean percent change ± standard error from baseline of PCSK9 over time by degree of renal impairment. ESRD, end‐stage renal disease; PCSK9, proprotein convertase subtilisin kexin type 9.
Safety
AEs were reported in 4 patients: 1 patient with normal renal function (17%), 1 with severe RI (17%), and 2 with ESRD receiving hemodialysis (33%). A serious AE of hyperkalemia (6.3 mmol/L) was reported for 1 patient in the study (6%). The investigator attributed this event in a patient with severe RI to chronic kidney disease, and the event resolved with administration of sodium polystyrene sulfonate. The investigator determined that the AE was not related to study treatment, and the patient continued study participation. There were no trends indicative of clinically important effects on laboratory variables or vital signs, and no patient tested positive for antievolocumab antibodies. No AE was reported in more than 1 patient, and no patient discontinued evolocumab treatment because of an AE.
Discussion
In this study, mean systemic evolocumab exposure was lower in patients with severe RI and ESRD receiving hemodialysis compared with patients with normal renal function after a single 140‐mg dose of evolocumab. Patients with severe RI and ESRD had geometric mean Cmax and AUClast that were within 37% of patients with normal renal function with no adjustment for body weight and within 26% after adjustment for body weight. Nonparametric analysis did not demonstrate a significant association between Cmax or AUClast with decreasing level of renal function (Table 3). Of note, least‐squares geometric mean evolocumab exposure values in patients with normal renal function were higher than recently reported.9 This may be because of the small sample size and the large interpatient PK variability observed in this study. Patients in the normal renal function group weighed less than patients in the renally impaired groups. However, when PK values were adjusted for weight and the renally impaired groups were compared with the normal renal function group, the reduction was between 25% and 26% for Cmax and between 24% and 25% for AUClast. Renal function, as assessed by baseline CrCl, had no significant effect on the primary end points; thus, the exposures in RI are within the PK variability in the evolocumab development program.4, 9
Glomerular filtration of monoclonal antibodies is limited by the size of the molecule; glomeruli normally restrict compounds greater than 70 kDa.12 Thus, there is minimal renal filtration for monoclonal antibodies such as evolocumab (145 kDa).12, 13 This is in contrast with typical small‐molecule drugs, which are often excreted by the kidney and for which RI may increase drug exposure, possibly necessitating dose reduction.14 Although it can be postulated that this filter might not be intact in patients with chronic kidney disease and renal elimination may not play a role, there was no trend for lower systemic exposure with increased proteinuria in the severe RI group. Furthermore, the lowest systemic exposure was observed in patients with ESRD receiving hemodialysis who had minimal renal filtration.
Evolocumab, like other monoclonal antibodies, is eliminated via protein catabolism into smaller peptides and amino acids following either nonspecific endocytosis into lysosomes or target‐mediated clearance via its target, PCSK9. Mean baseline serum PCSK9 levels and the time course of PCSK9 lowering by evolocumab were similar in the normal renal function and renally impaired groups, indicating that target‐mediated clearance of evolocumab is not affected by impaired renal function. To the best of our knowledge, the absorption of monoclonal antibodies is not known to be affected by RI, and furthermore, other studies have shown that the PK of IgG monoclonal antibodies is unaffected by RI.14, 15
In this study, evolocumab effectively lowered LDL‐C levels in patients with severe RI or ESRD receiving hemodialysis; the magnitude and timing of LDL‐C lowering were consistent with those reported recently in a hepatic impairment study16 and in other evolocumab clinical trials.3, 17, 18, 19 The safety results of evolocumab in patients with severe RI and ESRD receiving hemodialysis were similar to those with normal renal function. No patients tested positive for antievolocumab antibodies, and no trends indicative of clinically important effects on laboratory parameters were observed. In addition, no AE was determined by the investigator to be related to evolocumab treatment.
Conclusions
After a single 140‐mg subcutaneous dose, there were no meaningful differences in evolocumab exposure, as assessed by Cmax and AUClast. The PD, including LDL‐C‐lowering effects, and safety results of evolocumab in patients with severe RI and ESRD receiving hemodialysis were similar to patients with normal renal function. These results support the use of evolocumab in patients who have severe RI or ESRD receiving hemodialysis, and no dose adjustment is warranted in these patients.
Acknowledgments
The authors thank Mahta Nili, PhD, formerly of Amgen, for editorial support and Michael Tracy, PhD, on behalf of Amgen, for statistical support.
Declaration of Conflicting Interests
Dr. Block was the principal investigator of this Amgen‐sponsored study and received study‐related payments. Dr. Lee and Dr. Wasserman are employees of and stockholders in Amgen. Dr. Gibbs, Dr. Emery, Ms. Hamilton, Dr. Kasichayanula, Mr. Hanafin, Dr. Somaratne, and Dr. Egbuna were employees of and stockholders in Amgen at the time this work was completed.
Funding
The study was funded by Amgen Inc.
Author Contributions
E.L., L.H., S.K., and P.H. wrote and edited the article. J.P.G., S.M.W., G.B., and L.H. performed data analysis. E.L., J.P.G., S.M.W., G.B., M.G.E., L.H., R.S., and O.E. designed the research. All authors read and approved the final version of the article.
References
- 1. Davidson MH. Emerging low‐density lipoprotein therapies: Targeting PCSK9 for low‐density lipoprotein reduction. J Clin Lipidol. 2013;7(3 suppl):S11–S15. [DOI] [PubMed] [Google Scholar]
- 2. Joseph L, Robinson JG. Proprotein convertase subtilisin/kexin type 9 (PCSK9) inhibition and the future of lipid lowering therapy. Prog Cardiovasc Dis. 2015;58(1):19–31. [DOI] [PubMed] [Google Scholar]
- 3. Giugliano RP, Desai NR, Kohli P, et al. Efficacy, safety, and tolerability of a monoclonal antibody to proprotein convertase subtilisin/kexin type 9 in combination with a statin in patients with hypercholesterolaemia (LAPLACE‐TIMI 57): a randomised, placebo‐controlled, dose‐ranging, phase 2 study. Lancet. 2012;380(9858):2007–2017. [DOI] [PMC free article] [PubMed] [Google Scholar]
- 4. Gibbs JP, Doshi S, Kuchimanchi M, et al. Impact of target‐mediated elimination on the dose and regimen of evolocumab, a human monoclonal antibody against proprotein convertase subtilisin/kexin type 9 (PCSK9). J Clin Pharmacol. 2017;57(5):616–626. [DOI] [PMC free article] [PubMed] [Google Scholar]
- 5. Stein E WS, Dias C, Scott R, Raal F. AMG145. Drug Future. 2013;38:451–459. [Google Scholar]
- 6. Food and Drug Administration . Guidance for industry: Pharmacokinetics in patients with impaired renal function – study design, data analysis, and impact on dosing and labeling. 2010. https://www.fda.gov/downloads/Drugs/Guidances/UCM204959.pdf. Accessed March 11, 2017.
- 7. Levey AS, Coresh J, Greene T, et al. Using standardized serum creatinine values in the modification of diet in renal disease study equation for estimating glomerular filtration rate. Ann Intern Med. 2006;145(4):247–254. [DOI] [PubMed] [Google Scholar]
- 8. Botev R, Mallie JP, Couchoud C, et al. Estimating glomerular filtration rate: Cockcroft‐Gault and Modification of Diet in Renal Disease formulas compared to renal inulin clearance. Clin J Am Soc Nephrol. 2009;4(5):899–906. [DOI] [PMC free article] [PubMed] [Google Scholar]
- 9. Gibbs JP, Slatter JG, Egbuna O, et al. Evaluation of evolocumab (AMG 145), a fully human anti‐PCSK9 IgG2 monoclonal antibody, in subjects with hepatic impairment. J Clin Pharmacol. 2017;57(4):513–523. [DOI] [PMC free article] [PubMed] [Google Scholar]
- 10. Colbert A, Umble‐Romero A, Prokop S, Xu R, Gibbs J, Pederson S. Characterization of a quantitative method to measure free proprotein convertase subtilisin/kexin type 9 in human serum. MAbs. 2014;6(4):1103–1113. [DOI] [PMC free article] [PubMed] [Google Scholar]
- 11. Bewick V, Cheek L, Ball J. Statistics review 10: further nonparametric methods. Crit Care. 2004;8(3):196–199. [DOI] [PMC free article] [PubMed] [Google Scholar]
- 12. Lote C. Principles of Renal Physiology. 4th ed Boston, MA: Kluwer Academic Publishers; 2000. [Google Scholar]
- 13. Dirks NL, Meibohm B. Population pharmacokinetics of therapeutic monoclonal antibodies. Clin Pharmacokinet. 2010;49(10):633–659. [DOI] [PubMed] [Google Scholar]
- 14. Smyth B, Jones C, Saunders J. Prescribing for patients on dialysis. Aust Prescr. 2016;39(1):21–24. [DOI] [PMC free article] [PubMed] [Google Scholar]
- 15. Zhao L, Ren TH, Wang DD. Clinical pharmacology considerations in biologics development. Acta Pharmacol Sin. 2012;33(11):1339–1347. [DOI] [PMC free article] [PubMed] [Google Scholar]
- 16. Gibbs JP, Slatter JG, Egbuna O, et al. Evaluation of evolocumab (AMG 145), a fully human anti‐PCSK9 IgG2 monoclonal antibody, in subjects with hepatic impairment. J Clin Pharmacol. 2017;57(4):513–523. 10.1002/jcph.832. [DOI] [PMC free article] [PubMed] [Google Scholar]
- 17. Blom DJ, Hala T, Bolognese M, et al. A 52‐week placebo‐controlled trial of evolocumab in hyperlipidemia. N Engl J Med. 2014;370(19):1809–1819. [DOI] [PubMed] [Google Scholar]
- 18. Koren MJ, Lundqvist P, Bolognese M, et al. Anti‐PCSK9 monotherapy for hypercholesterolemia: the MENDEL‐2 randomized, controlled phase III clinical trial of evolocumab. J Am Coll Cardiol. 2014;63(23):2531–2540. [DOI] [PubMed] [Google Scholar]
- 19. Robinson JG, Nedergaard BS, Rogers WJ, et al. Effect of evolocumab or ezetimibe added to moderate‐ or high‐intensity statin therapy on LDL‐C lowering in patients with hypercholesterolemia: the LAPLACE‐2 randomized clinical trial. JAMA. 2014;311(18):1870–1882. [DOI] [PubMed] [Google Scholar]


