

Abstract
Aims
To quantify changes in (i) potency (concentration of Δ9‐tetrahydrocannabinol; %THC), (ii) price (euros/g of cannabis) and (iii) value (mg THC/euro) of cannabis resin and herbal cannabis in Europe.
Design
Repeated cross‐sectional study.
Setting and participants
Data collected from 28 European Union (EU) member states, Norway and Turkey by the European Monitoring Centre for Drugs and Drug Addiction.
Measurements
Outcome variables were potency, price and value for cannabis resin and herbal cannabis in Europe, 2006–16. Inflation was estimated using the Harmonised Indices of Consumer Prices. Mixed‐effects linear regression models were used to estimate linear and quadratic time trends, with a random intercept and slope fitted to account for variation across countries.
Findings
Resin potency increased from a mean [95% confidence interval (CI)] of 8.14% THC (6.89, 9.49) in 2006 to 17.22 (15.23, 19.25) in 2016. Resin price increased from 8.21 euros/g (7.54, 8.97) to 12.27 (10.62, 14.16). Resin increased in value, from 11.00 mg THC per euro (8.60, 13.62) to 16.39 (13.68, 19.05). Quadratic time trends for resin potency and value indicated minimal change from 2006 to 2011, followed by marked increases from 2011 to 2016. Herbal cannabis potency increased from 5.00% THC (3.91, 6.23) to 10.22 (9.01, 11.47). Herbal price increased from 7.36 euros/g (6.22, 8.53) to 12.22 (10.59, 14.03). The value of herbal cannabis did not change from 12.65 mg of THC per euro (10.18, 15.34) to 12.72 (10.73, 14.73). All price trends persisted after adjusting for inflation.
Conclusions
European cannabis resin and herbal cannabis increased in potency and price from 2006 to 2016. Cannabis resin (but not herbal cannabis) increased in the quantity of Δ9‐tetrahydrocannabinol per euro spent. Marked increases in resin potency and value from 2011 to 2016 are consistent with the emergence of new resin production techniques in European and neighbouring drug markets.
Keywords: Cannabis, drug markets, herbal, potency, price, resin, THC
Introduction
Cannabis is used by an estimated 192 million people each year world‐wide in a variety of drug markets, ranging from heavily sanctioned prohibition to commercialized legal sale 1. A key component of cannabis markets is drug potency—typically quantified as the concentration of Δ9‐tetrahydrocannabinol (THC) in cannabis products. Several lines of evidence suggest that products with higher THC concentrations carry a greater risk of harm. First, several 2, 3, 4, 5, 6 (but not all 7) observational studies have found associations between the potency of cannabis products and problems related to addiction and mental health. Secondly, naturalistic studies indicate that cannabis users only partially adapt their smoking behaviour to variation in potency, resulting in higher doses of THC when using more potent products 8, 9. Thirdly, experimental studies show dose‐dependent effects of THC on cognitive impairment, anxiety, psychotic‐like symptoms and addiction, with higher doses causing greater harm 10. There are only a limited number of published studies to date investigating the potency of cannabis products in international drug markets. Quantifying cannabis potency is therefore a key step towards improving our understanding of the health effects of cannabis 11 and may inform policy decisions for harm minimization, such as taxation or upper limits on THC concentrations 12, 13.
An important feature of European cannabis markets is the presence of resin (also referred to as hashish or hash): compressed blocks of extracted plant matter that are typically brown in colour. Arguably, the most important changes in European cannabis products in recent years have occurred in cannabis resin. Resin is primarily imported to Europe from Morocco; however, it is also imported from Lebanon and Afghanistan and produced domestically within Europe 14. Resin found in European markets has been reported to contain significant levels of cannabidiol (CBD), a non‐intoxicating cannabinoid that may offset THC harms 15, 16, 17, and is typically absent from herbal cannabis. Traditional resin production methods often include a mixture of three plant chemotypes (THC‐dominant, CBD‐dominant, THC and CBD) found in landrace crops 18, such as Moroccan ‘kif’. As THC and CBD are synthesized from a common precursor, the mixture of chemotypes used in traditional resin production methods can result in modest levels of THC, with balanced (roughly equal) levels of CBD. By contrast, THC‐dominant plants can produce higher levels of THC with little or no CBD 19 and are often used to cultivate herbal cannabis, higher‐potency forms of resin and concentrated extracts 20.
Recent data suggest that Moroccan resin production has shifted away from traditional landrace ‘kif’ crops to THC‐dominant strains, resulting in marked increases in THC concentrations 21, 22. The effects of these changes appear to be evident in the French cannabis market, as documented by a 25‐year study of police seizures 23. The authors reported a substantial increase in resin potency starting in 2011, driven by the emergence of a new type of resin exceeding 20% THC. Increases in THC concentrations were also detected in resin samples collected from police seizures in the United Kingdom from 2004–05 18 to 2015–16 24 and in Italy from 2010 to 2013 25, 26. By contrast, THC concentrations in imported resin samples purchased from coffee shops in the Netherlands were largely stable in potency, from 2005 to 2015 27. However, the extent to which new higher‐potency resin samples have penetrated cannabis markets at the European level is currently unknown.
Regarding herbal cannabis in Europe, a small number of country‐specific studies have reported changes in potency. In the Netherlands, domestic herbal cannabis showed a marked increase in THC from 2000 to 2004 28, followed by a marginal decrease from 2005 to 2015 27. In the United Kingdom, the potency of herbal cannabis was broadly similar in 2004–05 18 compared to 2015–16 24, but increased each year from 2010 to 2013 25, 26 in Italy and from 1992 to 2016 in France 23. A meta‐analysis of herbal cannabis potency world‐wide reported annual increases (mean = 0.21% THC per year) from 1970 to 2009 29. However, the extent to which European herbal cannabis potency has changed in recent years is currently unclear.
Price is another key aspect of cannabis markets, and has been found to be positively correlated with potency, both in illicit 28, 30 and legal markets 31, 32. Data collected since the advent of legal sales in Washington State indicate that the retail price of cannabis has continued to fall over time 31, 32. As changes in both potency and price may influence purchasing behaviour and consumption 33, 34, 35, combined measures may be informative; one such measure is the quantity of THC that can be purchased with a fixed unit of price (e.g. 1 euro). This offers a measure of value that can be compared across time or different cannabis products. However, information on the price of cannabis products in Europe is extremely limited at present.
At the time of writing, legal markets for recreational cannabis are yet to emerge in Europe, but global cannabis policy is rapidly shifting towards legalization of recreational and medical cannabis. It is therefore timely to provide European estimates of the potency and price of cannabis products, to contribute to the available knowledge on international cannabis markets and how they respond to policy changes. Data on cannabis potency and price are collected by the European Monitoring Centre for Drugs and Drug Addiction (EMCDDA) on an annual basis from the 28 EU member states, Norway and Turkey. The objective of these tools is to collect accurate, reliable, comparable and high‐quality data on European drug markets. Using these data, we aimed to quantify for the first time changes in (i) potency, (ii) price and (iii) value of cannabis resin and herbal cannabis in Europe from 2006 to 2016.
Methods
Design
This repeated cross‐sectional study was reported according to the ‘strengthening the reporting of observational studies in epidemiology’ (STROBE) statement 36 and the revised checklist for writing research reports in Addiction 37.
Measures
Data were collected each year from 2006 to 2016 by the European Monitoring Centre for Drugs and Drug Addiction (EMCDDA) via its network of 30 national focal points across the 28 European Union (EU) Member States, Norway and Turkey. Standardized reporting tools were used to harmonize data reporting across countries. For cannabis products, data were requested separately for (i) cannabis resin, (ii) herbal cannabis (unspecified herbal cannabis), (iii) herbal cannabis (sinsemilla) and (iv) other herbal cannabis (European or non‐European seeded herbal cannabis). Data were collected for potency (laboratory test results for the concentration of THC to the nearest 0.1%) and price (at the retail level (≤ 100 g) in euros, converted from local currency using the exchange rate for the time‐period specified). Additional information on study methodology, sampling strategy and geographical coverage was requested where available, in line with an improved data collection regime for drug supply indicators 38, 39. Cannabis potency data were predominantly collected through analysis of police seizures at the national level (see Supporting information, Table S1 for country‐specific information). Price data were predominantly obtained by police surveys at the national level (see Supporting information, Table S2 for country‐specific information).
From 2006 to 2016, outcome measure data were extracted for cannabis potency (mean THC concentration, %) and price (mean euro) at the retail level separately for each cannabis product (resin, herbal), year and country. All data meeting these criteria were included. Where countries provided data for both potency and price within a single year, a measure of value was calculated. For this measure we chose the quantity of THC per price unit (mg THC/euro), as these data were normally distributed (skewness: mean Z‐score = 0.71, P = 0.475, kurtosis: mean Z‐score = 0.02, P = 0.981). Data from an alternative measure (euros/mg THC) were not used due to strong evidence of positive skew (mean Z‐score = 3.24, P = 0.001) and platykurtosis (mean Z‐score = 3.88, P < 0.001). The number of countries providing eligible data for each year and category are shown in Table 1. Where two estimates were available from a single year and country (e.g. potency estimates from both sinsemilla and other herbal cannabis; price estimates from both drug users and police), both estimates were included in the statistical models.
Table 1.
European coverage of cannabis potency, price and value data. Data show the number of European countries providing eligible data each within each category and year (Countries) and the median sample size for each estimate of potency or price (Sample).
| Resin potency | Herbal potency | Resin price | Herbal price | Resin value | Herbal value | |||||
|---|---|---|---|---|---|---|---|---|---|---|
| Countries | Sample | Countries | Sample | Countries | Sample | Countries | Sample | Countries | Countries | |
| 2006 | 15 | 30 | 15 | 58 | 13 | 47 | 13 | 50 | 9 | 12 |
| 2007 | 13 | 32 | 16 | 81 | 12 | 46 | 14 | 45 | 7 | 10 |
| 2008 | 18 | 35 | 19 | 100 | 15 | 56 | 15 | 58 | 10 | 14 |
| 2009 | 18 | 75 | 20 | 119 | 15 | 47 | 14 | 83 | 12 | 13 |
| 2010 | 19 | 43 | 21 | 207 | 15 | 36 | 15 | 54 | 12 | 14 |
| 2011 | 19 | 57 | 21 | 254 | 14 | 31 | 14 | 48 | 12 | 14 |
| 2012 | 18 | 38 | 20 | 249 | 17 | 46 | 16 | 39 | 13 | 16 |
| 2013 | 18 | 40 | 20 | 320 | 15 | 31 | 17 | 61 | 13 | 16 |
| 2014 | 17 | 36 | 20 | 357 | 14 | 41 | 17 | 66 | 10 | 15 |
| 2015 | 16 | 42 | 20 | 342 | 15 | 46 | 17 | 67 | 10 | 14 |
| 2016 | 15 | 42 | 19 | 329 | 19 | 43 | 19 | 65 | 12 | 15 |
For ease of interpretation, all observed price data shown in the text, tables and figures were presented as mean [± 95% confidence interval (CI)] observed values unadjusted for inflation. For example, price data labelled as 2006 reflect the price in 2006 euros; price data labelled as 2007 reflect the price in 2007 euros, etc. In order to account for price inflation, Harmonised Indices of Consumer Prices data were obtained from Eurostat for the 28 EU Member States, Norway and Turkey. These data were used to calculate expected changes based on annual inflation from 2006. These expected data were presented alongside the observed (unadjusted) data in the figures to illustrate both of these trends visually. In order to adjust for inflation in statistical models, we calculated adjusted outcome variables in which the expected data (based on inflation) were subtracted from the observed (unadjusted) data. These data were used to statistically test whether time trends persisted after adjusting for inflation, but are not presented in the text, tables and figures.
Statistical analysis
Mixed‐effects linear regression models (Stata command: mixed) with maximum likelihood estimation were used to quantify changes in cannabis potency, price and value from 2006 to 2016. This approach was chosen to account for data structure (data were collected within countries) and for improved handling of missing data compared to general linear model approaches. Year (coded as 0–10 for years 2006–16) was fitted as a fixed effect (linear trend) predicting the dependent variable of interest. Next, a quadratic trend of Year was added as a fixed effect. If the quadratic trend improved model fit it was retained in the model. Next, Country was included as a random intercept and slope using an independent covariance structure. In each of the analyses, adding Country improved the model fit and was therefore retained in all models. Model fit was assessed by change in Bayesian Information Criterion (∆BIC; 0–2 = weak evidence, 2–6 = positive evidence, 6–10 = strong evidence, > 10 = very strong evidence) as recommended by Raftery 40 and/or a χ2 likelihood ratio test (P < 0.05). Further information on the model fitting process is provided in the Supporting information. Parameter estimates are presented as unstandardized regression coefficients (β). All data presented in the text, tables and figures are from the final statistical models, in which 95% CIs were estimated using robust methods (10 000 bootstrapping samples; bias‐corrected and accelerated CIs).
Results
Changes in potency
Estimates of resin potency in Europe are shown in Fig. 1a and Table 2. Resin potency increased from a mean (95% CI) of 8.14% THC (6.89, 9.49) in 2006 to 17.22% THC (15.23, 19.25) in 2016. There was evidence for a quadratic trend of Year (β = 0.11, 95% CI = 0.06, 0.16, Z = 4.01, P < 0.001). This quadratic trend reflected relatively stable THC concentrations from 2006 to 2011 (increases of < 1% per year) followed by larger increases from 2011 to 2016. There was no evidence for a linear trend of Year. Country‐specific parameter estimates are shown in the Supporting information (Fig. S1).
Figure 1.
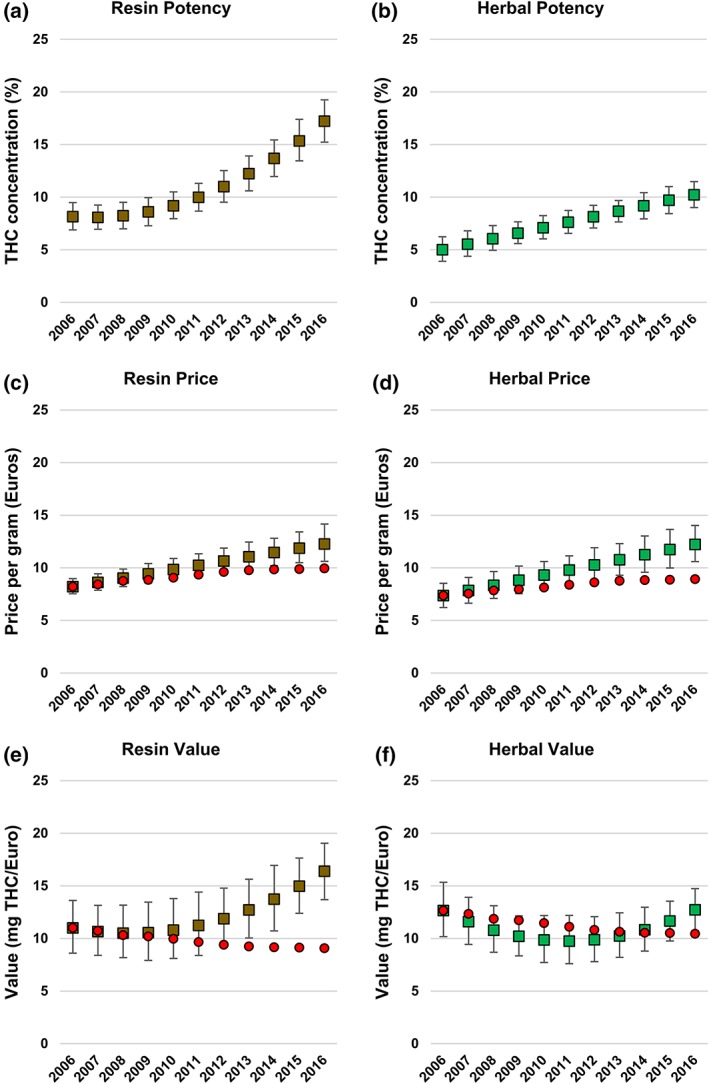
Changes in cannabis potency, price and value in Europe by year, 2006–16. Data shown are mean [± 95% confidence intervals (CIs)] observed values and are unadjusted for inflation. Red circles show expected price changes based on inflation alone. (a) Potency of cannabis resin, (b) potency of herbal cannabis, (c) price per gram of cannabis resin, (d) price per gram of herbal cannabis, (e) value of cannabis resin, (f) value of herbal cannabis. [Colour figure can be viewed at wileyonlinelibrary.com]
Table 2.
Potency of cannabis resin and herbal cannabis in Europe, 2006–16. Data show mean [± 95% confidence intervals (CIs)] concentrations of Δ9‐tetrahydrocannabinol (THC) (%).
| Cannabis resin | Herbal cannabis | |||
|---|---|---|---|---|
| Mean | (95% CI) | Mean | (95% CI) | |
| 2006 | 8.14 | (6.89, 9.49) | 5.00 | (3.91, 6.23) |
| 2007 | 8.08 | (6.95, 9.25) | 5.52 | (4.38, 6.80) |
| 2008 | 8.23 | (6.98, 9.51) | 6.05 | (4.95, 7.30) |
| 2009 | 8.60 | (7.28, 9.95) | 6.57 | (5.58, 7.65) |
| 2010 | 9.18 | (7.96, 10.49) | 7.09 | (6.03, 8.24) |
| 2011 | 9.98 | (8.67, 11.31) | 7.61 | (6.56, 8.74) |
| 2012 | 11.00 | (9.52, 12.53) | 8.13 | (7.07, 9.23) |
| 2013 | 12.23 | (10.59, 13.92) | 8.66 | (7.65, 9.68) |
| 2014 | 13.68 | (11.96, 15.44) | 9.18 | (7.93, 10.43) |
| 2015 | 15.34 | (13.45, 17.40) | 9.70 | (8.43, 11.01) |
| 2016 | 17.22 | (15.23, 19.25) | 10.22 | (9.01, 11.47) |
Estimates of herbal cannabis potency in Europe are shown in Fig. 1b and Table 2. Herbal cannabis potency increased from 5.00% THC (3.91, 6.23) in 2006 to 10.22% THC (9.01, 11.47) in 2016. There was evidence for a linear trend of Year, reflecting an increase in potency over time (β = 0.52, 95% CI = 0.43, 0.61, Z = 11.51, Z < 0.001). There was no evidence for a quadratic trend of year. Country‐specific parameter estimates are shown in the Supporting information, Fig. S2.
Changes in price
Estimates of cannabis resin price in Europe are shown in Fig. 1c and Table 3. Resin price increased from 8.21 (7.54, 8.97) euros per gram in 2006 to 12.27 (10.62, 14.16) in 2016. There was evidence for a linear trend of Year, reflecting an increase in price over time (β = 0.41, 95% CI = 0.23, 0.58, Z = 4.55, P < 0.001). There was no evidence for a quadratic trend of Year. Country‐specific parameter estimates are shown in the Supporting information, Fig. S3. This linear trend of Year persisted after adjusting for inflation (β = 0.23, 95% CI = 0.06, 0.40, Z = 2.59, P = 0.010). There was no evidence for a quadratic trend of Year.
Table 3.
Price of cannabis resin and herbal cannabis in Europe, 2006–16. Data show mean [± 95% confidence intervals (CIs)] euros/g of cannabis.
| Cannabis resin | Herbal cannabis | |||
|---|---|---|---|---|
| Mean | (95% CI) | Mean | (95% CI) | |
| 2006 | 8.21 | (7.54, 8.97) | 7.36 | (6.22, 8.53) |
| 2007 | 8.61 | (7.86, 9.44) | 7.85 | (6.64, 9.09) |
| 2008 | 9.02 | (8.21, 9.89) | 8.33 | (7.09, 9.65) |
| 2009 | 9.43 | (8.54, 10.41) | 8.82 | (7.55, 10.17) |
| 2010 | 9.83 | (8.87, 10.88) | 9.30 | (8.10, 10.60) |
| 2011 | 10.24 | (9.23, 11.34) | 9.79 | (8.48, 11.14) |
| 2012 | 10.64 | (9.52, 11.87) | 10.28 | (8.76, 11.91) |
| 2013 | 11.05 | (9.80, 12.45) | 10.76 | (9.30, 12.31) |
| 2014 | 11.45 | (10.21, 12.80) | 11.25 | (9.58, 13.03) |
| 2015 | 11.86 | (10.48, 13.41) | 11.73 | (9.98, 13.65) |
| 2016 | 12.27 | (10.62, 14.16) | 12.22 | (10.59, 14.03) |
Estimates of herbal cannabis price in Europe are shown in Fig. 1d and Table 3). Herbal price increased from 7.36 (6.22, 8.53) euros per gram in 2006 to 12.22 (10.59, 14.03) in 2016. There was evidence for a linear trend of Year, reflecting an increase in price over time (β = 0.49, 95% CI = 0.35, 0.62, Z = 6.99, P < 0.001). There was no evidence for a quadratic trend of Year. Country‐specific parameter estimates are shown in the Supporting information, Fig. S4. This linear trend of Year persisted after adjusting for inflation (β = 0.32, 95% CI = 0.18, 0.46, Z = 4.60, P < 0.001). There was no evidence for a quadratic trend of Year.
Changes in value
Estimates of value for cannabis resin are shown in Fig. 1e and Table 4. The quantity of THC (mg) for every euro spent increased from 11.00 (8.60, 13.62) in 2006 to 16.39 (13.68, 19.05) in 2016. There was evidence for a quadratic trend of Year (β = 0.10, 95% CI = 0.03, 0.17, Z = 2.68, P = 0.007) but not a linear trend of Year. This quadratic trend reflected relatively stable value for money from 2006 to 2011 (increases of < 0.5 mg THC/euro each year), followed by larger increases in value from 2011 to 2016. Country‐specific parameter estimates are shown in the Supporting information, Fig. S5. This quadratic trend of Year persisted after adjusting for inflation (β = 0.08, 95% CI = 0.01, 0.15, Z = 2.25, P = 0.025). There was no evidence for a linear trend of Year.
Table 4.
Value of cannabis resin and herbal cannabis in Europe, 2006–16. Data show mean [± 95% confidence intervals (CIs)] mg of Δ9‐tetrahydrocannabinol (THC) for each euro spent.
| Cannabis resin | Herbal cannabis | |||
|---|---|---|---|---|
| Mean | (95% CI) | Mean | (95% CI) | |
| 2006 | 11.00 | (8.60, 13.62) | 12.65 | (10.18, 15.34) |
| 2007 | 10.65 | (8.40, 13.15) | 11.60 | (9.44, 13.91) |
| 2008 | 10.50 | (8.17, 13.17) | 10.79 | (8.69, 13.10) |
| 2009 | 10.55 | (7.92, 13.46) | 10.21 | (8.35, 12.15) |
| 2010 | 10.80 | (8.11, 13.80) | 9.86 | (7.72, 12.18) |
| 2011 | 11.24 | (8.39, 14.41) | 9.75 | (7.60, 12.19) |
| 2012 | 11.87 | (9.29, 14.79) | 9.87 | (7.80, 12.08) |
| 2013 | 12.71 | (10.04, 15.64) | 10.23 | (8.21, 12.44) |
| 2014 | 13.74 | (10.72, 16.94) | 10.83 | (8.80, 12.97) |
| 2015 | 14.96 | (12.39, 17.64) | 11.65 | (9.77, 13.54) |
| 2016 | 16.39 | (13.68, 19.05) | 12.72 | (10.73, 14.73) |
Estimates of value for herbal cannabis are shown in Fig. 1f and Table 4. The quantity of THC (mg) for every euro spent was similar in 2006 at 12.65 (10.18, 15.34) and in 2016 at 12.72 (10.73, 14.73). There was evidence for a linear trend of Year (β = −1.17, 95% CI = –1.97, −0.36, Z = −2.83, P = 0.005) and a quadratic trend of Year (β = 0.12, 95% CI = 0.05, 0.19, Z = 3.18, P < 0.001). These trends reflected an initial decrease in value, followed by a return to the same level. Country‐specific parameter estimates are shown in the Supporting information, Fig. S6. After adjusting for inflation, there was evidence for a quadratic trend of Year (β = 0.10, 95% CI = 0.03, 0.17, Z = 2.66, P = 0.008) but not a linear trend of Year (β = −0.75, 95% CI = –1.57, 0.06, Z = −1.81, P = 0.070).
Discussion
Here we report previously unpublished data from the EMCDDA, quantifying changes in the potency, price and value of cannabis resin and herbal cannabis in Europe. We found clear evidence for increases in the potency of both cannabis products in Europe from 2006 to 2016. This rise was more substantial for cannabis resin than herbal cannabis. The price of cannabis resin and herbal cannabis also increased during this time, and these trends persisted after adjusting for inflation. Combined data on price and potency showed an increase in the value of cannabis resin but not herbal cannabis from 2006 to 2016.
A noteworthy finding of this study is the marked increase in the potency of cannabis resin from 2006 to 2016. This increase was especially pronounced from 2011 to 2016, during which resin potency increased from approximately 10.0% THC to 17.2% THC. The time–course of these changes is strikingly similar to those recently reported in France 23, with a marked increase starting from 2011. Although French data contributed to our estimates at the European level, our data show that high‐potency resin (often exceeding 20% THC) has penetrated European markets more widely, including regions of central Europe and Scandinavia. The replacement of traditional landrace ‘kif’ cannabis plants with new high‐potency strains in Morocco provides a convincing explanation for these changes 21, 22. However, local (European) resin production using high‐potency strains may have also contributed to the emergence of higher‐potency resin products in European drug markets 14.
The linear increases in herbal cannabis potency we report here are consistent with previous data collected world‐wide 29. Studies in the United States 41 and France 23 have attributed increases in the potency of herbal cannabis to a rise in the availability of high‐potency indoor‐grown forms of herbal cannabis, often called sinsemilla or nederwiet. This offers one possible explanation for the increase in herbal cannabis potency observed in Europe. Another plausible reason is an increase in potency within the same type(s) of cannabis, which has previously been reported in the Netherlands 28. One strength of our reporting tool was its ability to capture data on multiple types of herbal cannabis. However, only three European countries (the Netherlands, Sweden, Croatia) provided eligible data on more than one type of herbal cannabis, and for this reason we did not stratify our analysis by type of herbal cannabis. The estimates we obtained for herbal cannabis potency in Europe lie between previous estimates of high‐potency indoor‐grown herbal cannabis and imported herbal cannabis in European countries 27, 42. They are also very similar to estimates of all forms of herbal cannabis from the United States during the same time‐period, when the proportion of sinsemilla samples increased 41. This suggests that increases in the market share of high‐potency indoor‐grown forms of cannabis may be the most probable explanation for the linear trends in herbal cannabis potency we observed in Europe. They also highlight that this increase is an international phenomenon that is unlikely to be attributable to local (European) factors alone.
The increase in potency of European cannabis resin and herbal cannabis could potentially result in these products carrying greater health risks. THC has been positively associated with harms in several studies using a range of experimental and observational research methods 2, 3, 4, 5, 6, 10. Rising THC in cannabis may have contributed to the marked increase in treatment for cannabis disorders 6 that has been evident across Europe and now accounts for more first‐time admissions to specialist treatment than any other illicit drug 43.
Although THC is the primary cannabis constituent responsible for its harmful effects, CBD may offset some of these harms 15, 16, 17. For example, some (but not all 44) studies have reported that the acute effects of THC on verbal memory impairment 45, 46 and psychotic‐like symptoms 46, 47 were partially offset when CBD was co‐administered with THC. An important limitation of the current study is that data on CBD were not collected. Analyses of cannabis resin seizures in both France and Denmark indicated that CBD concentrations remained stable from 2006 to 2016 (~4% in France 23 and ~6% in Denmark 48), while THC increased markedly, following the same trend and time–course as we report here across Europe. On the basis of these data, it might be expected that CBD concentrations also remained relatively stable across Europe from 2006 to 2016, although further evidence would be needed to support or refute this. As a result of rising THC and stable CBD in France and Denmark, THC : CBD ratios rose in both countries 23, 48. Information on CBD and the THC : CBD ratio may provide important additional information on the harmful effects of cannabis, in addition to THC alone. However, while several studies have shown dose‐dependent effects of THC in humans (with higher doses causing greater harm 10), none have tested the effects of multiple THC : CBD ratios 15. Therefore, the relationship between THC : CBD ratio and level of harm is currently unclear, and THC concentrations should be taken as the single most important ‘primary outcome’ in studies of cannabis potency at present.
Cannabis price increased from 2006 to 2016, and these trends persisted after adjusting for inflation in consumer prices. These data offer a sharp contrast to those observed in Washington State, where prices have continued to drop since the advent of legal sales 31, 32. Experimental studies suggest that both price and potency may influence purchasing behaviour and consumption 33, 34, 35. As a result, combining information on price and potency may be informative. We found that for herbal cannabis, value for money (quantity of THC per euro spent) showed an initial decrease followed by a return to similar levels. This suggests that the value for money of herbal cannabis was comparable in 2006 (~12.7 mg THC per euro) and 2016 (~12.7 mg THC per euro). By contrast, the value of cannabis resin remained stable from 2006 (~11.0 mg THC per euro) to 2011 (~11.2 mg THC per euro) but then rose to ~16.4 mg THC per euro in 2016. It has been argued 22 that new resin production methods emerged in Morocco to compete with the domestic European market, including locally grown herbal cannabis. Our data support this argument by showing that cannabis resin increased in its relative value compared to herbal cannabis, potentially making it more attractive to consumers. It may be the case that new resin production methods in Morocco and elsewhere (e.g. using higher‐potency cannabis plants) are more economically efficient, and these savings can be passed on to European consumers.
This study has several strengths. It includes previously unpublished data on illicit drug markets that are largely hidden from scientific investigation. These data include recent European and country‐specific estimates covering 11 years, providing internationally relevant information for policy and practice. Moreover, it includes separate estimates for different cannabis products, which are very rarely distinguished from each other in research studies at present 49. However, this study also has some limitations. First, the use of police seizures for obtaining cannabis products and police surveys for estimating price may result in sampling bias when estimating drug use at the retail level. However, this is a limitation common to almost all monitoring data on drug markets (apart from in the Netherlands 27, 28). As data on retail prices included transactions ≤ 100 g, they may have underestimated the price of cannabis at lower ends of the retail market. However, we have no reason to believe that sampling bias or size of retail transaction varied systematically by time, and therefore it is unlikely that these contributed to the trends reported here. Secondly, we were unable to verify data collection methods across countries. However, data collection was harmonized using standardized tools to collect the most accurate, reliable, comparable and high‐quality data on European drug markets available. Thirdly, annual data for each cannabis product were not consistently available for each of the 28 European Member States, Norway and Turkey. However, the mixed‐effects modelling approach we used improves handling of missing data by making use of all available data without listwise deletion. Additionally, the inclusion of country as a random intercept and slope can increase the extent to which results are generalizable to other countries that were not sampled 50. Furthermore, we used bootstrapping to generate robust confidence intervals that are not constrained by sampling distribution assumptions. A final limitation is the absence of data on CBD.
In conclusion, this study provides evidence for increases in the potency and price of cannabis resin and herbal cannabis in Europe from 2006 to 2016. Cannabis resin showed a larger increase in potency when compared to herbal cannabis. It also increased in relative value, resulting in a higher quantity of THC for each Euro spent on cannabis. These data provide important new information on international drug markets at a time of rapid change in global cannabis policy and cannabis products.
Declaration of interests
No authors report any declarations of interest. This study was funded by a Senior Academic Fellowship from the Society for the Study of Addiction awarded to T.F. The funder had no role in the study design, data analysis, interpretation, writing of the report or the decision to submit for publication.
Supporting information
Table S1 Country‐specific information on coverage and sampling of cannabis potency data.
Table S2 Country‐specific information on coverage and sampling of cannabis price data.
Figure S1 Changes in resin potency in Europe by year, 2006–2016. Data show parameter estimates for the random intercept and slope of Country. THC concentrations in resin (%) showed a quadratic trend over time. This model accounts for variation across countries at baseline (random intercept) and the magnitude of change from 2006–2016 (random slope).
Figure S2 Changes in herbal potency in Europe by year, 2006–2016. Data show parameter estimates for the random intercept and slope of Country. THC concentrations in herbal cannabis (%) showed a linear trend over time. This model accounts for variation across countries at baseline (random intercept) and the magnitude of change from 2006–2016 (random slope).
Figure S3 Changes in resin price in Europe by year, 2006–2016. Data show parameter estimates for the random intercept and slope of Country. The data shown are not adjusted for inflation. The price of cannabis resin (Euros) showed a linear trend over time. This model accounts for variation across countries at baseline (random intercept) and the magnitude of change from 2006–2016 (random slope).
Figure S4 Changes in herbal price in Europe by year, 2006–2016. Data show parameter estimates for the random intercept and slope of Country. The data shown are not adjusted for inflation. The price of herbal cannabis (Euros) showed a linear trend over time. This model accounts for variation across countries at baseline (random intercept) and the magnitude of change from 2006–2016 (random slope).
Figure S5 Changes in value of cannabis resin in Europe by year, 2006–2016. Data show parameter estimates for the random intercept and slope of Country. The data shown are not adjusted for inflation. The price of cannabis resin (Euros) showed a quadratic trend over time. This model accounts for variation across countries at baseline (random intercept) and the magnitude of change from 2006–2016 (random slope).
Figure S6 Changes in value of herbal cannabis price in Europe by year, 2006–2016. Data show parameter estimates for the random intercept and slope of Country. The data shown are not adjusted for inflation. The price of herbal cannabis (Euros) showed a linear and quadratic trend over time. This model accounts for variation across countries at baseline (random intercept) and the magnitude of change from 2006–2016 (random slope).
Acknowledgements
We are grateful to the focal points of the 28 EU Member States, Norway and Turkey for providing their data to the EMCDDA.
Freeman, T. P. , Groshkova, T. , Cunningham, A. , Sedefov, R. , Griffiths, P. , and Lynskey, M. T. (2019) Increasing potency and price of cannabis in Europe, 2006–16. Addiction, 114: 1015–1023. 10.1111/add.14525.
References
- 1. United Nations Office on Drugs and Crime (UNODC) . World Drug Report 2018. Sales no. E18XI9. Herndon, VA, USA: United Nations Publications; 2018.
- 2. Di Forti M., Marconi A., Carra E., Fraietta S., Trotta A., Bonomo M. et al Proportion of patients in south London with first‐episode psychosis attributable to use of high potency cannabis: a case–control study. Lancet Psychiatry 2015; 2: 233–238. [DOI] [PubMed] [Google Scholar]
- 3. Freeman T., Winstock A. Examining the profile of high‐potency cannabis and its association with severity of cannabis dependence. Psychol Med 2015; 45: 3181–3189. [DOI] [PMC free article] [PubMed] [Google Scholar]
- 4. Chan G. C., Hall W., Freeman T. P., Ferris J., Kelly A. B., Winstock A. User characteristics and effect profile of Butane Hash Oil: an extremely high‐potency cannabis concentrate. Drug Alcohol Depend 2017; 178: 32–38. [DOI] [PubMed] [Google Scholar]
- 5. Meier M. H. Associations between butane hash oil use and cannabis‐related problems. Drug Alcohol Depend 2017; 179: 25–31. [DOI] [PubMed] [Google Scholar]
- 6. Freeman T. P., van der Pol P., Kuijpers W., Wisselink J., Das R. K., Rigter S. et al Changes in cannabis potency and first‐time admissions to drug treatment: a 16‐year study in the Netherlands. Psychol Med 2018; 48: 2346–2352. [DOI] [PubMed] [Google Scholar]
- 7. van der Pol P., Liebregts N., de Graaf R., Korf D. J., van den Brink W., van Laar M. Predicting the transition from frequent cannabis use to cannabis dependence: a three‐year prospective study. Drug Alcohol Depend 2013; 133: 352–359. [DOI] [PubMed] [Google Scholar]
- 8. Freeman T. P., Morgan C. J., Hindocha C., Schafer G., Das R. K., Curran H. V. Just say ‘know’: how do cannabinoid concentrations influence users’ estimates of cannabis potency and the amount they roll in joints? Addiction 2014; 109: 1686–1694. [DOI] [PubMed] [Google Scholar]
- 9. van der Pol P., Liebregts N., Brunt T., Amsterdam J., Graaf R., Korf D. J. et al Cross‐sectional and prospective relation of cannabis potency, dosing and smoking behaviour with cannabis dependence: an ecological study. Addiction 2014; 109: 1101–1109. [DOI] [PubMed] [Google Scholar]
- 10. Curran H. V., Freeman T. P., Mokrysz C., Lewis D. A., Morgan C. J., Parsons L. H. Keep off the grass? Cannabis, cognition and addiction. Nat Rev Neurosci 2016; 17: 293–306. [DOI] [PubMed] [Google Scholar]
- 11. Freeman T., Swift W. Cannabis potency: the need for global monitoring. Addiction 2016; 111: 376–377. [DOI] [PubMed] [Google Scholar]
- 12. van Laar M., van der Pol P., Niesink R. Limitations to the Dutch cannabis toleration policy: assumptions underlying the reclassification of cannabis above 15% THC. Int J Drug Policy 2016; 34: 58–64. [DOI] [PubMed] [Google Scholar]
- 13. Wilson J., Freeman T. P., Mackie C. J. Effects of increasing cannabis potency on adolescent health. Lancet Child Adolesc Health 2018; 10.1016/S2352-4642(18)30342-0. [DOI] [PubMed] [Google Scholar]
- 14. European Monitoring Centre for Drugs and Drug Addiction and Europol (EMCDDA) . EU Drug Markets Report: In‐Depth Analysis. Luxembourg: Publications Office of the European Union; 2016. [Google Scholar]
- 15. Englund A., Freeman T. P., Murray R. M., McGuire P. Can we make cannabis safer? Lancet Psychiatry 2017; 4: 643–648. [DOI] [PubMed] [Google Scholar]
- 16. Boggs D. L., Nguyen J. D., Morgenson D., Taffe M. A., Ranganathan M. Clinical and preclinical evidence for functional interactions of cannabidiol and δ9‐tetrahydrocannabinol. Neuropsychopharmacology 2018; 43: 142–154. [DOI] [PMC free article] [PubMed] [Google Scholar]
- 17. Colizzi M., Bhattacharyya S. Does cannabis composition matter? Differential effects of delta‐9‐tetrahydrocannabinol and cannabidiol on human cognition. Curr Addict Rep 2017; 4: 62–74. [DOI] [PMC free article] [PubMed] [Google Scholar]
- 18. Potter D. J., Clark P., Brown M. B. Potency of Δ9‐THC and other cannabinoids in cannabis in England in 2005: implications for psychoactivity and pharmacology. J Forensic Sci 2008; 53: 90–94. [DOI] [PubMed] [Google Scholar]
- 19. de Meijer E. P., Bagatta M., Carboni A., Crucitti P., Moliterni V. C., Ranalli P. et al The inheritance of chemical phenotype in Cannabis sativa L. Genetics 2003; 163: 335–346. [DOI] [PMC free article] [PubMed] [Google Scholar]
- 20. Raber J. C., Elzinga S., Kaplan C. Understanding dabs: contamination concerns of cannabis concentrates and cannabinoid transfer during the act of dabbing. J Toxicol Sci 2015; 40: 797–803. [DOI] [PubMed] [Google Scholar]
- 21. Stambouli H., El Bouri A., Bouayoun T. Évolution de la teneur en Δ9‐THC dans les saisies de résines de cannabis au Maroc de 2005 à 2014 [Trend of δ9‐THC content of cannabis resin seized in Morocco from 2005 to 2014]. Toxicol Anal Clin 2016; 28: 146–152. [Google Scholar]
- 22. Chouvy P.‐A., Afsahi K. Hashish revival in Morocco. Int J Drug Policy 2014; 25: 416–423. [DOI] [PubMed] [Google Scholar]
- 23. Dujourdy L., Besacier F. A study of cannabis potency in France over a 25 years period (1992–2016). Forensic Sci Int 2017; 272: 72–80. [DOI] [PubMed] [Google Scholar]
- 24. Potter D. J., Hammond K., Tuffnell S., Walker C., Di Forti M. Potency of Δ9‐tetrahydrocannabinol and other cannabinoids in cannabis in England in 2016: implications for public health and pharmacology. Drug Test Anal 2018; 10: 628–635. [DOI] [PubMed] [Google Scholar]
- 25. Zamengo L., Frison G., Bettin C., Sciarrone R. Variability of cannabis potency in the Venice area (Italy): a survey over the period 2010–2012. Drug Test Anal 2014; 6: 46–51. [DOI] [PubMed] [Google Scholar]
- 26. Zamengo L., Frison G., Bettin C., Sciarrone R. Cannabis potency in the Venice area (Italy): update 2013. Drug Test Anal 2015; 7: 255–258. [DOI] [PubMed] [Google Scholar]
- 27. Niesink R. J., Rigter S., Koeter M. W., Brunt T. M. Potency trends of Δ9‐tetrahydrocannabinol, cannabidiol and cannabinol in cannabis in the Netherlands: 2005–15. Addiction 2015; 110: 1941–1950. [DOI] [PubMed] [Google Scholar]
- 28. Pijlman F., Rigter S., Hoek J., Goldschmidt H., Niesink R. Strong increase in total delta‐THC in cannabis preparations sold in Dutch coffee shops. Addict Biol 2005; 10: 171–180. [DOI] [PubMed] [Google Scholar]
- 29. Cascini F., Aiello C., Di Tanna G. Increasing delta‐9‐tetrahydrocannabinol (Δ‐9‐THC) content in herbal cannabis over time: systematic review and meta‐analysis. Curr Drug Abuse Rev 2012; 5: 32–40. [DOI] [PubMed] [Google Scholar]
- 30. van der Pol P., Liebregts N., Graaf R., Korf D. J., Brink W., van Laar M. Validation of self‐reported cannabis dose and potency: an ecological study. Addiction 2013; 108: 1801–1808. [DOI] [PubMed] [Google Scholar]
- 31. Smart R., Caulkins J. P., Kilmer B., Davenport S., Midgette G. Variation in cannabis potency and prices in a newly‐legal market: evidence from 30 million cannabis sales in Washington State. Addiction 2017; 112: 2167–2177. [DOI] [PMC free article] [PubMed] [Google Scholar]
- 32. Caulkins J. P., Bao Y., Davenport S., Fahli I., Guo Y., Kinnard K. et al Big data on a big new market: insights from Washington State's legal cannabis market. Int J Drug Policy 2018; 57: 86–94. [DOI] [PMC free article] [PubMed] [Google Scholar]
- 33. Goudie A. J., Sumnall H. R., Field M., Clayton H., Cole J. C. The effects of price and perceived quality on the behavioural economics of alcohol, amphetamine, cannabis, cocaine, and ecstasy purchases. Drug Alcohol Depend 2007; 89: 107–115. [DOI] [PubMed] [Google Scholar]
- 34. Kelly T. H., Foltin R. W., Emurian C. S., Fischman M. W. Are choice and self‐administration of marijuana related to Δ–9‐THC content? Exp Clin Psychopharmacol 1997; 5: 74–82. [DOI] [PubMed] [Google Scholar]
- 35. Bedi G., Lindquist M. A., Haney M. An fMRI‐based neural signature of decisions to smoke cannabis. Neuropsychopharmacology 2015; 40: 2657–2665. [DOI] [PMC free article] [PubMed] [Google Scholar]
- 36. Von Elm E., Altman D. G., Egger M., Pocock S. J., Gøtzsche P. C., Vandenbroucke J. P. et al The Strengthening the Reporting of Observational Studies in Epidemiology (STROBE) statement: guidelines for reporting observational studies. Lancet 2007; 370: 1453–1457. [DOI] [PubMed] [Google Scholar]
- 37. West R., Marsden J., Humphreys K., Darke S. A revised checklist for writing up research reports. Addiction 2018; 113: 1567–1570. [DOI] [PubMed] [Google Scholar]
- 38. Singleton N., Cunningham A., Groshkova T., Royuela L., Sedefov R. Drug supply indicators: pitfalls and possibilities for improvements to assist comparative analysis. Int J Drug Policy 2018; 56: 131–136. [DOI] [PubMed] [Google Scholar]
- 39. EMCDDA . Developing drug supply monitoring in Europe: current concepts. Luxembourg: EMCDDA Papers, Publications Office of the European Union; 2017. [Google Scholar]
- 40. Raftery A. E. Bayesian model selection in social research. Sociol Methodol 1995; 25: 111–163. [Google Scholar]
- 41. ElSohly M. A., Mehmedic Z., Foster S., Gon C., Chandra S., Church J. C. Changes in cannabis potency over the last 2 decades (1995–2014): analysis of current data in the United States. Biol Psychiatry 2016; 79: 613–619. [DOI] [PMC free article] [PubMed] [Google Scholar]
- 42. Potter D. J., Hammond K., Tuffnell S., Walker C., Di Forti M. Potency of Δ9–tetrahydrocannabinol and other cannabinoids in cannabis in England in 2016: Implications for public health and pharmacology. Drug Test Anal 2018; 10: 628–635. [DOI] [PubMed] [Google Scholar]
- 43. European Monitoring Centre for Drugs and Drug Addiction (EMCDDA) . Treatment of Cannabis‐Related Disorders in Europe. Luxembourg: Publications Office of the European Union; 2015.
- 44. Morgan C. J., Freeman T. P., Hindocha C., Schafer G., Gardner C., Curran H. V. Individual and combined effects of acute delta‐9‐tetrahydrocannabinol and cannabidiol on psychotomimetic symptoms and memory function. Transl Psychiatry 2018; 8: 181. [DOI] [PMC free article] [PubMed] [Google Scholar]
- 45. Morgan C. J., Schafer G., Freeman T. P., Curran H. V. Impact of cannabidiol on the acute memory and psychotomimetic effects of smoked cannabis: naturalistic study. Br J Psychiatry 2010; 197: 285–290. [DOI] [PubMed] [Google Scholar]
- 46. Englund A., Morrison P. D., Nottage J., Hague D., Kane F., Bonaccorso S. et al Cannabidiol inhibits THC‐elicited paranoid symptoms and hippocampal‐dependent memory impairment. J Psychopharmacol 2013; 27: 19–27. [DOI] [PubMed] [Google Scholar]
- 47. Bhattacharyya S., Morrison P. D., Fusar‐Poli P., Martin‐Santos R., Borgwardt S., Winton‐Brown T. et al Opposite effects of Δ‐9‐tetrahydrocannabinol and cannabidiol on human brain function and psychopathology. Neuropsychopharmacology 2010; 35: 764–774. [DOI] [PMC free article] [PubMed] [Google Scholar]
- 48. Rømer Thompsen K., Lindholst C., Thylstrup B., Kvamme S., Englund A., Freeman T. P. et al Changes in the composition of cannabis from 2000‐2017 in Denmark: analysis of confiscated samples of cannabis resin. Exp Clin Psychopharmacol; in press. [DOI] [PubMed] [Google Scholar]
- 49. Rømer Thomsen K. R., Callesen M. B., Ewing S. W. F. Recommendation to reconsider examining cannabis subtypes together due to opposing effects on brain, cognition and behavior. Neurosci Biobehav Rev 2017; 80: 156–158. [DOI] [PMC free article] [PubMed] [Google Scholar]
- 50. Raudenbush S. W. Random effects models In: Cooper H., Hedges L. V., editors. The Handbook of Research Synthesis. New York: Russell Sage Foundation, pp. 301–321. [Google Scholar]
Associated Data
This section collects any data citations, data availability statements, or supplementary materials included in this article.
Supplementary Materials
Table S1 Country‐specific information on coverage and sampling of cannabis potency data.
Table S2 Country‐specific information on coverage and sampling of cannabis price data.
Figure S1 Changes in resin potency in Europe by year, 2006–2016. Data show parameter estimates for the random intercept and slope of Country. THC concentrations in resin (%) showed a quadratic trend over time. This model accounts for variation across countries at baseline (random intercept) and the magnitude of change from 2006–2016 (random slope).
Figure S2 Changes in herbal potency in Europe by year, 2006–2016. Data show parameter estimates for the random intercept and slope of Country. THC concentrations in herbal cannabis (%) showed a linear trend over time. This model accounts for variation across countries at baseline (random intercept) and the magnitude of change from 2006–2016 (random slope).
Figure S3 Changes in resin price in Europe by year, 2006–2016. Data show parameter estimates for the random intercept and slope of Country. The data shown are not adjusted for inflation. The price of cannabis resin (Euros) showed a linear trend over time. This model accounts for variation across countries at baseline (random intercept) and the magnitude of change from 2006–2016 (random slope).
Figure S4 Changes in herbal price in Europe by year, 2006–2016. Data show parameter estimates for the random intercept and slope of Country. The data shown are not adjusted for inflation. The price of herbal cannabis (Euros) showed a linear trend over time. This model accounts for variation across countries at baseline (random intercept) and the magnitude of change from 2006–2016 (random slope).
Figure S5 Changes in value of cannabis resin in Europe by year, 2006–2016. Data show parameter estimates for the random intercept and slope of Country. The data shown are not adjusted for inflation. The price of cannabis resin (Euros) showed a quadratic trend over time. This model accounts for variation across countries at baseline (random intercept) and the magnitude of change from 2006–2016 (random slope).
Figure S6 Changes in value of herbal cannabis price in Europe by year, 2006–2016. Data show parameter estimates for the random intercept and slope of Country. The data shown are not adjusted for inflation. The price of herbal cannabis (Euros) showed a linear and quadratic trend over time. This model accounts for variation across countries at baseline (random intercept) and the magnitude of change from 2006–2016 (random slope).