

Abstract
Objectives
While controlled thermal changes in subcutaneous tissue have been used to trigger apoptosis of fat cells and have been proven clinically efficacious, another mechanism of electromagnetic stress suggests that fat apoptosis could be achieved by a non‐thermal manner as well. This animal model study investigates the use of a non‐invasive high‐intensity magnetic field device to induce apoptosis in fat cells.
Methods
Yorkshire pigs (N = 2) received one treatment (30 minutes) in the abdominal area using a High‐Intensity Focused Electromagnetic (HIFEM) device. Punch biopsy samples of fat tissue and blood samples were collected at the baseline, 1 and 8 hours after the treatment. Biopsy samples were sectioned and evaluated for the levels of an apoptotic index (AI) by the TUNEL method. Statistical significance was examined using the rANOVA and Tukey's test (α 5%). Biopsy samples were also assessed for molecular biomarkers. Blood samples were evaluated to determine changes related to fat and muscle metabolism. Free fatty acids (FFA), triacylglycerol (TG), glycerol and glucose (Glu) were used as the main biomarkers of fat metabolism. Creatinine, creatinine kinase (CK), lactate dehydrogenase (LDH) and interleukin 6 (IL6) served as the main biomarkers to evaluate muscle metabolism.
Results
In treated pigs, a statistically significant increase in the apoptotic index (AI) (P = 1.17E‐4) was observed. A significant difference was found between AI at baseline (AI = 18.75%) and 8‐hours post‐treatment (AI = 35.95%). Serum levels of fat and muscle metabolism indicated trends (FFA −0.32 mmol · l−1, −28.1%; TG −0.24 mmol · l−1, −51.8%; Glycerol −5.68 mg · l−1, −54.8%; CK +67.58 μkat · l−1, +227.8%; LDH +4.9 μkat · l−1,+35.4%) suggesting that both adipose and muscle tissue were affected by HIFEM treatment. No adverse events were noted to skin and surrounding tissue.
Conclusions
Application of a high‐intensity electromagnetic field in a porcine model results in adipocyte apoptosis. The analysis of serum levels suggests that HIFEM treatment influences fat and muscle metabolism. Lasers Surg. Med. 51:47–53, 2019. © 2018 The Authors. Lasers in Surgery and Medicine Published by Wiley Periodicals, Inc.
Keywords: apoptosis, fat disruption, HIFEM, magnetic technology, non‐thermal
INTRODUCTION
High body dissatisfaction rates of up to 60.7% in males and 71.6% in females caused by sedentary lifestyle and unbalanced diet led to a rapid increase in demand for noninvasive fat reduction 1. The most common non‐invasive fat reduction procedures in aesthetic medicine are cryolipolysis, radiofrequency or thermal laser therapy 2 but none of these procedures deal with the underlying musculature, which highly contributes to the firm and toned body look.
A plausible muscle affecting technology appears to be electromagnetic muscle stimulation which has been previously used for muscle training 3, 4, 5, 6, 7, 8. This technology utilizes the concept of electromagnetic induction first described by Faraday in 1831. A wire coil generates an intense alternating magnetic field, which consequently induces a secondary electric current in the underlying tissue where it interacts with neurons. When the induced current in the tissue is of high magnitude, it can depolarize motor neurons and therefore trigger muscle contractions. Predominantly motor neurons are activated due to their large diameter and thus lower resistance in comparison to other types of neurons. Since the nociceptors are not activated, the application of magnetic stimulation is not painful 9.
The electromagnetic pulses are delivered in a high‐frequency rate prohibiting muscle relaxation which results in a phenomenon referred to as supramaximal or tetanic contractions, not reproducible by voluntary muscle contraction. The study by Kent et al. 10 investigated the high intensity focused electromagnetic technology utilizing the principles of electromagnetic stimulation and found that therapy composed of four 30‐minute sessions lead to a 16 % increase in abdominal muscle thickness and 19 % reduction in the abdominal fat layer. As the treatment directly affects muscles, the continuity with reduced fat thickness is not clear.
We hypothesize that the induced supramaximal contractions may lead to an increased metabolic activity in the region of stimulation and subsequent breakdown of lipids into free fatty acids (FFA) and glycerol 8, 11, 12, 13 as seen during intensive resistance training 14, 15. In the case of supramaximal contractions, the lipid breakdown could lead to overflow of free fatty acids (FFA) in the intracellular space. When the amount of FFAs exceeds a certain level in the intracellular space, this may lead to adipocyte dysfunction 16, 17, 18, 19. An increased intracellular concentration of FFA may also lead to the natural death of affected cells by a mechanism of the endoplasmic reticulum (ER) stress‐induced apoptosis. The principle of ER stress and its contribution to apoptosis induction has been previously described by Hardy et al. 20 and Gunduz et al. 21, who studied the effect of FFA in treating cancerous cells. According to results published by Zhang et al. 22, it was confirmed that ER stress contributes to apoptosis induced by increased levels of FFAs. It may thus seem plausible to hypothesize that if high enough concentration of FFAs in adipose tissue is released through a metabolic reaction, incremental apoptotic processes could also be triggered in adipocytes via similar mechanisms.
Our study investigates a novel concept to induce cellular stress with increased FFAs leading to adipocyte apoptosis using High‐Intensity Focused Electromagnetic (HIFEM) technology. The first step in investigating this phenomenon and the goal of this study is to examine whether a single High‐Intensity Focused Electromagnetic treatment leads to apoptosis of adipocytes in a porcine model.
MATERIALS AND METHODS
The Institutional Animal Care and Use Committee (IACUC) and the committee for animal protection approved this study. Animal care complied with the convention for the protection of vertebrate animals used for experimental and other scientific purposes. The animals were treated under general anesthesia to minimize their discomfort. Animals were anesthetized under the supervision of a veterinarian who chose the anesthetic type and dosing. The study was conducted on three Yorkshire pigs (approx. 6 months old, 80 kg of live weight). Two pigs underwent the treatment; one pig served as a control subject.
The EMSCULP device (BTL Industries Inc., Marlborough, MA) was used to generate the high‐intensity focused electromagnetic pulses for the treatment. The focused circular coil of the device generates electromagnetic pulses with the intensity of up to 1.8 Tesla. Areas on the abdomen in the region of the rectus abdominis in the porcine subjects were shaved and marked. Fat thickness was measured using ultrasonography (Mindray M5Vet) to ensure the treatment was applied to an area with sufficient fat deposits. The applicator was placed over the marked spot (diameter 15 cm) and secured using a Velcro belt. The time of procedure was set at 30 minutes with the intensity being 100% of the applicator output.
Punch biopsy samples of fat tissue together with blood samples were collected before treatment (baseline), 1 hour and 8 hours after the treatment. Biopsy samples were taken using a disposable biopsy punch (diameter 6 mm), and the incisions were sutured after the sample collection. Fat tissue samples for Apoptotic Index (AI) measurement was preserved in 4% neutral buffered formaldehyde, dehydrated, cleared, embedded with paraffin wax and sectioned to 5 µm thick slices. Tissue was stained for terminal deoxynucleotidyl transferase dUTP nick end labeling (TUNEL). TUNEL is a standard method used for detecting DNA fragmentation that results from apoptotic signaling cascades. Apoptotic events in the specimens were quantified using AI which is a measure of the number of the apoptotic events expressed as a ratio or percentage of all cells counted.
Biopsy samples were also evaluated for molecular biochemistry apoptotic and antiapoptotic markers. Total RNA free of DNA contamination was obtained by isolation method using Tri RT Reagent (MRC, Cincinnati, USA) and was further purified using RNeasy Mini Kit columns (Qiagen, Darmstadt, Germany). M‐MLV reverse transcriptase and oligo(dT) primer specific to mRNA were used to cDNA generation. Expression of 11 genes involved in apoptotic processes (TNF‐α, IL‐1β, IL‐10, TIMP‐1, TGF‐β1, MMP 9, VEGFA, FGF‐7, BAD, Bcl‐2, TRX‐2) was calculated according to the formula introduced by Zelnickova et al. 23 while HPRT1 gene was chosen as reference. QIAGEN QuantiTect SYBR Green PCR MasterMix was used for qPCR performed on a LightCycler 480 (Roche, Basel, Switzerland) under following conditions: denaturation at 95°C for 15 minutes and 45 amplification cycles at 95°C for 15 s, 58°C for 30 s and 72°C for 30 s. Gene‐specific primers were designed using NCBI primer designing software Primer‐Blast. Each sample was run in triplicate. The resulting melting curves were analyzed to test the product specificity using LightCycler 480 software 1.5.0.39. Non‐template controls were included in each part of the gene expression assessment.
Additionally, to measure parameters related to safety as well as to fat/muscle metabolisms, blood samples were obtained. The safety parameters for liver and kidney function and lipid metabolism are mentioned in Table 2 and include: Alanine aminotransferase (ALT), Aspartate aminotransferase (AST), Alkaline phosphatase (ALP), Cholesterol (Chol), Urea, Total protein (TP), Albumin (Alb), Calcium (Ca), Magnesium (Mg), Phosphorus (P) and Ferrum (Fe). Besides the safety parameters, the stability of the blood parameters involved in fat 24 or muscle metabolism 25, 26, 27 was observed including: Free fatty acids (FFA), Glucose (Glu), Triacylglycerol (TG), Glycerol, Creatinine (Crea), Creatinine kinase (CK), Lactate dehydrogenase (LDH) and Interleukin 6 (IL6). All data were evaluated using MINDRAY BS 200 Chemistry analyzer, except for the FFA, IL6, and GLY which were investigated using ELISA Test Kits (FFA Quantification Kit (Abcam), Porcine IL‐6 Quantikine ELISA Kit (Bio‐techne R&D systems) and Glycerol Colorimetric Assay Kit (Cayman Chemical)). Fluctuations of the studied parameters were evaluated concerning their reference ranges in pigs 28.
Table 2.
Summary of Plasma Blood Parameters of the Treated and Control Animals
| Control | Treated | |||||||
|---|---|---|---|---|---|---|---|---|
| Parameter | Unit | Before | 1 hour Post‐Tx | 8 hours Post‐Tx | Before | 1 hour Post‐Tx | 8 hours Post‐Tx | Reference range (Min to Max) |
| ALT | µkat·l−1 | 0.66 | 0.61 | 0.65 | 0.79 | 0.80 | 0.84 | 0.50–1.00 |
| AST | µkat·l−1 | 0.41 | 0.46 | 0.46 | 0.50 | 0.53 | 0.53 | 0.10–1.00 |
| ALP | µkat·l−1 | 2.49 | 2.35 | 2.63 | 4.56 | 4.52 | 4.60 | 2.00–5.10 |
| CK | µkat·l−1 | 29.99 | 26.08 | 31.71 | 29.67 | 28.83 | 97.25 | 0.00–35.00 |
| LDH | µkat·l−1 | 10.94 | 11.04 | 10.29 | 13.84 | 13.74 | 18.74 | 3.90–11.50 |
| Glu | mmol·l−1 | 5.46 | 4.19 | 4.70 | 5.11 | 5.84 | 5.04 | 3.80–6.40 |
| Crea | µmol·l−1 | 114.85 | 109.62 | 138.78 | 130.36 | 125.47 | 129.27 | 88.00–145.00 |
| Urea | mmol·l−1 | 2.00 | 3.00 | 4.00 | 4.88 | 4.88 | 6.06 | 3.00–6.00 |
| TP | g·l−1 | 60.21 | 57.27 | 59.88 | 60.71 | 61.01 | 59.28 | 60.00–85.00 |
| Alb | g·l−1 | 36.10 | 35.20 | 36.70 | 31.81 | 31.56 | 31.95 | 35.00–45.00 |
| TG | mmol·l−1 | 0.14 | 0.10 | 0.12 | 0.56 | 0.52 | 0.27 | 0.00–0.50 |
| Chol | mmol·l−1 | 2.32 | 2.41 | 2.67 | 2.40 | 2.37 | 2.29 | 2.00–3.30 |
| Ca | mmol·l−1 | 2.46 | 2.35 | 2.38 | 2.44 | 2.47 | 2.36 | 2.30–3.10 |
| Mg | mmol·l−1 | 0.74 | 0.69 | 0.76 | 0.82 | 0.82 | 0.82 | 0.50–1.20 |
| P | mmol·l−1 | 2.46 | 2.42 | 2.61 | 2.61 | 2.38 | 2.60 | 2.10–3.30 |
| Fe | µmol·l−1 | 19.80 | 21.30 | 20.80 | 21.65 | 22.25 | 18.65 | 18.00–35.00 |
| FFA | mmol·l−1 | 0.70 | 0.42 | 0.60 | 1.14 | 1.50 | 0.82 | 0.00–1.00 |
| IL6 | ng·l−1 | 0.00 | 0.00 | 0.22 | 0.00 | 0.00 | 0.25 | 0.00–5.50 |
| Glycerol | mg·l−1 | 3.06 | 3.83 | 4.79 | 10.36 | 11.03 | 4.68 | 0.00–10.00 |
To investigate the statistical significance of changes in the apoptotic index on a total of 90 tissue samples we used a repeated measures ANOVA test (rANOVA). Tukey's test for equal sample sizes was used for post‐hoc analysis, to identify significant changes. Significance level α was set in both as 5%. Blood parameters and RNA apoptotic markers were not statistically tested as only one sample was collected from each subject at a time.
RESULTS
Post‐anesthesia the porcine subjects recovered well without any observable adverse effects. No erythema, change in skin texture, an increase in skin temperature, scarring or ruptures were seen. Analysis of the histology from treated pigs confirmed an increased number of apoptotic fat cells as predicted (Fig. 1). A statistically significant difference (P = 1.17E‐4) was found between the baseline and 8‐hour post‐treatment measurements while the change in AI in the control pig was insignificant (P = 0.15).
Figure 1.
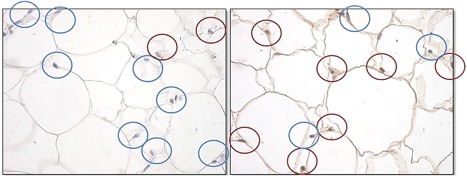
Histological examination of apoptosis in pig fat tissue (TUNEL method). Apoptotic nuclei are marked brown, while the intact nuclei are marked blue. There was an increase in the number of apoptotic nuclei after the treatment.
An increase in the AI was observed in the two treated porcine subjects (Fig. 2). The highest average percentage of apoptotic cells in the total number of cells was measured at 1‐hour after treatment in porcine subject #1 (43.10%). On average, apoptotic nuclei were observed to be at 18.75% at baseline, then 29.40% one hour after treatment and 35.95% 8 hours after treatment (Fig. 3). The control (untreated) animal did not show any significant increase in AI (P > 0.05).
Figure 2.
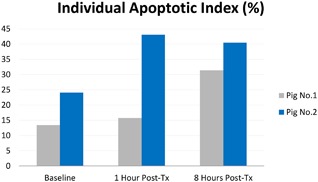
Average AI (%) evaluated in each pig individually.
Figure 3.
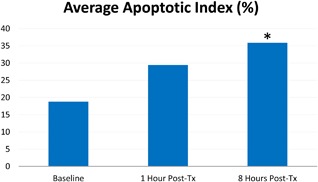
Average AI (%). In treated subjects, there were on average 35.95% of apoptotic nuclei observed at 8 hours post‐tx. An asterisk symbol (*) marks the statistically significant difference against the baseline.
Results of RNA apoptotic markers evaluation are summarized in Table 1. All the examined markers measured in treated pigs showed increased values 1 hour after treatment. Except for the IL‐1β (which is also a mark of extreme muscular activity) their values decreased at 8 hours after the treatment. The highest relative increases were observed in the case of Pro‐Apoptotic markers TNF‐α (from 0.05 to 5.84) and MMP 9 (from 0.27 to 5.21). The Anti‐apoptotic markers also changed considerably (especially the TIMP‐1 and TRX‐2 markers). The apoptotic markers of control pig showed only minimal fluctuations over the course of the study.
Table 1.
Results of RNA Apoptotic Markers Evaluation
| Control | Treated | ||||||
|---|---|---|---|---|---|---|---|
| Parameter | Function | Before | 1 hour Post‐Tx | 8 hours Post‐Tx | Before | 1 hour Post‐Tx | 8 Hours Post‐Tx |
| TNF‐α | P | 0.11 | 0.08 | 0.12 | 0.05 | 5.84 | 0.16 |
| IL‐1β | P | 0.14 | 0.11 | 0.14 | 0.09 | 0.14 | 0.20 |
| IL‐10 | A | 0.12 | 0.17 | 0.14 | 0.10 | 0.51 | 0.11 |
| TIMP‐1 | A | 1.86 | 1.11 | 2.09 | 0.71 | 7.54 | 1.93 |
| TGF‐β1 | Both | 0.72 | 0.74 | 0.81 | 0.51 | 1.30 | 0.30 |
| MMP 9 | P | 0.23 | 0.25 | 0.27 | 0.19 | 5.21 | 0.17 |
| VEGFA | A | 1.13 | 1.56 | 0.81 | 1.36 | 2.28 | 0.59 |
| FGF‐7 | A | 0.33 | 0.86 | 1.47 | 0.57 | 3.97 | 2.79 |
| BAD | P | 0.57 | 0.55 | 0.64 | 0.47 | 1.20 | 0.73 |
| BCL 2 | A | 1.32 | 1.27 | 1.47 | 3.23 | 3.86 | 1.59 |
| TRX‐2 | A | 11.93 | 18.13 | 13.39 | 11.77 | 73.98 | 16.63 |
The function of an evaluated marker can be Pro‐Apoptotic (P), Anti‐Apoptotic (A) or both (B). All values are expressed as a ratio to reference value.
Biochemistry analysis of plasma samples demonstrated no severe abnormalities of safety parameters. Urea, TP, and Alb showed slight but negligible fluctuations over their reference ranges. In addition, data obtained from the control pig indicated stability of measured parameters. Results are summarized in Table 2.
In comparison to the control subject, the changes in parameters involved in fat metabolism were observed. The FFA and Glycerol showed an initial increase over the reference range 1‐hour post‐treatment, with a drop to almost half of their initial levels at 8 hours post‐treatment. Similar findings were observed when evaluating the level of TG or GLU; nevertheless, the concentration of glucose remained within the reference range during the whole study.
Evaluation of parameters associated with muscle activity (specifically LDH and CK) showed an increase at 8 hours post‐treatment in treated pigs. Both compounds exceeded reference ranges. LDH catalytic activity has increased by 35.40% from 13.84 μkat · l−1 to 18.74 μkat · l−1 while CK catalytic activity increased by 227.80% from 29.67 μkat · l−1 to 97.25 μkat · l−1. See Figures 4 and 5. The amount of IL6 has only barely changed and remained stable at zero (or close to zero) levels in all subjects. It's increase after 8 hours after the therapy was assessed as inappreciable, while the same tendency was also observed in the control pig. The creatinine level was stable, and despite slight fluctuations, it's level remained within the reference range in both control and treated groups.
Figure 4.
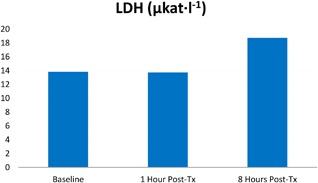
Increase of LDH catalytic activity in porcine serum levels.
Figure 5.
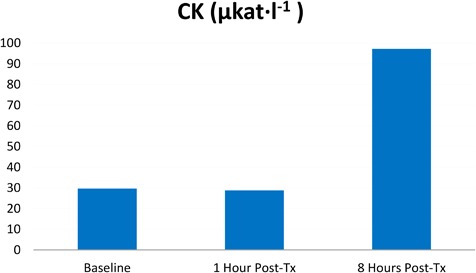
Increase of CK catalytic activity in porcine serum levels.
DISCUSSION
This study was designed to investigate the clinical effect of HIFEM treatment in a porcine model. The primary finding was the statistically significant (P < 1.17E‐4) increase in fat cell apoptotic activity. The high frequency oscillating magnetic field primarily affects the motor nerves in the treated area 29, 30 causing supramaximal muscle contraction which then increases intracellular concentrations of FFA. This continuous release of FFA typically provokes a stress‐induced apoptotic response 31, 32.
The observed histological changes are comparable to previously published data evaluated on porcine models 33, 34, 35 and human volunteers 36, using thermal effect based devices. Based on previous findings it was also documented that adipocytes apoptosis cause a reduction of the fat layer. Nevertheless, due to the non‐thermal nature of the magnetic field, no inflammatory responses were noted during our study.
Stability of safety parameters after treatment confirms the safety of the technology, although some of the parameters showed slight fluctuations above or below the reference ranges. However, these fluctuations were classified as irrelevant and related to the preparation of animals for the treatment procedure. The anesthesia most likely caused the slightly increased level of Urea 8 hours after treatment due to reduced water consumption. Total protein levels decreased as a response to starvation diet as a part of the preparation for anesthesia. Stability of cholesterol concentration follows findings from literature as general anesthesia or fasting before therapy did not affect cholesterol blood level 37.
Analysis of RNA markers involved in apoptotic processes revealed that tissue exposed to HIFEM treatment demonstrated a pro‐apoptotic reaction. Several studies have documented the role of TNF‐α in adipocyte apoptosis. It serves as the critical regulator of immune response, in part by inducing apoptosis during which its levels increases 38, 39, 40. During apoptosis and pro‐inflammatory processes, it influences the activity of other adipocytokines, such as tissue inhibitor of metalloproteinase (TIMP‐1) 41 and matrix metalloproteinase 9 (MMP‐9) 42. The increase of Thioredoxin‐2 (TRX‐2) mitochondrial protein that serves as a cell protector against oxidative stress induced apoptosis 43 may be explained either by its reaction to macrophage products or by the intensive muscle activity 44.
Bcl‐2 belongs to a growing family of proteins which contain both anti‐ and pro‐apoptotic members. During certain apoptosis pathways, it is dysregulated by pro‐apoptotic protein BAD, which activity is related to TNF‐α 45. Anti‐inflammatory cytokine IL‐10 also upregulates during adipocyte apoptosis as a part of the signaling pathway between adipocytes and macrophages 40. Changes were also observed in the TGF‐β1 marker which plays a role in many cellular functions including cell proliferation, growth, differentiation, and it can provide signals for both cell survival and apoptosis. Results show that due to its increased numbers, HIFEM treatment may have an impact on TGF‐β1 apoptotic regulations 46. Only the IL‐1β marker has maintained a growing tendency 8 hours after the treatment. Besides apoptosis, this marker is also related to extreme muscular activity 47. This could explain its elevated levels at the time of the last measurement, which coheres with the observation of parameters related to intense muscle activity (CK and LDH). A similar mechanism may also explain the slightly increased levels of vascular endothelial growth factor A (VEGFA), angiogenesis inducing protein, of which intensive workout 48 might also upregulate expression in adipose tissue.
Increased levels of CK and LDH indicated extensive muscle activity. Elevation of these parameters after an intense muscle activity was also observed in other studies 25 on human subjects. CK is an enzyme that catalyzes the conversion of creatinine during muscle activity. Exercise increases the outflow of CK to the bloodstream with delayed onset 49. The highest catalytic activity of CK in our study was measured 8‐hours post‐treatment (97.25 μkat · l−1) and greatly exceeded the reference range. LDH is an enzyme which is also involved in muscle metabolism. It catalyzes the conversion of lactate to pyruvic acid and vice versa. This correlates with previous observations that LDH levels in blood serum increase considerably after intensive exercise in human subjects 25. Similarly to CK, LDH levels in our study reached the highest values 8 hours after treatment (catalytic activity measured as 18.74 μkat · l−1).
Eight hours after the treatment, a drop was observed in the concentration of blood parameters associated with fat metabolism (TG −51.8%; FFA −28.1%; glycerol −54.8%). This could have been caused by the body metabolism exceeding its basal level for a certain period after the actual muscle contractions. Also, the energy supplies in the form of FFA, TG, and glycerol are further metabolized. Similar trends were also noted by Ferguson et al. 50 who observed 26–36% reduction in TG 24 hours after the single exercise, depending on the caloric expenditure.
CONCLUSION
Application of a high‐intensity electromagnetic field which induces non‐voluntary, extensive muscle contractions results in apoptosis of adipocytes. The analysis of serum levels shows trends which suggest that HIFEM treatment directly influences fat and muscle metabolisms. Data to support these conclusions include histological TUNEL staining, RNA molecular analysis and serum levels of muscle metabolites. No adverse events were noted to skin and surrounding tissue.
Conflict of Interest Disclosures: All authors have completed and submitted the ICMJE Form for Disclosure of Potential Conflicts of Interest and have disclosed the following: Robert Weiss is a medical advisor and speaker for BTL. Jan Bernardy has no conflicts to declare.
REFERENCES
- 1. Kruger J, Lee C‐D, Ainsworth BE, Macera CA. Body size satisfaction and physical activity levels among men and women. Obesity 2008;16(8):1976–1979. [DOI] [PubMed] [Google Scholar]
- 2. Kennedy J, Verne S, Griffith R, Falto‐Aizpurua L, Nouri K. Non‐invasive subcutaneous fat reduction: a review. J Eur Acad Dermatol Venereol 2015;29(9):1679–1688. [DOI] [PubMed] [Google Scholar]
- 3. Han T‐R, Shin H‐I, Kim I‐S. Magnetic stimulation of the quadriceps femoris muscle: comparison of pain with electrical stimulation. Am J Phys Med Rehabil 2006;85(7):593–599. [DOI] [PubMed] [Google Scholar]
- 4. Galloway NTM, El‐Galley RES, Sand PK, Appell RA, Russell HW, Carlan SJ. Extracorporeal magnetic innervation therapy for stress urinary incontinence. Urology 1999;53(6):1108–1111. [DOI] [PubMed] [Google Scholar]
- 5. Lin VW, Hsieh C, Hsiao IN, Canfield J. Functional magnetic stimulation of expiratory muscles: a noninvasive and new method for restoring cough. J Appl Physiol 1998;84(4):1144–1150. [DOI] [PubMed] [Google Scholar]
- 6. Abulhasan JF, Rumble YLD, Morgan ER, Slatter WH, Grey MJ. Peripheral electrical and magnetic stimulation to augment resistance training. J Funct Morphol Kinesiol 2016;1(3):328–342. [Google Scholar]
- 7. Yang S, Jee S, Hwang SL, Sohn MK. Strengthening of quadriceps by neuromuscular magnetic stimulation in healthy subjects. PM&R 2017;9(8):767–773. [DOI] [PubMed] [Google Scholar]
- 8. Bustamante V, López de Santa María E, Gorostiza A, Jiménez U, Gáldiz JB. Muscle training with repetitive magnetic stimulation of the quadriceps in severe COPD patients. Respir Med 2010;104(2):237–245. [DOI] [PubMed] [Google Scholar]
- 9. Tyler DJ. Peripheral nerve stimulation In: Series on bioengineering and biomedical engineering. Vol 8. 2nd edition Baltimore, MD: World Scientific; 2017. pp 300–347. [Google Scholar]
- 10. Kent DE, Jacob CI. Computed tomography (CT) based evidence of simultaneous changes in human adipose and muscle tissues following a high intensity focused electro‐magnetic (hifem) application: a new method for non‐invasive body sculpting. In: Dallas TX, USA; 2018.
- 11. Alsted TJ, Ploug T, Prats C, et al. Contraction‐induced lipolysis is not impaired by inhibition of hormone‐sensitive lipase in skeletal muscle. J Physiol (Lond) 2013;591(20):5141–5155. [DOI] [PMC free article] [PubMed] [Google Scholar]
- 12. Stallknecht B, Dela F, Helge JW. Are blood flow and lipolysis in subcutaneous adipose tissue influenced by contractions in adjacent muscles in humans? Am J Physiol Endocrinol Metab 2007;292(2):E394–E399. [DOI] [PubMed] [Google Scholar]
- 13. Polkey MI, Kyroussis D, Hamnegard CH, Mills GH, Green M, Moxham J. Quadriceps strength and fatigue assessed by magnetic stimulation of the femoral nerve in man. Muscle Nerve 1996;19(5):549–555. [DOI] [PubMed] [Google Scholar]
- 14. Chatzinikolaou A, Fatouros I, Petridou A, et al. Adipose tissue lipolysis is upregulated in lean and obese men during acute resistance exercise. Diabetes Care 2008;31(7):1397–1399. [DOI] [PMC free article] [PubMed] [Google Scholar]
- 15. Ormsbee MJ, Thyfault JP, Johnson EA, Kraus RM, Choi MD, Hickner RC. Fat metabolism and acute resistance exercise in trained men. J Appl Physiol 2007;102(5):1767–1772. [DOI] [PubMed] [Google Scholar]
- 16. Zha BS, Zhou H. ER stress and lipid metabolism in adipocytes. Biochemistry Research International 2012; DOI: 10.1155/2012/312943. [DOI] [PMC free article] [PubMed] [Google Scholar]
- 17. Liu Z, Gan L, Wu T, et al. Adiponectin reduces ER stress‐induced apoptosis through PPARα transcriptional regulation of ATF2 in mouse adipose. Cell Death Dis 2016;7(11):e2487. [DOI] [PMC free article] [PubMed] [Google Scholar]
- 18. Tripathi YB, Pandey V. Obesity and endoplasmic reticulum (ER) stresses. Front Immunol 2012;3. [DOI] [PMC free article] [PubMed] [Google Scholar]
- 19. Ghosh AK, Garg SK, Mau T, O'Brien M, Liu J, Yung R. Elevated endoplasmic reticulum stress response contributes to adipose tissue inflammation in aging. J Gerontol A Biol Sci Med Sci 2015;70(11):1320–1329. [DOI] [PMC free article] [PubMed] [Google Scholar]
- 20. Hardy S, El‐Assaad W, Przybytkowski E, Joly E, Prentki M, Langelier Y. Saturated fatty acid‐induced apoptosis in MDA‐MB‐231 breast cancer cells. A role for cardiolipin. J Biol Chem 2003;278(34):31861–31870. [DOI] [PubMed] [Google Scholar]
- 21. Gunduz F, Aboulnasr FM, Chandra PK, et al. Free fatty acids induce ER stress and block antiviral activity of interferon alpha against hepatitis C virus in cell culture. Virol J 2012;9:143. [DOI] [PMC free article] [PubMed] [Google Scholar]
- 22. Zhang Y, Xue R, Zhang Z, Yang X, Shi H. Palmitic and linoleic acids induce ER stress and apoptosis in hepatoma cells. Lipids Health Dis 2012;11:1. [DOI] [PMC free article] [PubMed] [Google Scholar]
- 23. Zelnickova P, Leva L, Stepanova H, Kovaru F, Faldyna M. Age‐dependent changes of proinflammatory cytokine production by porcine peripheral blood phagocytes. Vet Immunol Immunopathol 2008;124(3‐4):367–378. [DOI] [PubMed] [Google Scholar]
- 24. Coelho M, Oliveira T, Fernandes R. Biochemistry of adipose tissue: an endocrine organ. Arch Med Sci 2013;9(2):191–200. [DOI] [PMC free article] [PubMed] [Google Scholar]
- 25. Brancaccio P. Monitoring of serum enzymes in sport. Br J Sports Med 2006;40(2):96–97. [DOI] [PMC free article] [PubMed] [Google Scholar]
- 26. Muñoz‐Cánoves P, Scheele C, Pedersen BK, Serrano AL. Interleukin‐6 myokine signaling in skeletal muscle: a double‐edged sword? FEBS J 2013;280(17):4131–4148. [DOI] [PMC free article] [PubMed] [Google Scholar]
- 27. Farshidfar F, Pinder MA, Myrie SB. Creatine supplementation and skeletal muscle metabolism for building muscle mass‐ review of the potential mechanisms of action. Curr Protein Pept Sci 2017;18(12):1273–1287. [DOI] [PubMed] [Google Scholar]
- 28. Zimmerman JJ. ed. Diseases of Swine. 10th ed Chichester, West Sussex: Wiley‐Blackwell; 2012. [Google Scholar]
- 29. Nagarajan S, Durand D, Warman E. Effects of induced electric fields on finite neuronal structures: a simulation study. IEEE Trans Biomed Eng 1993;40(11):1175–1188. [DOI] [PubMed] [Google Scholar]
- 30. Hsu K‐H, Durand D. Prediction of neural excitation during magnetic stimulation using passive cable models. IEEE Trans Biomed Eng 2000;47(4):463–471. [DOI] [PubMed] [Google Scholar]
- 31. Kawasaki N, Asada R, Saito A, Kanemoto S, Imaizumi K. Obesity‐induced endoplasmic reticulum stress causes chronic inflammation in adipose tissue. Sci Rep 2012;2:799. [DOI] [PMC free article] [PubMed] [Google Scholar]
- 32. Cui W, Ma J, Wang X, Yang W, Zhang J, Ji Q. Free fatty acid induces endoplasmic reticulum stress and apoptosis of β‐cells by Ca2+/Calpain‐2 pathways. PLoS ONE 2013;8(3):e59921. [DOI] [PMC free article] [PubMed] [Google Scholar]
- 33. Zelickson B, Egbert BM, Preciado J, et al. Cryolipolysis for noninvasive fat cell destruction: initial results from a pig model. Dermatol Surg 2009;35(10):1462–1470. [DOI] [PubMed] [Google Scholar]
- 34. McDaniel D, Fritz K. A focused monopolar radiofrequency causes apoptosis: a porcine model. J Drugs Dermatol 13(11):1336–1340. [PubMed] [Google Scholar]
- 35. Weiss R, Weiss M, Beasley K, Vrba J, Bernardy J. Operator independent focused high frequency ISM band for fat reduction: porcine model: fOCUSED FIELD RF FOR FAT REDUCTION. Lasers Med Sci 2013;45(4):235–239. [DOI] [PMC free article] [PubMed] [Google Scholar]
- 36. McDaniel D, Lozanova P. Human adipocyte apoptosis immediately following high frequency focused field radio frequency: case study. J Drugs Dermatol 2015;14(6):622–623. [PubMed] [Google Scholar]
- 37. Tanaka H, Igarashi T, Lefor AT, Kobayashi E. The effects of fasting and general anesthesia on serum chemistries in KCG miniature pigs. J Am Assoc Lab Anim Sci 2009;48(1):33–38. [PMC free article] [PubMed] [Google Scholar]
- 38. Fischer‐Posovszky P, Wang QA, Asterholm IW, Rutkowski JM, Scherer PE. Targeted deletion of adipocytes by apoptosis leads to adipose tissue recruitment of alternatively activated M2 macrophages. Endocrinology 2011;152(8):3074–3081. [DOI] [PMC free article] [PubMed] [Google Scholar]
- 39. Keuper M, Wernstedt Asterholm I, Scherer PE, et al. TRAIL (TNF‐related apoptosis‐inducing ligand) regulates adipocyte metabolism by caspase‐mediated cleavage of PPARgamma. Cell Death Dis 2013;4:e474. [DOI] [PMC free article] [PubMed] [Google Scholar]
- 40. Sárvári AK, Doan‐Xuan Q‐M, Bacsó Z, Csomós I, Balajthy Z, Fésüs L. Interaction of differentiated human adipocytes with macrophages leads to trogocytosis and selective IL‐6 secretion. Cell Death Dis 2015;6(1):e1613. [DOI] [PMC free article] [PubMed] [Google Scholar]
- 41. Kralisch S, Klein J, Lossner U, et al. Isoproterenol, TNFalpha, and insulin downregulate adipose triglyceride lipase in 3T3‐L1 adipocytes. Mol Cell Endocrinol 2005;240(1–2):43–49. [DOI] [PubMed] [Google Scholar]
- 42. Hetzel M, Walcher D, Grüb M, Bach H, Hombach V, Marx N. Inhibition of MMP‐9 expression by PPARgamma activators in human bronchial epithelial cells. Thorax 2003;58(9):778–783. [DOI] [PMC free article] [PubMed] [Google Scholar]
- 43. Pérez VI, Lew CM, Cortez LA, et al. Thioredoxin 2 haploinsufficiency in mice results in impaired mitochondrial function and increased oxidative stress. Free Radic Biol Med 2008;44(5):882–892. [DOI] [PubMed] [Google Scholar]
- 44. Fisher‐Wellman KH, Mattox TA, Thayne K, et al. Novel role for thioredoxin reductase‐2 in mitochondrial redox adaptations to obesogenic diet and exercise in heart and skeletal muscle. J Physiol (Lond) 2013;591(14):3471–3486. [DOI] [PMC free article] [PubMed] [Google Scholar]
- 45. Sorisky A, Magun R, Gagnon AM. Adipose cell apoptosis: death in the energy depot. Int J Obes Relat Metab Disord 2000;24(Suppl 4):S3–S7. [DOI] [PubMed] [Google Scholar]
- 46. Huynh M‐LN, Fadok VA, Henson PM. Phosphatidylserine‐dependent ingestion of apoptotic cells promotes TGF‐β1 secretion and the resolution of inflammation. J Clin Invest 2002;109(1):41–50. [DOI] [PMC free article] [PubMed] [Google Scholar]
- 47. Shirato K, Imaizumi K, Sakurai T, Ogasawara J, Ohno H, Kizaki T. Regular voluntary exercise potentiates interleukin‐1β and interleukin‐18 secretion by increasing caspase‐1 expression in murine macrophages. Mediators Inflamm 2017;2017:9290416. [DOI] [PMC free article] [PubMed] [Google Scholar]
- 48. Lee HJ. Exercise training regulates angiogenic gene expression in white adipose tissue. J Exerc Rehabil 2018;14(1):16–23. [DOI] [PMC free article] [PubMed] [Google Scholar]
- 49. Havas E, Komulainen J, Vihko V. Exercise‐Induced increase in serum creatine kinase is modified by subsequent bed rest. Int J Sports Med 1997;18(08):578–582. [DOI] [PubMed] [Google Scholar]
- 50. Ferguson MA, Alderson NL, Trost SG, Essig DA, Burke JR, Durstine JL. Effects of four different single exercise sessions on lipids, lipoproteins, and lipoprotein lipase. J Appl Physiol 1998;85(3):1169–1174. [DOI] [PubMed] [Google Scholar]