Abstract
Purpose
To obtain a fast and robust fat‐water separation with simultaneous estimation of water T1, fat T1, and fat fraction maps.
Methods
We modified an MR fingerprinting (MRF) framework to use a single dictionary combination of a water and fat dictionary. A variable TE acquisition pattern with maximum TE = 4.8 ms was used to increase the fat–water separability. Radiofrequency (RF) spoiling was used to reduce the size of the dictionary by reducing T2 sensitivity. The technique was compared both in vitro and in vivo to an MRF method that incorporated 3‐point Dixon (DIXON MRF), as well as Cartesian IDEAL with different acquisition parameters.
Results
The proposed dictionary‐based fat–water separation technique (DBFW MRF) successfully provided fat fraction, water, and fat T1, B0, and B1+ maps both in vitro and in vivo. The fat fraction and water T1 values obtained with DBFW MRF show excellent agreement with DIXON MRF as well as with the reference values obtained using a Cartesian IDEAL with a long TR (concordance correlation coefficient: 0.97/0.99 for fat fraction–water T1). Whereas fat fraction values with Cartesian IDEAL were degraded in the presence of T1 saturation, MRF methods successfully estimated and accounted for T1 in the fat fraction estimates.
Conclusion
The DBFW MRF technique can successfully provide T1 and fat fraction quantification in under 20 s per slice, intrinsically correcting T1 biases typical of fast Dixon techniques. These features could improve the diagnostic quality and use of images in presence of fat.
Keywords: fat quantification, MR fingerprinting, musculoskeletal imaging, T1 relaxometry
1. INTRODUCTION
Robust fat suppression methods are crucial in clinical MRI to obtain an accurate diagnosis of many diseases. For musculoskeletal imaging, fat–water imaging is useful in suppressing bone signal, imaging lesions, and highlighting synovial fluid.1 Because of its short T1, fat appears brighter than water in MRI images, which can hide crucial details of the anatomic structure and affect the diagnostic value of the exam. Moreover, the off‐resonant frequency of fat causes a positional displacement along the frequency‐encoding direction in conventional Cartesian‐encoded images.2 If a non‐Cartesian acquisition of k‐space is used, the off‐resonant signal of fat results in artifacts in all encoded directions presented as image blurring around fat.3
The most common techniques for fat suppression are selective pulse techniques, which saturate fat or selectively excite water,4, 5 short TI inversion recovery (STIR) techniques, which rely on the short T1 of fat to null the fat signal,6 and Dixon techniques, which exploit the phase variations induced by chemical shift through multiple readouts.7 Dixon techniques provide the most robust fat–water separation: selective pulse techniques are very sensitive to inhomogeneities of the B1+ and B0 fields, and STIR techniques may suppress the signal of other short T1 species.8 Unlike other techniques, Dixon methods allow intra‐voxel fat quantification, which can be a useful diagnostic information in several clinical situations.9, 10, 11
To obtain accurate measurements of fat fraction, several confounding factors must be addressed, such as T1 bias, T2 * decay of the signal, spectral complexity of fat, noise bias, and eddy current bias.12 In particular, T1 bias consists of an artificial amplification of the fat signal with respect to water because of their different T1. In fact, when the TR is short in comparison with water T1, the water signal is attenuated because of incomplete longitudinal recovery (T1 saturation), whereas the fat signal is less attenuated because of its shorter T1, leading to an overestimation of the fat fraction. To overcome this problem, low flip angle is required, limiting the SNR of the acquisition.13
A common feature of fat saturation and Dixon methods is that they mostly rely on repeated acquisitions using steady‐state signal models and usually discard transient‐state signals. Recent advances, including magnetic resonance fingerprinting (MRF),14 have demonstrated that undersampled transient‐state acquisitions can massively improve the efficiency of multi‐parametric mapping acquisitions when compared to steady‐state methods. The aim of this work was to demonstrate a novel approach to obtain a T1‐independent fat fraction map, as well as simultaneous estimation of fat and water T1 maps, using a transient‐state acquisition including both an inversion pulse and a variable TE pattern. This approach not only reduces the T1 bias by including T1 in the signal model, but exploits the T1 differences between fat and water to achieve a more robust fat quantification, effectively combining the ideas behind a Dixon method and a fat saturation method in a single sequence. To calculate the signal model, we used a novel multi‐component MRF framework. To validate the technique, we performed both in vitro and in vivo experiments comparing our approach to an MRF method that incorporated 3‐point Dixon (DIXON MRF), as well as Cartesian IDEAL with different acquisition parameters and gold standard T1 mapping.
2. METHODS
Under the assumption that fat and water are the only 2 chemical species contributing to the signal, the signal of a fat–water mixture is given by:
| (1) |
where and are the water and fat spin densities, is the fat–water chemical shift (220 Hz at 1.5T), and are the static field inhomogeneities. Defining the fat fraction, the signal Equation 1 can be rewritten as
| (2) |
where is the total spin density and are respectively the signal for water and fat, with ; .
The proposed dictionary‐based fat–water separation MRF method (shortened here as DBFW MRF) relies on the fat–water signal evolution Equation 2. Building on the unbalanced SSFP MRF implementation by Jiang et al.15 our transient‐state acquisition was preceded by an inversion pulse, sensitizing the sequence to the different T1 values of fat and water components. By introducing a variable TE scheme, the sequence was further sensitized to off‐resonance variations because of fat chemical shift. As a consequence, the signal from a mixture has different signal evolutions ranging from pure water and pure fat signal.
2.1. Multi‐component model estimation
The DBFW dictionary consisted of the combination of a 3D water‐only dictionary (T1 water, off‐resonance, B1+) and a 3D fat‐only dictionary (T1 fat, off‐resonance, B1+); fat off‐resonance values were shifted by 220 Hz for the fat‐only dictionary. In our acquisitions, RF spoiling with quadratic phase increment of 117° was used. Because RF‐spoiled sequences with short TE have very limited T2 and T2 *‐weighting16 (see Supporting Information Figure S1, showing the spoiling efficiency of the proposed acquisition scheme), transverse relaxation was neglected and perfect spoiling was assumed. Linear combinations of these 2 dictionaries were created according to Equation 2 to obtain a 5D fat–water dictionary (T1 water, T1 fat, off‐resonance, B1+, fat fraction), with fat fraction values ranging from 0–1. MRF dictionaries were computed using the extended phase graphs formalism17 including slice profile in the simulation.18, 19 SVD compression with a rank R = 100 was used.20
Even if SSFP‐MRF signal evolution has proved to be insensitive to B0 inhomogeneities,15 spiral encoding is still affected by blurring in presence of field inhomogeneities.21 Moreover, the introduction of variable TE introduces off‐resonance sensitivity of the signal evolution (Supporting Information Figure S1, showing the influence of variable TE on phase signal evolution).
To correct for B0‐induced blurring of the images, we adapted a 3‐step reconstruction pipeline previously introduced by Ye et al.22: first, MRF data were matched to a coarse dictionary to obtain a B0 map; second, the B0 map was used to correct the image phases in the image domain; and third, the corrected time frames were matched to a high‐resolution dictionary (with B0 = 0). In the first step, the time frames were smoothed with a Gaussian kernel of 3 × 3 FWHM and matched to Dictionary 1 (see Supporting Information Table S1) to obtain smooth B0 maps, which was the single parameter saved during this step and used for the next matching step. Single pixel noise spikes were removed using a 2D median filter with kernel width = 3 pixel.23 The B0 map was then used to deblur the original time frames via conjugate phase reconstruction.24
The deblurred time frames were then matched to Dictionary 2 (see Supporting Information Table S1, showing the parameters used to generate the dictionaries) to obtain fine water T1, fat T1, fat fraction, and B1+ maps. Image space data used for the matching were obtained from the raw k‐space data using non uniform fast Fourier transform (NUFFT) reconstruction25; data from different receiver were combined using adaptive coil combination26 before the matching step, retrieving the coil sensitivity maps by summing the data from each coil along the time dimension. All the quantitative MRF maps were obtained using a GPU implementation of the inner‐product pattern matching as described in the original MRF paper from Ma et al.14
2.2. Pattern validation
To evaluate the theoretical encoding capabilities for each of our measurements, the Cramer‐Rao bound for the proposed acquisition pattern was calculated. As shown by several previous studies27, 28 the minimum variance achievable for a given acquisition schedule is given by
| (3) |
where is the inverse of the Fisher information matrix, is the input noise variance, [T1 w, T1 f, B0, B1+ F] is the vector of tissue parameters and is the Jacobian matrix at the repetition time. Notice that Equation 3 provides estimation of minimum variance for a specific set of tissue parameters . Hence, we chose 2 representative tissues (water: T1 = 900 ms, T2 * = 30 ms, B0 = 30 Hz, B1+ = 1, representing the muscle; fat: T1 = 300 ms, T2 * = 30 ms, B0 = 30 + 220 Hz, B1+ = 1), and we computed the associated CRB for fat fraction values from 0 to 1 (step size: 0.01), assuming an input noise variance of 0.015. We then calculated the normalized SD as , where denotes the i diagonal element of the CRB matrix for a given fat fraction F.
2.3. Acquisition
All acquisitions were performed on a GE HDxt 1.5T scanner (GE Healthcare, Chicago, IL). Variable density spiral trajectories (FOV = 22.5 cm, matrix = 192 × 192, total readout length: 2.9 ms, full details in Supporting Information Figure S2, showing the gradient waveform and the corresponding k‐space trajectory) with golden‐angle rotations between each TR that were used.15 We acquired only 1 interleave for each time frame. The sampling trajectories were followed by a spoiler gradient achieving an 8 dephasing across a 5‐mm slice. RF spoiling with quadratic phase increment of 117° was used. For the DBFW acquisition, variables TE/TR were used as shown in Figure 1. Transient state acquisitions were preceded by a 10‐ms long hyperbolic secant adiabatic inversion pulse. A single gradient delay was estimated and used to correct the trajectory errors.29 Acquisition time was 16 s per slice.
Figure 1.
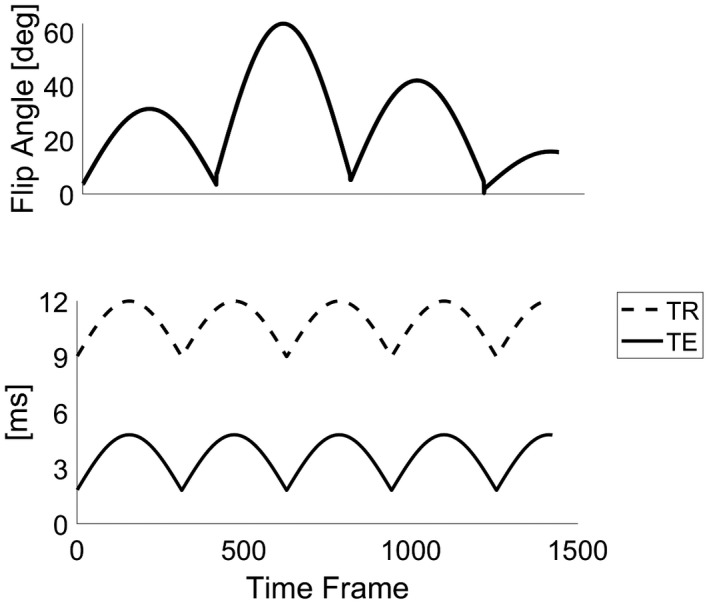
Acquisition pattern for the DBFW MRF method: flip angle pattern and TE/TR (solid line/dotted line) pattern
2.4. Comparison with DIXON MRF with static TE
To perform an assessment of dictionary‐based fat and water estimation, we compared this to a similar acquisition using static TE (here DIXON MRF). Our reference data consisted of 3 spoiled gradient echo (SPGR) MRF data sets with fixed TEs = 4.4, 6.6, 8.8 ms, TR = 15 ms and the same flip angle pattern, RF phase pattern, and number of frames as the DBFW MRF acquisition. Acquisition time was 21 s per slice for each TE. We used a 3‐point Dixon algorithm to obtain water‐only and fat‐only signal evolutions.30 Within the algorithm, we used a 2D phase unwrapping with a branch‐cut‐based algorithm.31, 32 The input values for the DIXON MRF water and fat dictionaries can be found in Supporting Information Table S1 (Dictionary 3). The PD, B1+, and T1 maps were independently estimated for water and fat.33 Fat fraction maps were obtained as the ratio between fat proton density and total proton density.
For both DBFW MRF and DIXON MRF, acquisitions were repeated 4 times to increase SNR, leading to a total acquisition time of 1:04 minutes per slice for DBFW MRF and 4:12 minutes per slice for DIXON MRF.
2.5. Comparison with Cartesian IDEAL experiments
To evaluate the fat quantification performance of the MRF‐based separation techniques with respect to currently available Cartesian acquisitions, fat fraction maps were obtained from a Cartesian IDEAL34 fast spin echo (matrix = 192 × 192, FA = 90°, TE/TR = 11.2 ms/15,000 ms, echo train length: 8). TR was set to 15,000 ms to allow complete longitudinal relaxation and to achieve PD weighted images, leading to an acquisition time of 21 minutes. Reference B0 and B1+ maps were obtained respectively using dual echo time technique35 (fast gradient echo, matrix = 192 × 192, FA = 5°, TE = 4.4/8.8 ms, TR = 500 ms, total acquisition time: 3:20 minutes) and double angle method (DAM)36 (fast gradient echo, matrix = 64 × 64, FA = 30°/60°, TE = 11.5 ms, TR = 5000 ms, total acquisition time: 12 minutes). FOV and slice thickness for all the reference acquisition were the same as MRF acquisitions.
2.6. In vitro experiment
A phantom, consisting of a set of vials filled with different oil–water emulsions ranging from pure water to pure oil (nominal fat fractions: 0%, 26%, 52%, 79.5%, 100%), was used to study DBFW MRF. Fat‐free gel samples with different T1s and T2s were included to assess the T1 quantification capability of the technique (see Supporting Information Figure S3 and Supporting Information Tables S2 and S3, showing a schematic representation of the phantom with corresponding nominal values). Data were acquired using an 8‐channel receiver coil. The fat fraction estimates based on MRF were compared to Cartesian IDEAL fat fraction maps, acquired with a range of different repetition times: TR = 15,000 ms, 5000 ms, 1200 ms, 500 ms, and 250 ms. To validate the T1 values obtained with the MRF methods, we acquired a set of inversion recovery prepared spin echo (IR‐SE) 2D images (matrix = 128 × 128, FA = 90°, TE/TR = 9 ms/7500 ms, inversion time = 50/220/400/1100/2500 ms, total acquisition time: ~1.5 h); gold standard T1 map was obtained by a voxel‐wise nonlinear least square fit of this complex data set using the model . FOV and slice thickness were the same as MRF acquisitions.
To investigate the robustness of the DBFW MRF in presence of static field inhomogeneities, the acquisition was repeated setting different central off‐resonance values ranging from −250 Hz to 250 Hz (step size: 25 Hz).
2.7. In vivo experiment
In compliance with our ethical approvals, 1 healthy human subject was scanned to test in vivo capability of the technique. The subject was scanned to obtain 5 oblique slices of the knee joint. In vivo data were acquired using a dedicated quadrature transmitter–receiver birdcage coil for knee imaging.
2.8. Analysis
To verify the effect of the B0 inhomogeneity correction step, the original and corrected DBFW MRF data set were summed along time dimension obtaining fully sampled images. Then, the intensity profile along both the original and the deblurred images was measured to give an estimate of the sharpness of the image before and after B0 correction.
To compare the DBFW MRF and DIXON MRF fat fraction values with the reference values obtained with Cartesian IDEAL in the in vitro experiment, a binary mask was created by segmenting the normalized proton density map. Mean and SD of fat fraction values for both MRF acquisitions and for Cartesian IDEAL were calculated for each individual vial. Agreement was assessed with the concordance correlation coefficient (CCC)37
| (4) |
where , and are respectively defined as , and are the fat fraction values for Cartesian (j = 1) and MRF (j = 2) and is the number of vials. In addition, a total least squares fit was performed with the model .
The same analysis was performed to compare water and fat T1 values from DBFW MRF and DIXON MRF. In addition, both MRF approaches were compared with IR‐SE.
To evaluate the impact of T1 bias on fat quantification, the average error with respect to nominal fat concentration was calculated for each vial and each technique (DIXON MRF, DBFW MRF, Cartesian IDEAL with TR = 15,000 ms/5000 ms/1200 ms/500 ms/250 ms). The results were reported as bar graphs.
To evaluate the robustness of our technique to off‐resonance, we calculated the absolute error between nominal fat fraction values and DBFW MRF of each vial containing a pure substance. The result was plotted as a function of B0 and T1.
In the in vivo experiment, 3 ROIs were manually drawn in the tibia, in the infrapatellar region, and in the muscle (Supporting Information Figure S3, showing the ROIs). The mean and SD of each parametric maps within these ROIs were obtained to compare fat fraction, B1+, and B0 values of MRF with the Cartesian references (IDEAL, DAM, dual echo) and to compare water and fat T1 of DIXON MRF and DBFW MRF.
2.9. Evaluation of fat–water boundaries in DBFW MRF
Images from DBFW MRF presented some artifacts at boundaries between fat and water tissues. To study fat blurring effects on parameter estimation, a test object was generated (see Supporting Information Figure S3 for the details of the test object). Extended phase graphs simulations were performed to generate fully sampled MRF frames and forward/backward non‐uniform fast Fourier transform accounting for fat chemical shift was applied to obtain undersampled and blurred MRF frames. Then, the data were matched to the dictionary to obtain the parametric maps. This experiment was repeated both for DIXON MRF and DBFW MRF.
3. RESULTS
DBFW MRF dictionary creation took, respectively, ~3000 s (first step) and ~1600 s (second step) on an Intel Xeon processor E5‐2600 v4 with 24 cores (Intel Corporation, Santa Clara, CA). Dictionary sizes after SVD compression were respectively ~1.4 GB (first step) and ~1 GB (second step). Pattern matching took ~24 s per slice (first step) and ~10 s per slice (second step) on an NVIDIA Tesla K80 GPU.
3.1. Pattern validation
Figure 2 shows the behavior of the normalized CRB (corresponding to the minimum normalized SD) for each estimated parameter (water T1, fat T1, B0, and B1+) for a mixture of muscle signal and fat signal as a function of the fat fraction. The SDs for B0 and B1+ remained below 2% within the entire range of fat fraction values, whereas the SD for the T1 of a given substance increased as the substance fraction decreased. More specifically, the fat T1 SD exceeded the 5% limits when the fat fraction was <26.5%, whereas the water T1 SD was >5% when the fat fraction was >74%. Hence, the fat and water T1 measurements are reliable only within these boundaries. Finally, the fat fraction SD was independent from the actual fat fraction value and was equal to 0.01.
Figure 2.
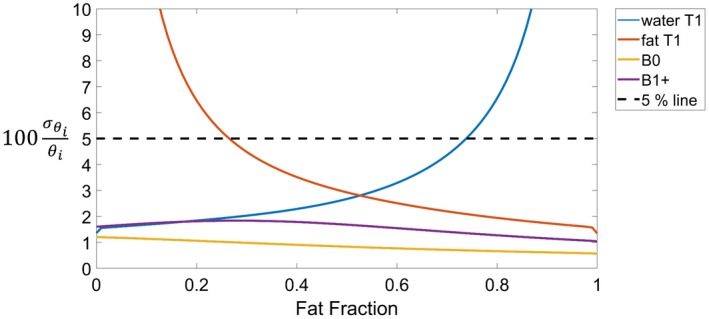
Simulations showing the normalized Cramer Rao Bound (percentage) assuming for water T1 = 900 ms, fat T1 = 300 ms, B0 = 30 Hz, B1+ = 1, and fat fraction ranging from 0 to 1 (step size: 0.01), where [water T1, fat T1, B0, B1+, fat fraction]
3.2. In vitro experiment
The acquisition time was 16 s per slice per repetition using DBFW MRF and 1:03 minutes when using 3‐echoes DIXON MRF. The B0 map obtained with the DBFW technique successfully reduced the blurring achieving sharper details, as shown in the intensity profiles plot of Figure 3.
Figure 3.
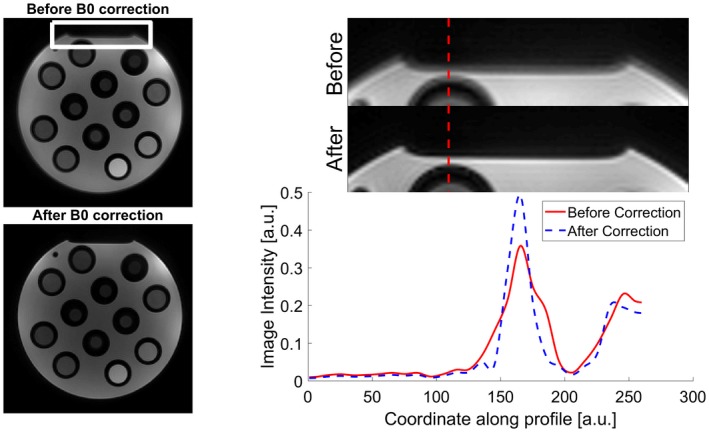
Effects of deblurring using our 2‐step MRF reconstruction on a detail of our in vitro acquisition (white rectangle). As shown by the intensity profile along the dotted red line, the corrected image (dotted blue line) has sharper edges with respect to the original image (solid red line)
Figure 4A shows the comparison of the fat fraction maps obtained with Cartesian IDEAL acquisition and MRF‐based techniques in the phantom experiment. It can be seen that for Cartesian IDEAL, the fat fraction was overestimated in the fat‐free region of the phantom, showing a non‐zero fat fraction value. This effect was reduced in both DIXON MRF (first row) and DBFW MRF (second row).
Figure 4.
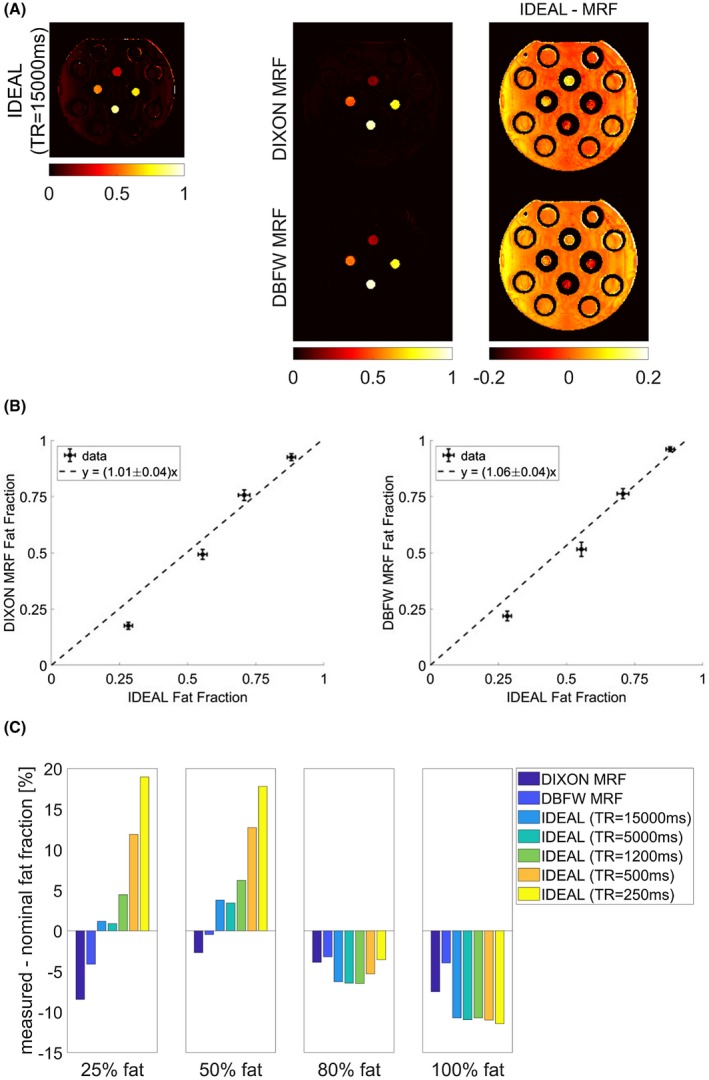
A, Fat fraction maps obtained with reference Cartesian IDEAL acquisition (first column), DIXON MRF and DBFW MRF techniques (second column), and difference between Cartesian and MRF fat fraction maps (third column). B, Left: quantitative comparison between reference and DIXON MRF (y = [1.01 ± 0.04]x); right: quantitative comparison between reference and DBFW MRF (y = [1.06 ± 0.04]x). C, Difference between measured and nominal fat fraction values for each vial and each acquisition (DIXON MRF, DBFW MRF, Cartesian IDEAL with TR = 15,000 ms/5000 ms/1200 ms/500 ms/250 ms)
Overall, there was a good agreement with the reference values both for DIXON MRF and DBFW MRF fat fraction values, as shown in the quantitative comparison of Figure 4B: CCC resulted to be 0.96 for DIXON MRF and 0.97 for DBFW MRF, whereas the results of the total least squares fit were a = 1.01 ± 0.04 for DIXON MRF and a = 1.06 ± 0.04 for DBFW MRF. With respect to Cartesian IDEAL, MRF techniques appeared to slightly underestimate low fat fraction values and overestimate high fat fraction values, however, MRF values were closer to nominal concentrations than Cartesian IDEAL values (see Figure 4C).
Figure 4C shows the effect of the T1 bias on fat quantification. As expected,38 IDEAL with short TRs induced overestimation of fat fraction values. It can be seen that the minimum TR for which the Cartesian fat quantification error was comparable to MRF is 1200 ms, corresponding to an acquisition time of 1:41 minutes (compared to 1:03 minutes for DIXON MRF and 16 s for DBFW MRF).
Figure 5A shows the comparison of water (first row) and fat (second row) T1 maps obtained with DBFW MRF and DIXON MRF images in the phantom experiment. As shown by the quantitative comparison of Figure 5B, there was an excellent agreement between the water T1 values obtained with the 2 techniques (CCC = 0.99; total least squares: a = 1.00 ± 0.02), whereas there was a systematic underestimation of the fat T1 values obtained with DBFW MRF with respect to DIXON MRF, resulting in a poor agreement (CCC = 0.24; total least square: ). In addition, the measured values for pure species were in good agreement with the corresponding values obtained with gold standard IR‐SE T1 mapping for both DIXON and DBFW MRF (Supporting Information Figure S4): CCC was 0.98 for both DIXON MRF and DBFW MRF, whereas total least squares fit result were for DIXON MRF and for DBFW MRF.
Figure 5.
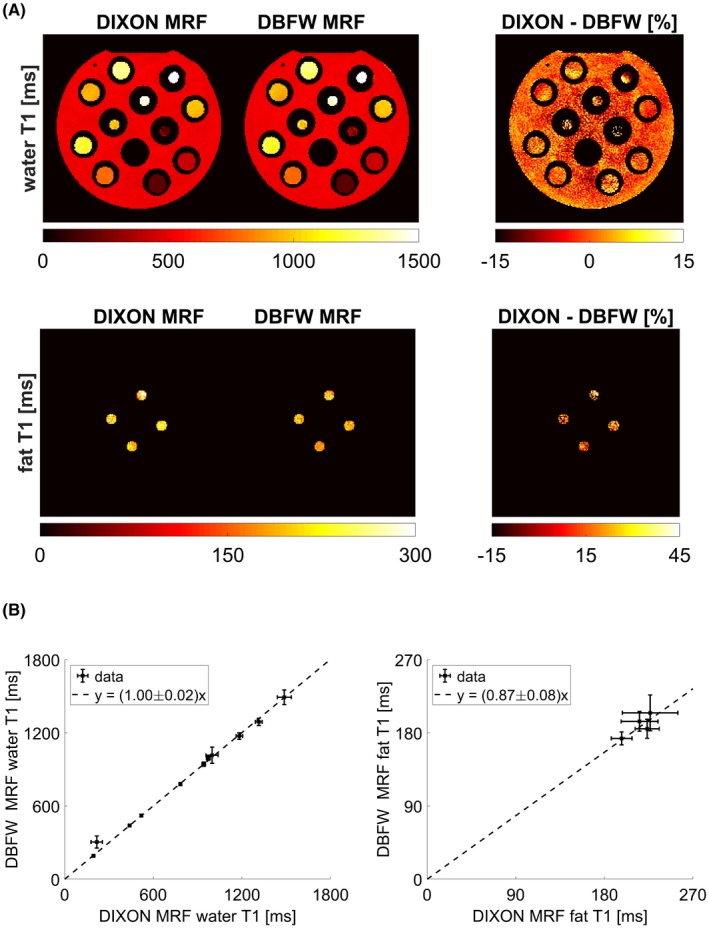
A, Maps of water T1 (first row) and fat T1 (second row) obtained with both DIXON MRF, DBFW MRF, and corresponding percentage differences (with respect to DIXON MRF) for the in vitro experiment. B, Quantitative comparison between DIXON MRF and DBFW MRF water T1 values (y = [1.00 ± 0.02]x) and fat T1 values (y = [0.87 ± 0.08]x) for the in vitro experiment
Although the technique was robust for a wide range of T1 values and field inhomogeneities, as shown in Figure 6, it can be seen that fat–water swap may occur in presence of high field inhomogeneities, especially for pure fat (vial 6; T1 = 197 ± 8 ms) and for short T1 water substances (vial 7; T1 = 190 ± 11 ms).
Figure 6.
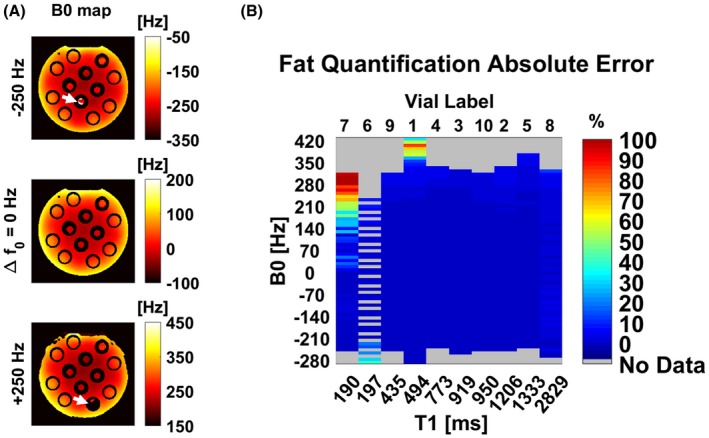
A, DBFW MRF B0 maps for different central frequencies set on the scanner. White arrows mark fat–water swap errors. B, Absolute error of the DBFW MRF fat fraction values with respect to ground truth as a function of B0 and T1. The technique may fail in presence of high field inhomogeneities for species with a T1 similar to fat T1 (vial 6, pure fat; vial 7, fat‐free gel)
3.3. In vivo experiment
Quantitative maps of fat fraction, B1+, B0 (Figure 7), water T1, and fat T1 (Figure 8) were successfully obtained in vivo using both DIXON MRF and DBFW MRF. Figure 7 shows good agreement between IDEAL and MRF fat fraction as well as between DAM and MRF B1+ maps. Both MRF techniques appeared to slightly overestimate B0 values, the amount of overestimation being more prominent in presence of fat. Both MRF techniques showed quantification errors near the fat water boundaries in the fat map; in addition, such errors were visible in the B0 map for DBFW MRF. Figure 8 shows the water T1 (first row) and fat T1 (second row) maps obtained with DIXON MRF and DBFW MRF. DBFW MRF water T1 maps were in good agreement with DIXON MRF except for the fat–water boundaries and the regions mostly composed of fat (such as yellow bone marrow), whereas DBFW MRF fat T1 values appeared to be underestimated as previously shown in the in vitro experiment. The average fat fraction, water–fat T1, B0, and B1+ values in the representative manually drawn ROIs were reported in Table 1. It can be seen that the variance of T1 values for a given component increase when its concentration is low (e.g., water T1 in infrapatellar region and marrow fat).
Figure 7.
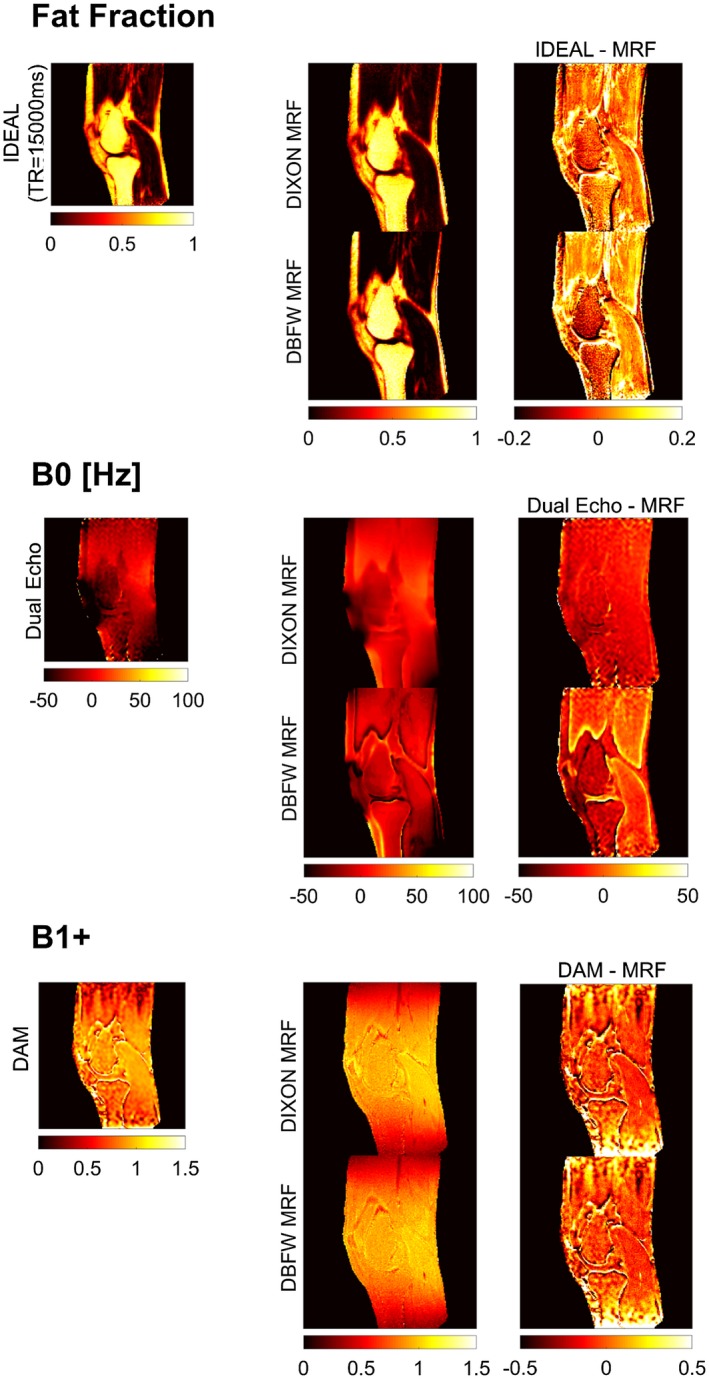
Fat fraction, B0, and B1+ maps obtained with reference Cartesian acquisitions, respectively, IDEAL, dual echo, and DAM (first column), DIXON MRF and DBFW MRF techniques (second column), and difference between Cartesian and MRF maps (third column)
Figure 8.
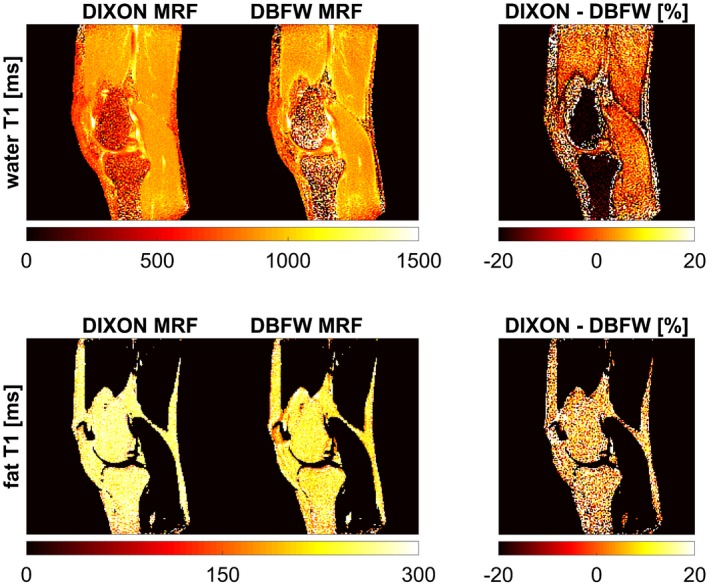
Maps of water T1 (first row) and fat T1 (second row) obtained with both DIXON MRF and DBFW MRF and corresponding percentage differences (with respect to DIXON MRF) for the in vivo experiment
Table 1.
Quantitative comparison of the values within 3 representative regions between reference Cartesian techniques and MRF techniques
| Muscle (a) | Infrapatellar (b) | Marrow fat (c) | |
|---|---|---|---|
| Fat fraction (IDEAL) | 0.07 ± 0.05 | 0.66 ± 0.05 | 0.81 ± 0.03 |
| Fat fraction (DIXON MRF) | 0.06 ± 0.04 | 0.68 ± 0.11 | 0.76 ± 0.07 |
| Fat fraction (DBFW MRF) | 0.04 ± 0.05 | 0.68 ± 0.13 | 0.80 ± 0.09 |
| B0 (dual echo) [Hz] | −1 ± 4 | −55 ± 6 | −22 ± 11 |
| B0 (DIXON MRF) [Hz] | 15 ± 3 | −30 ± 7 | −2 ± 5 |
| B0 (DBFW MRF) [Hz] | −1 ± 5 | −23 ± 5 | 0 ± 9 |
| B1+ (DAM) | 0.95 ± 0.03 | 0.83 ± 0.22 | 0.79 ± 0.25 |
| B1+ (DIXON MRF) | 1.03 ± 0.04 | 0.90 ± 0.06 | 0.86 ± 0.07 |
| B1+ (DBFW MRF) | 1.02 ± 0.05 | 0.89 ± 0.07 | 0.85 ± 0.07 |
| Water T1 (DIXON MRF) [ms] | 914 ± 33 | 780 ± 190 | 650 ± 210 |
| Water T1 (DBFW MRF) [ms] | 937 ± 50 | 740 ± 300 | 900 ± 530 |
| Fat T1 (DIXON MRF) [ms] | 231 ± 67 | 263 ± 25 | 262 ± 29 |
| Fat T1 (DBFW MRF) [ms] | 197 ± 63 | 240 ± 28 | 238 ± 33 |
3.4. Evaluation of fat‐water boundaries
Figure 9 shows the results of the in silico experiment. Quantification errors occurred within the fat–water boundaries whereas the quantification was correct within 2 different water‐only tissues. Hence, the quantification error near boundaries in the in vivo experiment may be caused by the fat blurring. DIXON MRF was not affected by such error, because the fat signal cancels out in the water‐only signal evolutions.
Figure 9.
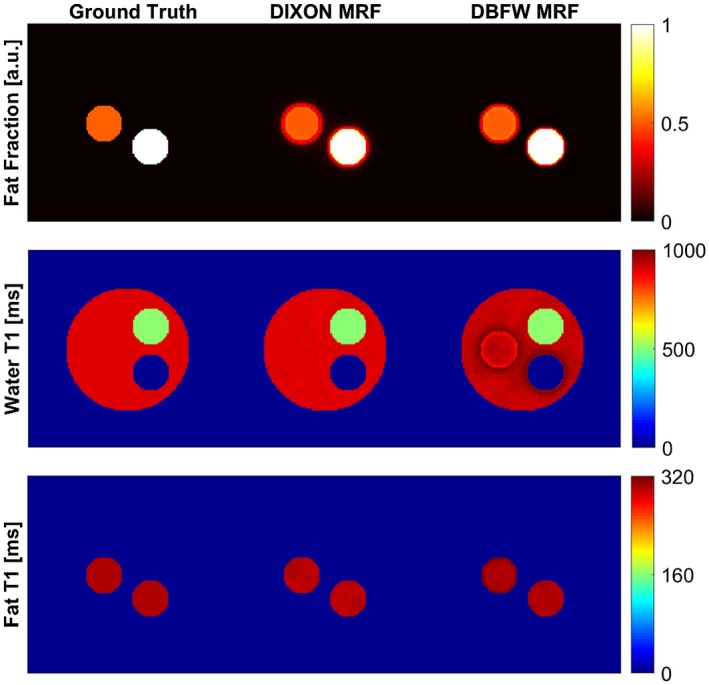
Results of the in silico experiment to evaluate the effect of blurring in fat–water boundaries. It can be seen that for DBFW MRF the fat blurring leads to inconsistencies in these regions, whereas the DIXON MRF is more accurate
4. DISCUSSION
The DBFW MRF method represents an efficient fat–water separation technique within an MRF framework. This technique successfully provided fat fraction, B0 and water T1 maps both in vitro and in vivo with a reasonable scan time. The B0 maps allowed deblurring of the acquired frames, which led to sharper edges according to Figure 2. Although the technique was not specifically optimized for B1+ estimation, the results show a reasonable agreement with the double angle method B1+ map; this consistency of the B1+ map suggests the potential extension of the method to higher field strengths.18, 39 We observed a mismatch of fat T1 (~13%) and B0 maps, however, this mismatch did not affect the accuracy of the fat fraction and water T1 maps, which are the parameters of clinical interest.
Importantly, the framework described and demonstrated here used a multi‐component model. In our formulation, we assumed that not only single tissue parameters, but also their possible combinations were uniquely represented by their signal evolution. Here, we based our acquisition on the most common fat separation methods available, combining a Dixon approach with a fat saturation approach. To evaluate the separability of the different parameters, we used Cramer‐Rao Bound estimations. We found that DBFW MRF technique can provide reliable fat fraction, B0, B1+ values, and water–fat T1 values for water–fat fraction values higher than ~25%.
More rigorous validation of the separability of multiple components was beyond of the scope of the current work, but such calculation may be useful not only to warrant accuracy, but also to optimize the framework to achieve highest orthogonality between compartments. Our multi‐component model could be extended to other biologically relevant problems, such as tissue segmentations, myelin mapping, perfusion models including blood, synovial fluid, or cerebrospinal fluid estimations. Such approaches have great clinical potential; recent accounts have explored the intravoxel quantification capability of MRF both using statistical estimations40 and dictionary‐based approaches.41, 42, 43
Here, we validated our dictionary‐based estimations (DBFW MRF) and DIXON MRF methods against Cartesian IDEAL, which is very well established in the literature.34, 44, 45, 46, 47, 48 Conventionally acquired fast Dixon approaches, such as IDEAL, efficiently separate fat and water signal but can introduce a bias in the quantification of the fat fraction at short TRs and high flip angles because of the different T1 of fat and water.38 By simultaneously estimating T1 and fat fraction, the methods demonstrated use a short TR and arbitrary flip angles for an increased acquisition efficiency, yet intrinsically accounting for and minimizing the T1 bias. Fast and accurate, purely PD‐weighted fat fraction estimations can have a great impact in many diseases and anatomic districts, especially if the acquisition time remains within a single breath‐hold.49
Spiral images can display severe blurring if B0 inhomogeneities are not accounted for in the reconstruction, affecting the quality of the quantitative images.21 As shown by Xie et al.50 the phase cancellations because of off‐resonance mean that the convergence of the B0 map is nearly independent of the rest of the tissue parameters such as T1 and T2. Hence, we adapted the 2‐step reconstruction previously introduced by Ye et al.22 extracting the B0 map directly from the MRF data as a first step and using the B0 map to deblur each frame. However, this approach only corrects for the main field inhomogeneities, being unable to account for fat chemical shift in mixed fat–water voxels. As a result, the fat signal still suffers from displacement in all directions (in non‐Cartesian sampling readouts such as the one used in the present study). In DIXON MRF, this blurring affects only the fat fraction map, because the water and fat T1 maps are obtained separately from the pure water and pure fat signal evolutions. On the contrary, in DBFW MRF, all the parameters are estimated at once without separating the signals from the 2 species, generating inconsistencies near the boundaries in all parametric maps. This was a specific limitation of our DBFW MRF estimations that could be avoided using DIXON MRF acquisitions with constant TEs, at expense of scan time.
A main limitation of the DBFW MRF technique is the fat fraction quantification error in presence of severe static field inhomogeneities. This would affect the measurements performed in anatomic districts with high susceptibility‐induced field variations such as the abdomen.51 In these situations, off‐resonance maps obtained with a separate acquisition could be used to rewind the field‐induced phase variations before applying DBFW MRF. Another potential issue with our method is the large dictionary size, which limits the resolution of the technique. In presence of homogeneous RF field, this problem could be mitigated by using a fixed B1+ scale factor in the simulation. In other situations, it would be possible to use external B1+ maps as previously done in several MRF studies.19, 52
Further improvements to the technique could be given by the use of a different TE pattern to enhance T2 * separability, as shown by Rieger et al.53 to obtain quantitative T2 * maps and the introduction of acquisition segments with fixed TE and without RF spoiling to re‐introduce T2 estimation to further improve the clinical value of the technique. Moreover, the technique could find benefits from the implementation of more advanced reconstruction algorithms,54, 55, 56 potentially allowing reduction of the scan time and improving the comfort of the patient.
5. CONCLUSIONS
The techniques demonstrated here can be used for fast and quantitative musculoskeletal imaging. A fat fraction map, off‐resonance map, B1+ map, as well as T1 of both fat and water can be measured simultaneously within a short acquisition. Acquisition time of DBFW MRF was 4× faster compared to the corresponding 3‐echoes DIXON MRF acquisition. Moreover, both the MRF techniques here demonstrated can be used for a fast estimate of a purely PD‐weighted fat fraction, intrinsically correcting for the T1 biases seen when accelerating conventional Dixon methods.
CONFLICT OF INTEREST
Dr. Rolf Schulte is a GE Healthcare employee.
Supporting information
FIGURE S1 (A) Spoiling efficiency for exemplary signal evolutions (water, fat, 50% water/50% fat). Flip angle and phase lists were as described in the Methods section for DBFW MRF acquisition. The first row shows the signal evolution for fixed TE/TR = 1.8 ms/9 ms: water T1/off‐resonance were set to 900 ms/0 Hz whereas fat T1/off‐resonance were set to 300 ms/220 Hz. The second row shows the signal evolution in response to the variable TE/TR of the DBFW MRF technique. The simulations included realistic T2 from 10 ms to 200 ms (step size: 10 ms) and T2 * from 10 ms to 50 ms (step size: 5 ms). For comparison, signal evolution with T2 * = ∞ and perfect spoiling (i.e., magnetization set to 0 at the end of each TR) are reported. It can be seen that the signals are weakly dependent on transverse relaxation times, and the “real spoil” evolutions are in reasonable agreement with the “perfect spoil” ones. It can also be noted that the introduction of the variable TE sensitizes the signal to off‐resonance frequency, visible especially in the plot of the signal phase. (B) For comparison, signal evolution for SSFP‐MRF with the same flip angle pattern as DBFW MRF, fixed TE/TR = 1.8/9 ms, and alternating RF phase = 0°,180° is reported. It can be seen that the dependence from transverse decay rate is much higher than in the spoiled case (tissue parameters for water and fat are the same as the SPGR‐MRF case)
FIGURE S2 Left: gradient waveforms used for both DIXON MRF and DBFW acquisitions. Maximum gradient amplitude was 30 mT/m, whereas the sampling time was 4 µs, leading to a readout time of 2.9 ms/interleave. Right: first and second interleaves of the corresponding k‐space trajectory, which was a variable density spiral with 89 interleaves and 728 points/interleave. Each time frame was sampled using a single spiral interleave
FIGURE S3 Phantom for the in vitro experiment (green, fat‐free tubes, see Supporting Information Table S2 for T1/T2 values; red, fat–water mixtures, see Supporting Information Table S3 for fat fraction values), knee joint of a human volunteer (red lines mark the 3 representative ROIs: [a] muscle, [b] infrapatellar region, and [c] bone marrow) and test object for the in silico experiment with the following parameters: α, pure water with T1/T2 * = 900/30 ms; β, pure water with T1/T2 * = 500/30 ms; γ, 50% water–fat mixture with water T1/T2 * = 900/30 ms and fat T1/T2 * = 300/30 ms; δ, pure fat with T1/T2 * = 300/30 ms. B0 was set to 0 and B1+ was set to 1 for this simulation
FIGURE S4 Comparison of DIXON MRF and DBFW MRF T1 estimation for water and fat with gold standard inversion recovery spin echo (IR‐SE) T1 mapping (matrix = 128 × 128, FA = 90°, TE/TR = 9 ms/7500 ms, inversion time = 50/220/400/1100/2500 ms, total acquisition time: ~1.5 h). Only pure substances were used for this analysis. It appears that both DIXON MRF and DBFW MRF are in good agreement with IR‐SE (CCC = 0.98 for both DIXON MRF and DBFW MRF), except for the extremely long T1 species (pure water, vial 8) for which IR‐SE estimate suffers from low precision. Please note that for DBFW MRF there was a fat‐water swap for vial 7 (red mark), which was incorrectly classified as pure fat
TABLE S1 Values used for the creation of the dictionaries (min:step:max). Dictionary 1: step 1 DBFW; Dictionary 2: step 2 DBFW; Dictionary 3: DIXON MRF
TABLE S2 Nominal values for the tube gel (in green in Supporting Information Figure S1)
TABLE S3 Nominal fat fraction values for fat–water mixtures (in red in Supporting Information Figure S1). The other vials have fat fraction = 0
ACKNOWLEDGMENTS
Funding from INFN CNSV and from the European Commission under Grant Agreement Number 656937.
Cencini M, Biagi L, Kaggie JD, Schulte RF, Tosetti M, Buonincontri G. Magnetic resonance fingerprinting with dictionary‐based fat and water separation (DBFW MRF): A multi‐component approach. Magn Reson Med. 2019;81:3032–3045. 10.1002/mrm.27628
Funding information
INFN CNSV; European Commission, Grant/Award Number: 656937.
REFERENCES
- 1. Pezeshk P, Alian A, Chhabra A. Role of chemical shift and Dixon based techniques in musculoskeletal MR imaging. Eur J Radiol. 2017;94:93–100. [DOI] [PubMed] [Google Scholar]
- 2. Babcock EE, Brateman L, Weinreb JC, Horner SD, Nunnally RL. Edge artifacts in MR images: chemical shift effect. J Comput Assist Tomogr. 1985;9:252–257. [DOI] [PubMed] [Google Scholar]
- 3. Noll DC, Pauly JM, Meyer CH, Nishimura DG, Macovskj A. Deblurring for non‐2D Fourier transform magnetic resonance imaging. Magn Reson Med. 1992;25:319–333. [DOI] [PubMed] [Google Scholar]
- 4. Frahm J, Haase A, Hänicke W, Matthaei D, Bomsdorf H, Helzel T. Chemical shift selective MR imaging using a whole‐body magnet. Radiology. 1985;156:441–444. [DOI] [PubMed] [Google Scholar]
- 5. Meyer CH, Pauly JM, Macovskiand A, Nishimura DG. Simultaneous spatial and spectral selective excitation. Magn Reson Med. 1990;15:287–304. [DOI] [PubMed] [Google Scholar]
- 6. Bydder GM, Young IR. MR imaging: clinical use of the inversion recovery sequence. J Comput Assist Tomogr. 1985;9:659–675. [PubMed] [Google Scholar]
- 7. Dixon WT. Simple proton spectroscopic imaging. Radiology. 1984;153:189–194. [DOI] [PubMed] [Google Scholar]
- 8. Delfaut EM, Beltran J, Johnson G, Rousseau J, Marchandise X, Cotten A. Fat suppression in MR imaging: techniques and pitfalls. Radiographics. 1999;19:373–382. [DOI] [PubMed] [Google Scholar]
- 9. Reeder SB, Cruite I, Hamilton G, Sirlin CB. Quantitative assessment of liver fat with magnetic resonance imaging and spectroscopy. J Magn Reson Imaging. 2011;34:729–749. [DOI] [PMC free article] [PubMed] [Google Scholar]
- 10. Kellman P, Hernando D, Arai AE. Myocardial fat imaging. Curr Cardiovasc Imaging Rep. 2010;3:83–91. [DOI] [PMC free article] [PubMed] [Google Scholar]
- 11. Karampinos DC, Melkus G, Baum T, Bauer JS, Rummeny EJ, Krug R. Bone marrow fat quantification in the presence of trabecular bone: initial comparison between water‐fat imaging and single‐voxel MRS. Magn Reson Med. 2014;71:1158–1165. [DOI] [PMC free article] [PubMed] [Google Scholar]
- 12. Reeder SB, Sirlin CB. Quantification of liver fat with magnetic resonance imaging. Magn Reson Imaging Clin N Am. 2010;18:337–357. [DOI] [PMC free article] [PubMed] [Google Scholar]
- 13. Kühn JP, Jahn C, Hernando D, et al. T1 bias in chemical shift‐encoded liver fat‐fraction: role of the flip angle. J Magn Reson Imaging. 2014;40:875–883. [DOI] [PMC free article] [PubMed] [Google Scholar]
- 14. Ma D, Gulani V, Seiberlich N, et al. Magnetic resonance fingerprinting. Nature. 2013;495:187–192. [DOI] [PMC free article] [PubMed] [Google Scholar]
- 15. Jiang Y, Ma D, Seiberlich N, Gulani V, Griswold MA. MR fingerprinting using fast imaging with steady state precession (FISP) with spiral readout. Magn Reson Med. 2015;74:1621–1631. [DOI] [PMC free article] [PubMed] [Google Scholar]
- 16. Brown RW, Cheng YCN, Haacke EM, Thompson MR, Venkatesan R. Magnetic resonance imaging : physical properties and sequence design. New York: Wiley & Sons; 2014. 1008 p. [Google Scholar]
- 17. Weigel M. Extended phase graphs: dephasing, RF pulses, and echoes ‐ pure and simple. J Magn Reson Imaging. 2015;41:266–295. [DOI] [PubMed] [Google Scholar]
- 18. Buonincontri G, Sawiak SJ. MR fingerprinting with simultaneous B1 estimation. Magn Reson Med. 2016;76:1127–1135. [DOI] [PMC free article] [PubMed] [Google Scholar]
- 19. Ma D, Coppo S, Chen Y, et al. Slice profile and B1 corrections in 2D magnetic resonance fingerprinting. Magn Reson Med. 2017;78:1781–1789. [DOI] [PMC free article] [PubMed] [Google Scholar]
- 20. McGivney DF, Pierre E, Ma D, et al. SVD compression for magnetic resonance fingerprinting in the time domain. IEEE Trans Med Imaging. 2014;33:2311–2322. [DOI] [PMC free article] [PubMed] [Google Scholar]
- 21. Ostenson J, Robison RK, Zwart NR, Welch EB. Multi‐frequency interpolation in spiral magnetic resonance fingerprinting for correction of off‐resonance blurring. Magn Reson Imaging. 2017;41:63–72. [DOI] [PMC free article] [PubMed] [Google Scholar]
- 22. Ye H, Ma D, Jiang Y, et al. Accelerating magnetic resonance fingerprinting (MRF) using t‐blipped simultaneous multislice (SMS) acquisition. Magn Reson Med. 2016;75:2078–2085. [DOI] [PMC free article] [PubMed] [Google Scholar]
- 23. Windischberger C, Robinson S, Rauscher A, Barth M, Moser E. Robust field map generation using a triple‐echo acquisition. J Magn Reson Imaging. 2004;20:730–734. [DOI] [PubMed] [Google Scholar]
- 24. Maeda A, Sano K, Yokoyama T. Reconstruction by weighted correlation for MRI with time‐varying gradients. IEEE Trans Med Imaging. 1988;7:26–31. [DOI] [PubMed] [Google Scholar]
- 25. Fessler JA, Sutton BP. Nonuniform fast Fourier transforms using min‐max interpolation. IEEE Trans Signal Process. 2003;51:560–574. [Google Scholar]
- 26. Walsh DO, Gmitro AF, Marcellin MW. Adaptive reconstruction of phased array MR imagery. Magn Reson Med. 2000;43:682–690. [DOI] [PubMed] [Google Scholar]
- 27. Zhao B, Haldar JP, Setsompop K, Wald LL. Optimal experiment design for magnetic resonance fingerprinting. In Proceedings of the 38th Annual International Conference of the IEEE Engineering in Medicine and Biology Society (EMBC), Orlando, FL, 2016. p. 453‐456. [DOI] [PMC free article] [PubMed]
- 28. Assländer J, Lattanzi R, Sodickson DK, Cloos MA.Relaxation in spherical coordinates: analysis and optimization of pseudo‐SSFP based MR‐fingerprinting. 2017;arXiv preprint arXiv:1703.00481v2.
- 29. Buonincontri G, Methner C, Krieg T, Carpenter TA, Sawiak SJ. Trajectory correction for free‐breathing radial cine MRI. Magn Reson Imaging. 2014;32:961–964. [DOI] [PubMed] [Google Scholar]
- 30. Xiang QS, An L. Water‐fat imaging with direct phase encoding. J Magn Reson Imaging. 7:1002–1015. [DOI] [PubMed] [Google Scholar]
- 31. Goldstein RM, Zebker HA, Werner CL. Satellite radar interferometry: two‐dimensional phase unwrapping. Radio Sci. 1988;23:713–720. [Google Scholar]
- 32. Ghiglia DC, Pritt MD. Two‐dimensional phase unwrapping : theory, algorithms, and software. New York; Wiley; 1998. 512 p. [Google Scholar]
- 33. Cloos MA, Knoll F, Zhao T, et al. Multiparametric imaging with heterogeneous radiofrequency fields. Nat Commun. 2016;7:12445. [DOI] [PMC free article] [PubMed] [Google Scholar]
- 34. Reeder SB, Pineda AR, Wen Z, et al. Iterative decomposition of water and fat with echo asymmetry and least‐squares estimation (IDEAL): application with fast spin‐echo imaging. Magn Reson Med. 2005;54:636–644. [DOI] [PubMed] [Google Scholar]
- 35. Jezzard P, Balaban RS. Correction for geometric distortion in echo planar images from B0 field variations. Magn Reson Med. 1995;34:65–73. [DOI] [PubMed] [Google Scholar]
- 36. Insko EK, Bolinger L. Mapping of the radiofrequency field. J Magn Reson Ser A. 1993;103:82–85. [Google Scholar]
- 37. Lin LIK. A concordance correlation coefficient to evaluate reproducibility. Biometrics. 1989;45:255. [PubMed] [Google Scholar]
- 38. Liu CY, McKenzie CA, Yu H, Brittain JH, Reeder SB. Fat quantification with IDEAL gradient echo imaging: correction of bias from T1 and noise. Magn Reson Med. 2007;58:354–364. [DOI] [PubMed] [Google Scholar]
- 39. Buonincontri G, Schulte RF, Cosottini M, Tosetti M. Spiral MR fingerprinting at 7 T with simultaneous B1 estimation. Magn Reson Imaging. 2017;41:1–6. [DOI] [PubMed] [Google Scholar]
- 40. McGivney D, Deshmane A, Jiang Y, et al. Bayesian estimation of multicomponent relaxation parameters in magnetic resonance fingerprinting. Magn Reson Med. 2018;80:159–170. [DOI] [PMC free article] [PubMed] [Google Scholar]
- 41. Hamilton JI, Griswold MA, Seiberlich N. MR Fingerprinting with chemical exchange (MRF‐X) to quantify subvoxel T1 and extracellular volume fraction. J Cardiovasc Magn Reson. 2015;17:W35. [Google Scholar]
- 42. Deshmane A, McGivney D, Badve C, Gulani V, Griswold M.Dictionary approach to partial volume estimation with MR fingerprinting: validation and application to brain tumor segmentation. In Proceedings of the 25th Annual Meeting of ISMRM, Honolulu, HI, 2017. Abstract 0132.
- 43. Su P, Mao D, Liu P, et al. Multiparametric estimation of brain hemodynamics with MR fingerprinting ASL. Magn Reson Med. 2017;78:1812–1823. [DOI] [PMC free article] [PubMed] [Google Scholar]
- 44. Glover GH, Schneider E. Three‐point dixon technique for true water/fat decomposition with B0inhomogeneity correction. Magn Reson Med. 1991;18:371–383. [DOI] [PubMed] [Google Scholar]
- 45. Hardy PA, Hinks RS, Tkach JA. Separation of fat and water in fast spin‐echo MR imaging with the three‐point dixon technique. J Magn Reson Imaging. 1995;5:181–185. [DOI] [PubMed] [Google Scholar]
- 46. Ma J, Singh SK, Kumar AJ, Leeds NE, Broemeling LD. Method for efficient fast spin echo Dixon imaging. Magn Reson Med. 2002;48:1021–1027. [DOI] [PubMed] [Google Scholar]
- 47. Huang TY, Chung HW, Wang FN, Ko CW, Chen CY. Fat and water separation in balanced steady‐state free precession using the dixon method. Magn Reson Med. 2004;51:243–247. [DOI] [PubMed] [Google Scholar]
- 48. Ma J, Jong BS, Zhou Y, Le‐Petross H, Choi H. Fast spin‐echo triple‐echo dixon (fTED) technique for efficient T2‐weighted water and fat imaging. Magn Reson Med. 2007;58:103–109. [DOI] [PubMed] [Google Scholar]
- 49. Hu HH, Börnert P, Hernando D, et al. ISMRM workshop on fat‐water separation: insights, applications and progress in MRI. Magn Reson Med. 2012;68:378–388. [DOI] [PMC free article] [PubMed] [Google Scholar]
- 50. Xie J, Lyu M, Zhang J, Hui ES, Wu EX, Wang Z.Fast dictionary generation and searching for magnetic resonance fingerprinting. In Proceedings of the 39th Annual International Conference of the IEEE Engineering in Medicine and Biology Society (EMBC), Seogwipo, South Korea, 2017. p. 3256–3259. [DOI] [PubMed]
- 51. Yoshimitsu K, Varma DG, Jackson EF. Unsuppressed fat in the right anterior diaphragmatic region on fat‐suppressed T2‐weighted fast spin‐echo MR images. J Magn Reson Imaging. 1995;5:145–149. [DOI] [PubMed] [Google Scholar]
- 52. Chen Y, Jiang Y, Pahwa S, et al. MR fingerprinting for rapid quantitative abdominal imaging. Radiology. 2016;279:278–286. [DOI] [PMC free article] [PubMed] [Google Scholar]
- 53. Rieger B, Zimmer F, Zapp J, Weingärtner S, Schad LR. Magnetic resonance fingerprinting using echo‐planar imaging: joint quantification of T 1 and T2∗ relaxation times. Magn Reson Med. 2017;78:1724–1733. [DOI] [PubMed] [Google Scholar]
- 54. Pierre EY, Ma D, Chen Y, Badve C, Griswold MA. Multiscale reconstruction for MR fingerprinting. Magn Reson Med. 2016;75:2481–2492. [DOI] [PMC free article] [PubMed] [Google Scholar]
- 55. Doneva M, Amthor T, Koken P, Sommer K, Börnert P. Matrix completion‐based reconstruction for undersampled magnetic resonance fingerprinting data. Magn Reson Imaging. 2017;41:41–52. [DOI] [PubMed] [Google Scholar]
- 56. Zhao B, Setsompop K, Adalsteinsson E, et al. Improved magnetic resonance fingerprinting reconstruction with low‐rank and subspace modeling. Magn Reson Med. 2018;79:933–942. [DOI] [PMC free article] [PubMed] [Google Scholar]
Associated Data
This section collects any data citations, data availability statements, or supplementary materials included in this article.
Supplementary Materials
FIGURE S1 (A) Spoiling efficiency for exemplary signal evolutions (water, fat, 50% water/50% fat). Flip angle and phase lists were as described in the Methods section for DBFW MRF acquisition. The first row shows the signal evolution for fixed TE/TR = 1.8 ms/9 ms: water T1/off‐resonance were set to 900 ms/0 Hz whereas fat T1/off‐resonance were set to 300 ms/220 Hz. The second row shows the signal evolution in response to the variable TE/TR of the DBFW MRF technique. The simulations included realistic T2 from 10 ms to 200 ms (step size: 10 ms) and T2 * from 10 ms to 50 ms (step size: 5 ms). For comparison, signal evolution with T2 * = ∞ and perfect spoiling (i.e., magnetization set to 0 at the end of each TR) are reported. It can be seen that the signals are weakly dependent on transverse relaxation times, and the “real spoil” evolutions are in reasonable agreement with the “perfect spoil” ones. It can also be noted that the introduction of the variable TE sensitizes the signal to off‐resonance frequency, visible especially in the plot of the signal phase. (B) For comparison, signal evolution for SSFP‐MRF with the same flip angle pattern as DBFW MRF, fixed TE/TR = 1.8/9 ms, and alternating RF phase = 0°,180° is reported. It can be seen that the dependence from transverse decay rate is much higher than in the spoiled case (tissue parameters for water and fat are the same as the SPGR‐MRF case)
FIGURE S2 Left: gradient waveforms used for both DIXON MRF and DBFW acquisitions. Maximum gradient amplitude was 30 mT/m, whereas the sampling time was 4 µs, leading to a readout time of 2.9 ms/interleave. Right: first and second interleaves of the corresponding k‐space trajectory, which was a variable density spiral with 89 interleaves and 728 points/interleave. Each time frame was sampled using a single spiral interleave
FIGURE S3 Phantom for the in vitro experiment (green, fat‐free tubes, see Supporting Information Table S2 for T1/T2 values; red, fat–water mixtures, see Supporting Information Table S3 for fat fraction values), knee joint of a human volunteer (red lines mark the 3 representative ROIs: [a] muscle, [b] infrapatellar region, and [c] bone marrow) and test object for the in silico experiment with the following parameters: α, pure water with T1/T2 * = 900/30 ms; β, pure water with T1/T2 * = 500/30 ms; γ, 50% water–fat mixture with water T1/T2 * = 900/30 ms and fat T1/T2 * = 300/30 ms; δ, pure fat with T1/T2 * = 300/30 ms. B0 was set to 0 and B1+ was set to 1 for this simulation
FIGURE S4 Comparison of DIXON MRF and DBFW MRF T1 estimation for water and fat with gold standard inversion recovery spin echo (IR‐SE) T1 mapping (matrix = 128 × 128, FA = 90°, TE/TR = 9 ms/7500 ms, inversion time = 50/220/400/1100/2500 ms, total acquisition time: ~1.5 h). Only pure substances were used for this analysis. It appears that both DIXON MRF and DBFW MRF are in good agreement with IR‐SE (CCC = 0.98 for both DIXON MRF and DBFW MRF), except for the extremely long T1 species (pure water, vial 8) for which IR‐SE estimate suffers from low precision. Please note that for DBFW MRF there was a fat‐water swap for vial 7 (red mark), which was incorrectly classified as pure fat
TABLE S1 Values used for the creation of the dictionaries (min:step:max). Dictionary 1: step 1 DBFW; Dictionary 2: step 2 DBFW; Dictionary 3: DIXON MRF
TABLE S2 Nominal values for the tube gel (in green in Supporting Information Figure S1)
TABLE S3 Nominal fat fraction values for fat–water mixtures (in red in Supporting Information Figure S1). The other vials have fat fraction = 0


