

Abstract
Long‐term effects of migalastat therapy in clinical practice are currently unknown. We evaluated migalastat efficacy and biomarker changes in a prospective, single‐center study on 14 patients with Fabry disease (55 ± 14 years; 11 men). After 1 year of open‐label migalastat therapy, patients showed significant changes in alpha‐galactosidase‐A activity (0.06–0.2 nmol/minute/mg protein; P = 0.001), left ventricular myocardial mass index (137–130 g/m2; P = 0.037), and serum creatinine (0.94–1.0 mg/dL; P = 0.021), accounting for deterioration in estimated glomerular filtration rate (87–78 mL/minute/1.73 m2; P = 0.012). The enzymatic increase correlated with myocardial mass reduction (r = −0.546; P = 0.044) but not with renal function (r = −0.086; P = 0.770). Plasma globotriaosylsphingosine was reduced in therapy‐naive patients (10.9–6.0 ng/mL; P = 0.021) and stable (9.6–12.1 ng/mL; P = 0.607) in patients switched from prior enzyme‐replacement therapy. These first real‐world data show that migalastat substantially increases alpha‐galactosidase‐A activity, stabilizes related serum biomarkers, and improves cardiac integrity in male and female patients with amenable Fabry disease mutations.
Study Highlights.
WHAT IS THE CURRENT KNOWLEDGE ON THE TOPIC?
☑ Migalastat is available as Fabry‐specific therapy since 2016. With clinical findings published limited to phase III trials, we still lack experience regarding long‐term effects of migalastat in patients with Fabry disease.
WHAT QUESTION DID THIS STUDY ADDRESS?
☑ Our study analyzes parameter changes and enzymatic responses of patients treated with migalastat after 1 year and evaluates the effects of this new therapeutic approach.
WHAT DOES THIS STUDY ADD TO OUR KNOWLEDGE?
☑ Oral administration of migalastat leads to a significant increase of endogenous enzymatic function and, thus, can replace previous intravenous enzyme replacement therapy, leading to improved quality of life in patients with amenable Fabry disease mutations.
HOW MIGHT THIS CHANGE CLINICAL PHARMACOLOGY OR TRANSLATIONAL SCIENCE?
☑ The general concept of chaperone therapy represents a feasible therapeutic option in other enzymatic diseases.
Fabry disease (FD) is an X‐linked lysosomal storage disorder with multiple organ involvement. A deficiency in the enzyme alpha‐galactosidase (α‐Gal) results in intracellular accumulation of glycosphingolipids.1, 2 Progressive fibrosis in various organs causes neurological dysfunction, myocardial hypertrophy, progressive heart failure, and loss of renal function. Ultimately, patients with FD require dialysis and organ transplantation, and it often results in premature death.3, 4
In 2001, enzyme replacement therapy (ERT) was developed for treating this genetic disease. Long‐term data have shown positive effects on disease progression.5, 6 However, ERT has several drawbacks; for example, it requires intravenous application and inhibitory antibodies develop in some patients, which leads to a poor outcome.7 In 2016, a new therapeutic approach, represented by the chaperone, migalastat, was first approved in Germany, and many European countries rapidly followed suit. Migalastat binds to the active site and stabilizes α‐Gal, which improves substrate catabolism.8, 9, 10, 11 Unfortunately, because migalastat stabilizes the patients’ endogenous α‐Gal, it is not advised for patients with mutations that cause complex enzyme alterations; therefore, migalastat therapy is only feasible for selected patients. The percentage of patients with “amenable mutations” was reported to be between 45% and 60%; however, in a previous study, we found that only 37% of patients in our cohort had amenable mutations.12, 13
Migalastat is administered orally every other day (123 mg). To date, no specific adverse reactions, such as possible antibody formation,14 have been described. Subsequent improvements in quality of life are undetermined because we lack experience regarding long‐term effects in clinical practice. Therefore, precise clinical evaluations of migalastat therapy are required. Our center supervises a large cohort of patients with FD. Here, we described the first prospective, single‐center study in which patients with FD were evaluated after 1 year of therapy with migalastat.
Results
Baseline characteristics
The patient cohort had a mean age of 51.7 ± 14.9 years. Patient characteristics are shown in Tables 1 and 2. A majority of the cohort was male (13/21; 62%), and 29% (6/21) received ERT before switching to migalastat. A nonclassic (late‐onset) mutation was found in 52.4% of patients (11/21; 10 with N215S and 1 with A143T). Fabry‐specific laboratory markers in the 21 patients showed a median enzyme activity of 0.06 (interquartile range (IQR) 0.05–0.24) nmol/minute/mg protein and a median globotriaosylsphingosine (lyso‐Gb3) level of 9.0 ng/mL (IQR 4.3–14.8) at baseline. Renal function was in the physiological range; the median creatinine level was 0.9 mg/dL, and the median glomerular filtration rate (GFR) was 85 mL/minute/1.73 m2. Cardiac biomarkers were elevated; the median highly sensitive troponin (hs‐troponin) T level was 19.8 pg/mL (cutoff value 14 pg/mL)15, and the median N‐terminal pro–brain natriuretic peptide (NT‐ProBNP) level was 365 pg/mL (cutoff value 125 pg/mL).16 The subgroup that received ERT before migalastat initiation (switch group) exhibited higher median values of myocardial mass, troponin, and NT‐ProBNP, compared with the therapy‐naive subgroup (127 g/m2, 48.1 pg/mL, and 622.5 pg/mL vs. 117 g/m2, 16.7 pg/mL, and 365 pg/mL, respectively). The switch group also had better renal function compared with the therapy‐naive group (95.5 vs. 78 mL/minute/1.73 m2). The 1‐year follow‐up was completed by 14 patients, and the mean observation period was 14.1 months.
Table 1.
Characteristics of individual patients with Fabry disease
| ID | α‐Galactosidase mutation | Sex | Age at baseline (years) | Previous therapy | Treatment (months) |
|---|---|---|---|---|---|
| 1 | N215S | M | 53 | Treatment‐naive | 25 |
| 2 | A143T | F | 74 | Treatment‐naive | 24 |
| 3 | N215S | M | 62 | Treatment‐naive | 21 |
| 4 | N215S | M | 56 | Treatment‐naive | 19 |
| 5 | N139S | M | 23 | Switch | 18 |
| 6 | T282I | M | 46 | Switch | 18 |
| 7 | A135V | F | 28 | Treatment‐naive | 17 |
| 8 | K240N | M | 65 | Treatment‐naive | 17 |
| 9 | N215S | M | 63 | Switch | 16 |
| 10 | Q157H | F | 47 | Treatment‐naive | 15 |
| 11 | A135V | F | 54 | Switch | 15 |
| 12 | N215S | M | 56 | Switch | 14 |
| 13 | N215S | M | 50 | Treatment‐naive | 14 |
| 14 | N215S | M | 69 | Switch | 13 |
| 15 | N215S | M | 66 | Treatment‐naive | 13 |
| 16 | A135V | F | 53 | Treatment‐naive | 12 |
| 17 | N215S | F | 56 | Treatment‐naive | 8 |
| 18 | G325S | M | 30 | Treatment‐naive | 6 |
| 19 | G325S | F | 55 | Treatment‐naive | 4 |
| 20 | N215S | M | 20 | Treatment‐naive | 4 |
| 21 | R301Q | F | 52 | Treatment‐naive | 4 |
Table 2.
Summary of baseline clinical characteristics of patients with Fabry disease
| Characteristic | Total (n = 21) | Naive (n = 15) | Switch (n = 6) |
|---|---|---|---|
| Age at baseline (years) | 51.7 ± 14.9 | 51.4 ± 14.9 | 52.2 ± 16.2 |
| Male | 13 (61.9) | 8 (53.3) | 5 (83.3) |
| Late‐onset mutation | 11 (52.4) | 8 (53.3) | 3 (50) |
| α‐Galactosidase activity (nmol/minute/mg protein) | 0.06 (0.05–0.24) | 0.07 (0.05–0.36) | 0.06 (0.03–0.16) |
| Lyso‐Gb3 (ng/mL) | 9.0 (4.3–14.8) | 9.0 (3.4–16.7) | 9.6 (4.8–15.6) |
| Previous Fabry‐specific therapy | 6 (28.6) | 0 (0) | 6 (100) |
| Myocardial mass index (g/m2) | 118 (79.5–154.5) | 117 (78–154) | 127 (86.5–176.5) |
| GFR, CKD‐EPI (mL/minute/1.73 m2) | 85 (75.5–98) | 78 (69–95) | 95.5 (84.3–108) |
| Creatinine (mg/dL) | 0.9 (0.83–1.05) | 0.9 (0.82–1.12) | 0.91 (0.79–0.94) |
| Hs‐Troponin T (pg/mL) | 19.8 (8.05–51.6) | 16.7 (4.9–47.2) | 48.1 (9.5–117.2) |
| NT‐ProBNP (pg/mL) | 365 (67.5–1,057) | 365 (67–955) | 622.5 (124.5–1,655.3) |
| Vitamin D (μg/L) | 24.0 (15.1–28.0, n = 18) | 24.0 (13.9–30.2, n = 14) | 23.7 (20.3–26.3, n = 4) |
Values represent the mean ± SD, the number (%), or the median (interquartile range).
GFR CKD‐EPI, glomerular filtration rate calculated with the chronic kidney disease–epidemiology equation; Hs‐Troponin T, highly sensitive troponin T; Lyso‐Gb3, plasma globotriaosylsphingosine; NT‐ProBNP, N‐terminal pro–brain natriuretic peptide.
Enzyme activity and Lyso‐Gb3
The α‐Gal A activity significantly increased (Table 3) from a median of 0.06 (IQR 0.04–0.12) to 0.2 (IQR 0.06–0.26) nmol/minute/mg protein in the 14 patients who completed the 1‐year follow‐up (P = 0.001). The 11 male patients with completed 1‐year follow‐up showed severely abnormal enzyme activities at 0.05 (IQR 0.03–0.06) nmol/minute/mg protein. The three women in our collective had much higher α‐Gal A activity with a median of 0.16 (IQR 0.10–0.49) nmol/minute/mg protein. We observed similar increases in all subgroups; the “N215S” and “therapy‐naive” subgroups demonstrated the same activity change (n = 8; P = 0.017 and 0.021), and the “previous ERT” group showed a slightly lower increase, from 0.06 (IQR 0.03–0.16) to 0.14 (IQR 0.06–0.25) nmol/minute/mg protein (n = 6; P = 0.016). Lyso‐Gb3 values showed a decreasing trend; median values declined from 10.4 (IQR 6.5–13.8) ng/mL to 6.1 (IQR 4.0–14.7) ng/mL (P = 0.319) in the total patient cohort at the 1‐year follow‐up (n = 14). A significant reduction was observed in the therapy‐naive subgroup, from 10.9 (IQR 7.0–15.7) ng/mL to 6.0 (IQR 4.0–8.1) ng/mL (P = 0.021, n = 8). Figures 1 and 2 show the development over time of enzyme activity and lyso‐Gb3 levels, respectively, in individual patients.
Table 3.
Changes in laboratory data with treatment in patients with Fabry disease
| Parameter | Baseline, median (IQR) | FU 1, median (IQR) | FU 2, median (IQR) | N | P value |
|---|---|---|---|---|---|
| Total group | |||||
| Enzyme activity (nmol/minute/mg protein) | 0.06 (0.04–0.12) | 0.2 (0.06–0.34) | 0.2 (0.06–0.26) | 14 | 0.001 |
| Male | 0.05 (0.03–0.06) | 0.18 (0.06–0.25) | 0.17 (0.06–0.22) | 11 | 0.001 |
| Female | 0.16 (0.10–0.49) | 0.37 (0.20–0.38) | 0.27 (0.25–0.57) | 3 | 0.264 |
| Lyso‐Gb3 (ng/mL) | 10.4 (6.5–13.8) | 8.7 (4.4–12.7) | 6.1 (4.0–14.7) | 14 | 0.319 |
| Male | 9.0 (6.9–12.8) | 7.2 (4.5–12.3) | 6.0 (4.0–9.6) | 11 | 0.148 |
| Female | 11.7 (0.7–21.7) | 11.3 (1.4–14.0) | 14.5 (1.1–15.2) | 3 | 0.717 |
| Myocardial mass index (g/m 2 ) | 137 (86–159) | 112 (71–157.5) | 130 (82–169) | 13 | 0.037 |
| Male | 154 (118–160) | 132 (100–158) | 135 (117–184) | 11 | 0.148 |
| Female | 86 (61–67) | 66 (48–52) | 77 (52–64) | 2 | 0.135 |
| GFR CKD‐EPI (mL/minute/1.73 m2 ) | 87 (75.5–102) | 84 (73.5–95.5) | 78 (71.5–99) | 13 | 0.012 |
| Male | 85 (75–95) | 84 (72–95) | 76 (71–96) | 11 | 0.042 |
| Female | 110 (76–90) | 101 (71–80) | 106 (70–89) | 2 | 0.223 |
| Creatinine (mg/dL) | 0.94 (0.81–1.09) | 0.99 (0.82–1.11) | 1.0 (0.87–1.11) | 13 | 0.021 |
| Male | 0.95 (0.88–1.12) | 1.02 (0.94–1.12) | 1.05 (0.90–1.13) | 11 | 0.075 |
| Female | 0.66 (0.48–0.50) | 0.74 (0.54–0.57) | 0.71 (0.51–0.55) | 2 | 0.223 |
| Hs‐Troponin T (pg/mL) | 42.1 (13–111.1) | 30.3 (14.4–111.5) | 41.4 (13.2–103.8) | 13 | 0.979 |
| Male | 49.1 (16.7–118.7) | 50.1 (18.0–124.4) | 55.4 (19.9–137.7) | 11 | 0.933 |
| Female | 7.9 (3.7–8.2) | 8.7 (3.7–9.3) | 8.7 (3.7–9.4) | 2 | 0.368 |
| NT‐ProBNP (pg/mL) | 790 (111.5–1,830.5) | 729 (86.5–1,842) | 807 (94–1,781.5) | 13 | 0.735 |
| Male | 955 (224–2,181) | 761 (200–1,917) | 1,342 (253–1,865) | 11 | 0.913 |
| Female | 99 (31–117) | 68 (29–73) | 94 (69–71) | 2 | 0.607 |
| Vitamin D (μg/L) | 20.7 (15.1–26.2) | 33.5 (18.1–45.4) | 26.2 (11.1–34.1) | 10 | 0.202 |
| Male | 21.6 (17.1–26.3) | 35.4 (18.0–46.6) | 28.2 (14.0–35.9) | 9 | 0.368 |
| Female | 7.1 | 19.8 | 11.3 | 1 | ‐ |
| Subgroup with previous ERT | |||||
| Enzyme activity (nmol/minute/mg protein) | 0.06 (0.03–0.16) | 0.12 (0.06–0.44) | 0.14 (0.06–0.25) | 6 | 0.016 |
| Lyso‐Gb3 (ng/mL) | 9.6 (4.8–15.6) | 10.8 (4.4–25.1) | 12.1 (4.2–30.9) | 6 | 0.607 |
| Myocardial mass index (g/m2) | 127 (86.5–176.5) | 100.5 (66–169.3) | 126.5 (84–170) | 6 | 0.115 |
| GFR CKD‐EPI (mL/minute/1.73 m2) | 95.5 (84.3–108) | 95 (87.8–96.8) | 95 (88.8–103.3) | 6 | 0.607 |
| Creatinine (mg/dL) | 0.91 (0.79–0.94) | 0.89 (0.79–1.04) | 0.89 (0.82–0.99) | 6 | 0.738 |
| Hs‐Troponin T (pg/mL) | 48.1 (9.5–117.2) | 40.2 (10.5–113.3) | 48.4 (10.6–138) | 6 | 0.200 |
| NT‐ProBNP (pg/mL) | 622.5 (124.5–1,655.3) | 480.5 (82–1,850.8) | 797.5 (90.3–1,600.3) | 6 | 0.846 |
| Vitamin D (μg/L) | 23.7 (20.3–26.3) | 35.7 (32.6–42.1) | 32.1 (21.3–37.6) | 4 | 0.105 |
| Subgroup of therapy‐naive | |||||
| Enzyme activity (nmol/minute/mg protein) | 0.06 (0.04–0.09) | 0.22 (0.18–0.31) | 0.2 (0.09–0.31) | 8 | 0.034 |
| Lyso‐Gb3 (ng/mL) | 10.9 (7.0–15.7) | 7.0 (4.4–11.8) | 6.0 (4.0–8.1) | 8 | 0.021 |
| Myocardial mass index (g/m2) | 154 (82–158) | 148 (73–158) | 130 (70–184) | 7 | 0.180 |
| GFR CKD‐EPI (mL/minute/1.73 m 2 ) | 76 (69–95) | 75 (68–84) | 72 (65–78) | 7 | 0.006 |
| Creatinine (mg/dL) | 1.05 (0.77–1.18) | 1.1 (0.94–1.23) | 1.09 (1.05–1.2) | 7 | 0.008 |
| Hs‐Troponin T (pg/mL) | 27.2 (15–118.7) | 25.9 (16.3–124.4) | 35 (13.8–69.9) | 7 | 0.311 |
| NT‐ProBNP (pg/mL) | 790 (67–2,321) | 729 (75–1,917) | 807 (93–1,865) | 7 | 0.867 |
| Vitamin D (μg/L) | 17.1 (12.6–30.7) | 21.4 (11.9–49.7) | 17.7 (9.5–34.2) | 6 | 0.846 |
| Subgroup with mutation N215S | |||||
| Enzyme activity (nmol/minute/mg protein) | 0.06 (0.05–0.07) | 0.22 (0.09–0.31) | 0.2 (0.1–0.25) | 8 | 0.017 |
| Lyso‐Gb3 (ng/mL) | 7.3 (5.6–11.8) | 6.3 (4.2–10.4) | 5.2 (4.0–8.1) | 8 | 0.093 |
| Myocardial mass index (g/m2) | 156.5 (122.8–182.5) | 140 (103.8–173.8) | 135.5 (120.3–176.5) | 8 | 0.093 |
| GFR CKD‐EPI (mL/minute/1.73 m2) | 83.5 (75.3–89.3) | 81 (72.8–89.3) | 74.5 (71.3–90) | 8 | 0.107 |
| Creatinine (mg/dL) | 0.96 (0.94–1.1) | 1.01 (0.85–1.12) | 1.06 (0.93–1.12) | 8 | 0.159 |
| Hs‐Troponin T (pg/mL) | 51.6 (30.9–148.6) | 60.5 (27–149.4) | 59 (36.6–120.8) | 8 | 0.687 |
| NT‐ProBNP (pg/mL) | 1,250.5 (471.3–2,286) | 1,264 (696.8–1,938.8) | 1,393 (447–2,018) | 8 | 0.325 |
| Vitamin D (μg/L) | 20.2 (15.1–30.5) | 27.3 (11.9–46.2) | 30.1 (9.5–42.6) | 6 | 0.513 |
Statistically significant changes over time are highlighted in bold.ERT, enzyme replacement therapy; FU, follow‐up; GFR CKD‐EPI, glomerular filtration rate, calculated with the chronic kidney disease–epidemiology equation; Hs‐Troponin T, highly sensitive troponin T; IQR, interquartile range; Lyso‐Gb3, plasma globotriaosylsphingosine; NT‐ProBNP, N‐terminal pro–brain natriuretic peptide.
Figure 1.
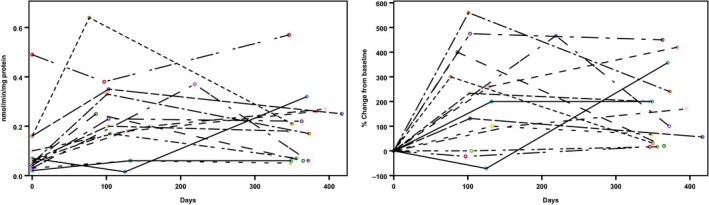
Changes in α‐galactosidase A activity in individual patients (n = 14) during 1 year of migalastat therapy. (Left) Absolute changes from baseline; (right) percentage changes from baseline.
Figure 2.
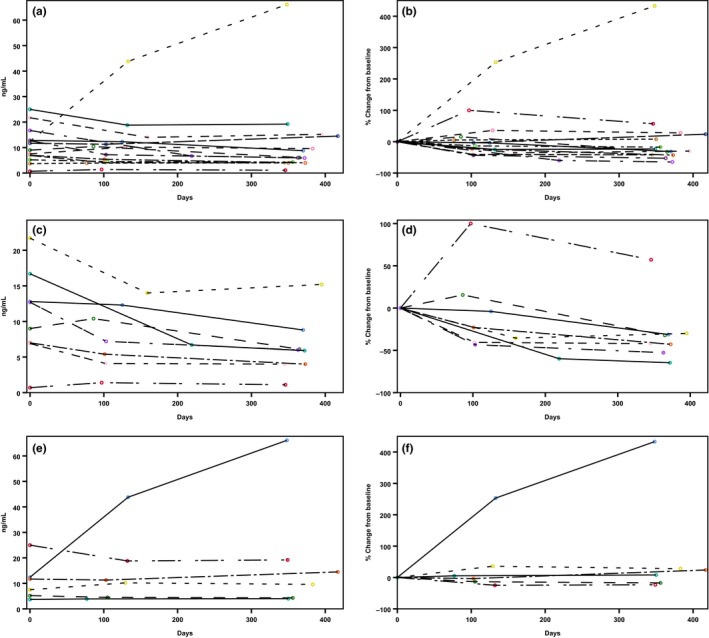
Changes in plasma globotriaosylsphingosine levels in individual patients during 1 year of migalastat therapy. (a,b) All patients who received migalastat (total group; n = 14); (c,d) patients who did not receive Fabry‐specific therapy before migalastat (therapy‐naive group; n = 8). (e,f) Patients who switched from enzyme replacement therapy to migalastat (previous enzyme replacement therapy group; n = 6). (Left panels) Absolute changes from baseline; (right panels) percentage changes from baseline.
Cardiac variables
Myocardial mass significantly dropped in the total group (Table 3), with a reduction from 137 (IQR 86–159) to 130 (IQR 82–169) g/m2 (P = 0.012). A trend for decreased myocardial mass was also observed in all three subgroups, with differences of 0.5, 24, and 21 g/m2. The 1‐year values of the cardiac laboratory parameters, hs‐troponin, and NT‐ProBNP remained stable compared with initial values, in the total group and all subgroups. Interestingly, the 3–6 month follow‐up showed a significant reduction in cardiac laboratory values (Table 3). Figure 3 shows individual data of the myocardial mass index development in all patients.
Figure 3.
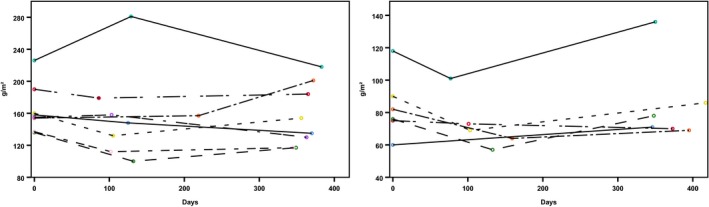
Changes of myocardial mass index in individual patients (n = 14) during 1 year of migalastat therapy. (Left) Patients with moderately severe or severe myocardial hypertrophy; (right) patients with mildly abnormal or normal myocardial hypertrophy.44
Renal function
The creatinine and GFR levels changed significantly in the total group and the therapy‐naive subgroup (Table 3). Creatinine increased from 0.94 (IQR 0.81–1.09) to 1.0 (IQR 0.87–1.11) mg/dL (P = 0.021) in the total group and from 1.05 (IQR 0.77–1.18) to 1.09 (IQR 1.05–1.2) mg/dL (P = 0.008) in the therapy‐naive subgroup. GFR decreased from 87 (IQR 75.5–102) to 78 (IQR 71.5–99) mL/minute/1.73 m2 (P = 0.012) in the total group and from 76 (IQR 69–95) to 72 (IQR 65–78) mL/minute/1.73 m2 (P = 0.006) in the therapy‐naive subgroup. The previous ERT and the N215S genotype groups showed no significant changes in renal function. Creatinine values were 0.91 (IQR 0.79–0.94) vs. 0.89 (IQR 0.82–0.99) mg/dL (P = 0.738) in the previous ERT group and 0.96 (IQR 0.94–1.1) vs. 1.06 (IQR 0.93–1.12) mg/dL (P = 0.159) in the N215S genotype group. GFR was stable at 95.5 (IQR 84.3–108) vs. 95 (IQR 88.8–103.3) mL/minute/1.73 m2 (P = 0.607) in the previous ERT group and 83.5 (IQR 75.3–89.3) vs. 74.5 (IQR 71.3–90) mL/minute/1.73 m2 (P = 0.107) in the N215S genotype group. The 10 patients without vitamin D supplementation (in all four groups) showed a trend for increase in serum vitamin D (Table 3), with variances of 5.5, 8.4, 0.6, and 9.9 μg/L.
Correlations with enzyme activity
We found a negative correlation between α‐Gal activity and myocardial mass index at 1 year (r = −0.546, P = 0.044; Table 4). The linear regression showed that α‐Gal activity significantly influenced myocardial mass (P = 0.046). No other significant correlations were found.
Table 4.
Correlations between biomarker levels and α‐galactosidase activity
| Groups | Parameter | Correlation coefficient (r) | Coefficient of determination (r 2) | P value |
|---|---|---|---|---|
| Total group (N = 14) | Lyso‐Gb3 (ng/mL) | −0.196 | 0.038 | 0.502 |
| Myocardial mass index (g/m 2 ) | −0.546 | 0.298 | 0.044 | |
| GFR CKD‐EPI (mL/minute/1.73 m2) | −0.086 | 0.007 | 0.770 | |
| Creatinine (mg/dL) | 0.033 | 0.001 | 0.911 | |
| hs‐Troponin T (pg/mL) | 0.121 | 0.015 | 0.680 | |
| NT‐ProBNP (pg/mL) | −0.169 | 0.029 | 0.563 | |
| Vitamin D (μg/L), n = 10 | 0.355 | 0.126 | 0.285 | |
| Subgroup with previous ERT (N = 6) | Lyso‐Gb3 (ng/mL) | 0.257 | 0.066 | 0.623 |
| Myocardial mass index (g/m2) | −0.086 | 0.007 | 0.872 | |
| GFR CKD‐EPI (mL/minute/1.73 m2) | −0.086 | 0.007 | 0.872 | |
| Creatinine (mg/dL) | 0.086 | 0.007 | 0.872 | |
| hs‐Troponin T (pg/mL) | −0.371 | 0.138 | 0.468 | |
| NT‐ProBNP (pg/mL) | −0.771 | 0.594 | 0.072 | |
| Vitamin D (μg/L), n = 4 | 0.200 | 0.040 | 0.800 | |
| Subgroup therapy‐naive (N = 8) | Lyso‐Gb3 (ng/mL) | −0.347 | 0.120 | 0.399 |
| Myocardial mass index (g/m 2 ) | −0.738 | 0.545 | 0.037 | |
| GFR CKD‐EPI (mL/minute/1.73 m2) | −0.277 | 0.077 | 0.506 | |
| Creatinine (mg/dL) | 0.071 | 0.005 | 0.867 | |
| hs‐Troponin T (pg/mL) | 0.659 | 0.434 | 0.076 | |
| NT‐ProBNP (pg/mL) | −0.024 | 0.001 | 0.955 | |
| Vitamin D (μg/L), n = 7 | 0.719 | 0.517 | 0.069 | |
| Subgroup with mutation N215S (N = 8) | Lyso‐Gb3 (ng/mL) | −0.323 | 0.104 | 0.435 |
| Myocardial mass index (g/m2) | −0.587 | 0.345 | 0.126 | |
| GFR CKD‐EPI (mL/minute/1.73 m2) | −0.036 | 0.001 | 0.933 | |
| Creatinine (mg/dL) | 0.071 | 0.005 | 0.867 | |
| hs‐Troponin T (pg/mL) | 0.429 | 0.184 | 0.289 | |
| NT‐ProBNP (pg/mL) | 0.286 | 0.082 | 0.493 | |
| Vitamin D (μg/L), n = 6 | 0.657 | 0.432 | 0.156 |
Statistically significant changes over time are highlighted in bold.ERT, enzyme replacement therapy; GFR CKD‐EPI, glomerular filtration rate, calculated with the chronic kidney disease–epidemiology equation; hs‐Troponin T, highly sensitive troponin T; Lyso‐Gb3, plasma globotriaosylsphingosine; NT‐ProBNP, N‐terminal pro–brain natriuretic peptide.
Discussion
Migalastat has a novel mechanism of action for the treatment of FD. Its intracellular distribution was shown to be beneficial,17 and it substantially improved quality of life compared to ERT due to its oral route of administration.18 Nevertheless, because migalastat therapy was first approved in mid‐2016, we lack long‐term experience regarding its effects and outcome. Moreover, although migalastat is only effective for patients with amenable mutations,19 it is currently unclear whether all mutations currently categorized as amenable do, in fact, show a positive response to chaperone therapy. Patients that display a ≥ 1.2‐fold increase in endogenous enzyme activity are deemed amenable to therapy.13 However, to date, no study has validated the level of enzyme activity in patients over time. The present study was the first to provide comprehensive evidence of actual enzyme activity and biomarker responses in patients with FD treated with migalastat in a daily clinical routine.
Fabry‐specific biomarkers
Our findings were consistent with previous studies, which showed that patients with classic FD displayed highly reduced α‐Gal A activity and elevated lyso‐Gb3 levels.20 Our 1‐year follow‐up results confirmed that the significant increase in α‐Gal activity persisted in both male and female patients. The effect was significant especially in the male patient group because of the highly reduced baseline α‐Gal A activity. Nevertheless, despite some fluctuations, after 12 months of therapy, every patient displayed increased enzyme activity compared to baseline (Figure 1). However, that persistence was not consistently observed in lyso‐Gb3—the most important, largely specific biomarker currently used in clinical practice. This finding might reflect some exogenous factors known to impact lyso‐Gb3 values, which might lead to transient alterations in some individuals.21 However, it remains unclear why patient #5 displayed a substantial increase in lyso‐Gb3 after treatment. Of note, although lyso‐Gb3 levels typically decrease after initiating ERT,22 we observed similar median values in therapy‐naive patients and patients who had switched from ERT.
The general trend of a decline we observed in lyso‐Gb3 levels was consistent with recent findings from the migalastat phase III ATTRACT study.11, 23 In our study, lyso‐Gb3 levels significantly declined, followed by stabilization, but one patient who had switched from ERT to migalastat showed a rapid increase in lyso‐Gb3 from baseline (12.4–66.1 ng/mL at the second follow‐up). This subject had started ERT as a child, and before initiating ERT, lyso‐Gb3 was ~ 200 ng/mL. This finding suggests that migalastat cannot stabilize important biomarkers in all patients; the clinical impact of this result needs to be studied further. Figure 2 shows the overall changes in serum lyso‐Gb3 in all patients over 1 year. The therapy‐naive subgroup displayed reductions in lyso‐Gb3 in all eight patients. However, none of the therapy‐naive patients showed lyso‐Gb3 values as high as typically observed in classical male patients with FD.24 Consequently, absolute lyso‐Gb3 reduction is lower and clinical relevance of this finding is not yet fully resolved.
Cardiac biomarkers and myocardial mass index
It remains unclear whether ERT improves cardiac function. Although myocardial hypertrophy might decrease in some patients,25 analyses of cardiac outcomes in a large cohort after 10 years therapy with ERT revealed no significant decline in myocardial mass.26 In contrast, consistent with prior results from randomized trials, our data showed a significant reduction in the myocardial mass index after initiating migalastat therapy. Currently, the mechanism of action remains unclear, and we lack a morphological correlate. Although significant, a reduction of 7 g/m2 is only a minor reduction, which might also be in the range of the echocardiographic measurement error. Furthermore, it should be considered that increasing fibrosis can lead to a thinning of the myocardium and, thus, to a myocardial mass reduction as well. This currently degrades the actual clinical relevance of the value that should be solved by additional examinations in a higher number of patients (including cardiac magnetic resonance imaging and other advanced techniques), which is planned for the medium‐term future. This will allow confirmation of the actual trend of myocardial mass reduction and can increase our understanding of our current clinical findings.27 In the past, both hs‐troponin T and NT‐ProBNP have been described as useful clinical markers for predicting cardiac involvement in patients with FD.28, 29 ERT did not lead to substantial changes in either of these biomarkers. Despite favorable findings regarding myocardial hypertrophy, we found no significant changes in these biomarkers with migalastat therapy, either in the total study group or in any of the subgroups. The temporal reductions we observed in both hs‐troponin T and NT‐ProBNP at the first follow‐up require further evaluation, with longer follow‐up periods. Moreover, more patients might be needed to validate potential positive cardiac effects in terms of biomarker responses.
Renal biomarkers
In the current study, we used creatinine measurements to calculate the estimated GFR over time. It is known that GFR constantly declines in patients with FD.30 Mehta et al.31 observed a mean yearly decline of 2.46−3.58 mL/minute/1.73 m2 with ERT. Compared with those findings, and other studies that described first experiences with migalastat,11, 23 we detected an overall greater reduction in renal function (−9 mL/minute/1.73 m2) in the total cohort after 1 year of migalastat therapy. However, in our study seven patients displayed a baseline estimated GFR > 80 mL/minute/1.73 m2 in which the precision of GFR values remains suboptimal.32 Previous studies have shown that renal stabilization requires longer than 1 year, and GFR can decline in a highly heterogeneous manner.33 In addition, a blockade of the renin‐angiotensin system influences GFR reductions,34 and part of our cohort started migalastat and angiotensin‐converting enzyme inhibition simultaneously. Therefore, to evaluate renal function properly, further follow‐up examinations must be conducted to evaluate the mean yearly GFR loss over longer periods. In the future, a potential approach for increasing therapy efficacy might be to combine migalastat treatment with ERT.
Vitamin D deficiency is associated with cardiomyopathy, and it is a typical clinical symptom in patients with FD.35, 36 Moreover, this deficiency might have been enhanced due to gastrointestinal disturbances, minimum exposure to sun, and osteopenia. Interestingly, with migalastat therapy, we observed a trend in increasing vitamin D levels, but it did not reach statistical significance. This lack of significance might have been primarily due to the small number of patients. Furthermore, more reliable results would require a longer follow‐up due to seasonal concentration changes in the human body.37
Correlation between enzyme activity and organ involvement
Residual enzyme activity can vary widely in FD, depending on the mutation and patient's sex.4, 38, 39, 40, 41, 42 However, Fabry‐specific therapy could not achieve significant changes in residual enzyme activity for longer than several hours. Therefore, it remains unknown whether residual enzyme activity was directly related to improvements in involved organs. In the current study, we found that the reduction in myocardial hypertrophy improved with increasing enzyme activity, based on the negative correlation found between α‐Gal activity and the myocardial mass index (r = −0.546; P = 0.044). With a coefficient of determination of 0.298, nearly 30% of the change could be explained with this statistical model. Moreover, the linear regression analysis showed that enzyme activity had a significant impact on myocardial mass (P = 0.046); indeed, 23.3% of the values could be explained with this regression model.
Study limitations
The main limitations of this study are that it was conducted at a single center, the cohort only comprised 14 patients, and only two follow‐up analyses were conducted after the initiation of migalastat therapy. These factors limit the statistical power of our analyses, which must be considered when judging the validity of all statistical analyses. Therefore, the present findings should be confirmed in the future with multicenter studies that use longer observation periods.
Methods
Study population
This investigation was performed as part of the prospective HEAL‐FABRY study (“Evaluation of HEArt invoLvement in Patients with FABRY Disease,” NCT03362164). That study is conducted to estimate the risks and predictors of heart failure, cardiac arrhythmias, and sudden cardiac death in patients with FD. All study participants presented at the Fabry Center for Interdisciplinary Therapy, Würzburg, with confirmed FD and an indication for Fabry‐specific therapy. Patients who initiated migalastat therapy were eligible for the present study. In total, we included 21 patients between July 2016 and July 2018. Patients were either treatment‐naive (n = 15) or they had switched from a prior ERT regime to prevent further intravenous administration (n = 6). Two patients were switched because of disease progression despite regular ERT. Before switching to migalastat one patient received agalsidase alfa and five patients received agalsidase beta. Every patient was examined according to the standard operating procedures established at our center. For this study, we collected data on the physical examination, comprehensive organ‐specific investigations, demographics, medical records, and laboratory values. Therapy initiation was considered baseline, and follow‐up investigations were planned for 3–6 months (follow‐up one) and 12 months (follow‐up two) after baseline and then once per year. We defined three subgroups: all patients with previous ERT, patients without any Fabry‐specific therapy, and all patients with the mutation N215S.
The study was conducted in accordance with the Declaration of Helsinki. It was approved by the local Ethics Committee at the University of Würzburg. Written informed consent was obtained from all patients.
Diagnosis of Fabry's disease
All subjects had a confirmed FD diagnosis via genetic testing. Mutations were classified as “classic” or “nonclassic” (also called “late‐onset,” with N215S and A143T mutations) based on current knowledge and an expert evaluation.4, 43 The leading indication for initiation of Fabry‐specific therapy in all patients with the N215S mutation was cardiac involvement. The patient with A143T presented with small fiber neuropathic pain and multiple cerebellar infarctions proven by cranial magnetic resonance imaging.
Laboratory data
Two Fabry‐specific serum parameters, α‐Gal enzyme activity in leucocytes (nmol/minute/mg protein) and plasma lyso‐Gb3 (ng/mL) were determined at each time point. Reference values were between 0.4 and 1.0 nmol/minute/mg protein for enzyme activity (reported variance ≤ 5% at triple measurement per sample) and below 0.9 ng/mL for lyso‐Gb3 levels. Renal function was evaluated by measuring creatinine (mg/dL) levels and estimated GFRs (mL/minute/1.73 m2; calculated with the Chronic Kidney Disease Epidemiology Collaboration (CKD‐EPI) equation). Cardiac serum biomarkers included highly sensitive troponin T (hs‐troponin T, pg/mL)29 and NT‐ProBNP (pg/mL). Due to known alterations in patients with FD, we also investigated vitamin D (μg/L) over time in all patients who did not receive supplementary vitamin D.35
Echocardiography
Echocardiographic examinations were performed with a Vivid 7/9e (GE Vingmed, Horten, Norway) at baseline and at each follow‐up. Cardiac analyses were performed with a standardized protocol oriented toward guidelines and special on‐site experience. Analyses and classification of myocardial hypertrophy were conducted offline by a single experienced investigator with EchoPAC and TomTech.44, 45
Statistical analysis
Variables are expressed as the mean ± SD, or alternatively, as the median and IQR. Categorical variables are presented as the count and percentage. Differences in continuous data between groups were evaluated with the Friedman Test for repeated measurements. The Wilcoxon test with descriptive statistics was used to compare two measurements and subgroup variables. Normal distributions were tested with the Kolmogorov‐Smirnov test. Scatterplots were constructed to show values for individual patients. Potential associations were determined with the Spearman Rank Correlation test. Linear regression was used to identify contributing factors. Statistical significance was defined as P < 0.05 (two‐tailed). Statistical analyses were conducted with IBM SPSS version 25 for Windows (IBM, Armonk, NY).
Conclusion
Migalastat therapy led to a rapid, persistent increase in α‐Gal A activity in male and female patients with FD that carried amenable mutations. Over a follow‐up period of 12 months, higher enzyme activity was associated with a trend in reduced lyso‐Gb3 levels and a significant reduction in cardiac hypertrophy. The cardiac serum biomarkers, hs‐troponin and NT‐ProBNP, remained stable during the observation period. Renal function decreased after 1 year of migalastat therapy and in some cases lyso‐Gb3 increased after switching to migalastat therapy. Clinical impact of these observations is yet unclear. Future studies with larger patient numbers are required to confirm and further clarify these findings.
Funding
This project is funded by the Bundesministerium für Bildung und Forschung (BMBF), Grant 01EO1504 MO.2.
Conflict of Interest
J.M., D.G., T.C., D.O., P.N., and C.W. are members of the FAZiT of the University Hospital Würzburg. J.M. received travel assistance from Amicus Therapeutics, Sanofi Genzyme, and Shire. D.O. received travel assistance and speaker honoraria from Sanofi Genzyme and Shire. C.W. received speaker honoraria from Actelion, Protalix, Sanofi Genzyme, and Shire. P.N. received speaker honoraria and research grants from Amicus Therapeutics, Idorsia, Sanofi Genzyme, and Shire.
Author Contributions
J.M. and P.N. wrote the manuscript. J.M., C.W., and P.N. designed the research. J.M., D.G., O.M., D.L., T.C., K.H., and P.N. performed the research. J.M., D.G., D.L., K.H., K.L., C.W., and P.N. analyzed the data. All authors reviewed the manuscript.
Acknowledgments
The authors thank Irina Schumacher and Larissa Buravezky for their long‐standing dedicated work at the Fabry Center for Interdisciplinary Therapy, Würzburg (FAZiT).
References
- 1. Brady, R.O. , Gal, A.E. , Bradley, R.M. , Martensson, E. , Warshaw, A.L. & Laster, L. Enzymatic defect in Fabry's disease. Ceramidetrihexosidase deficiency. N. Engl. J. Med. 276, 1163–1167 (1967). [DOI] [PubMed] [Google Scholar]
- 2. Desnick, R.J. et al Fabry disease, an under‐recognized multisystemic disorder: expert recommendations for diagnosis, management, and enzyme replacement therapy. Ann. Intern. Med. 138, 338–346 (2003). [DOI] [PubMed] [Google Scholar]
- 3. Ortiz, A. et al Nephropathy in males and females with Fabry disease: cross‐sectional description of patients before treatment with enzyme replacement therapy. Nephrol. Dial. Transplant. 23, 1600–1607 (2008). [DOI] [PubMed] [Google Scholar]
- 4. Oder, D. et al α‐Galactosidase A genotype N215S induces a specific cardiac variant of Fabry disease. Circ. Cardiovasc. Genet. 10, pii: e001691 (2017). [DOI] [PubMed] [Google Scholar]
- 5. Eng, C.M. et al Safety and efficacy of recombinant human α‐galactosidase A replacement therapy in Fabry's disease. N. Engl. J. Med. 345, 9–16 (2001). [DOI] [PubMed] [Google Scholar]
- 6. Schiffmann, R. et al Enzyme replacement therapy in Fabry disease: a randomized controlled trial. JAMA 285, 2743–2749 (2001). [DOI] [PubMed] [Google Scholar]
- 7. Lenders, M. et al Impact of immunosuppressive therapy on therapy‐neutralizing antibodies in transplanted patients with Fabry disease. J. Intern. Med. 282, 241–253 (2017). [DOI] [PubMed] [Google Scholar]
- 8. Fan, J.‐Q. , Ishii, S. , Asano, N. & Suzuki, Y. Accelerated transport and maturation of lysosomal α‐galactosidase A in Fabry lymphoblasts by an enzyme inhibitor. Nat. Med. 5, 112 (1999). [DOI] [PubMed] [Google Scholar]
- 9. Benjamin, E. et al The pharmacological chaperone 1‐deoxygalactonojirimycin increases α‐galactosidase A levels in Fabry patient cell lines. J. Inherit. Metab. Dis. 32, 424–440 (2009). [DOI] [PubMed] [Google Scholar]
- 10. Germain, D. & Fan, J. Pharmacological chaperone therapy by active‐site‐specific chaperones in Fabry disease: in vitro and preclinical studies. Int. J. Clin. Pharmacol. Ther. 47, S111–S117 (2009). [PubMed] [Google Scholar]
- 11. Germain, D.P. et al Treatment of Fabry's disease with the pharmacologic chaperone migalastat. N. Engl. J. Med. 375, 545–555 (2016). [DOI] [PubMed] [Google Scholar]
- 12. Wu, X. et al A pharmacogenetic approach to identify mutant forms of α‐galactosidase a that respond to a pharmacological chaperone for Fabry disease. Hum. Mutat. 32, 965–977 (2011). [DOI] [PMC free article] [PubMed] [Google Scholar]
- 13. Benjamin, E.R. et al The validation of pharmacogenetics for the identification of Fabry patients to be treated with migalastat. Genet. Med. 19, 430 (2017). [DOI] [PMC free article] [PubMed] [Google Scholar]
- 14. Lenders, M. , Stypmann, J. , Duning, T. , Schmitz, B. , Brand, S.‐M. & Brand, E. Serum‐mediated inhibition of enzyme replacement therapy in Fabry disease. J. Am. Soc. Nephrol. 27, 256–264 (2016). [DOI] [PMC free article] [PubMed] [Google Scholar]
- 15. Body, R. et al Rapid exclusion of acute myocardial infarction in patients with undetectable troponin using a high‐sensitivity assay. J. Am. Coll. Cardiol. 58, 1332–1339 (2011). [DOI] [PubMed] [Google Scholar]
- 16. Weber, M. & Hamm, C. Role of B‐type natriuretic peptide (BNP) and NT‐proBNP in clinical routine. Heart 92, 843–849 (2006). [DOI] [PMC free article] [PubMed] [Google Scholar]
- 17. Johnson, F.K. , Mudd, P.N. , Bragat, A. , Adera, M. & Boudes, P. Pharmacokinetics and safety of migalastat HCl and effects on agalsidase activity in healthy volunteers. Clin. Pharmacol. Drug Dev. 2, 120–132 (2013). [DOI] [PubMed] [Google Scholar]
- 18. Germain, D.P. et al Safety and pharmacodynamic effects of a pharmacological chaperone on α‐galactosidase A activity and globotriaosylceramide clearance in Fabry disease: report from two phase 2 clinical studies. Orphanet. J. Rare Dis. 7, 91 (2012). [DOI] [PMC free article] [PubMed] [Google Scholar]
- 19. Giugliani, R. et al A phase 2 study of migalastat hydrochloride in females with Fabry disease: selection of population, safety and pharmacodynamic effects. Mol. Genet. Metab. 109, 86–92 (2013). [DOI] [PubMed] [Google Scholar]
- 20. Germain, D.P. Fabry disease. Orphanet. J. Rare Dis. 5, 30 (2010). [DOI] [PMC free article] [PubMed] [Google Scholar]
- 21. Guérard, N. et al Lucerastat, an iminosugar for substrate reduction therapy: tolerability, pharmacodynamics, and pharmacokinetics in patients with Fabry disease on enzyme replacement. Clin. Pharmacol. Ther. 103, 703–711 (2018). [DOI] [PubMed] [Google Scholar]
- 22. Aerts, J.M. et al Elevated globotriaosylsphingosine is a hallmark of Fabry disease. Proc. Natl. Acad. Sci. USA 105, 2812–2817 (2008). [DOI] [PMC free article] [PubMed] [Google Scholar]
- 23. Hughes, D.A. et al Oral pharmacological chaperone migalastat compared with enzyme replacement therapy in Fabry disease: 18‐month results from the randomised phase III ATTRACT study. J. Med. Genet. 54, 288–296 (2017). [DOI] [PMC free article] [PubMed] [Google Scholar]
- 24. Niemann, M. et al Gene mutations versus clinically relevant phenotypes: lyso‐Gb3 defines Fabry disease. Circ. Genom. Precis. Med. 7, 8–16 (2014). [DOI] [PubMed] [Google Scholar]
- 25. Weidemann, F. et al Improvement of cardiac function during enzyme replacement therapy in patients with Fabry disease: a prospective strain rate imaging study. Circulation 108, 1299–1301 (2003). [DOI] [PubMed] [Google Scholar]
- 26. Kampmann, C. , Perrin, A. & Beck, M. Effectiveness of agalsidase alfa enzyme replacement in Fabry disease: cardiac outcomes after 10 years’ treatment. Orphanet. J. Rare Dis. 10, 125 (2015). [DOI] [PMC free article] [PubMed] [Google Scholar]
- 27. Müntze, J. , Salinger, T. , Gensler, D. , Wanner, C. & Nordbeck, P. Treatment of hypertrophic cardiomyopathy caused by cardiospecific variants of Fabry disease with chaperone therapy. Eur. Heart J. 39, 1861–1862 (2018). [DOI] [PMC free article] [PubMed] [Google Scholar]
- 28. Coats, C.J. et al Role of serum N‐terminal pro‐brain natriuretic peptide measurement in diagnosis of cardiac involvement in patients with Anderson‐Fabry disease. Am. J. Cardiol. 111, 111–117 (2013). [DOI] [PubMed] [Google Scholar]
- 29. Seydelmann, N. et al High‐sensitivity troponin: a clinical blood biomarker for staging cardiomyopathy in Fabry disease. J. Am. Heart Assoc. 5, e002839 (2016). [DOI] [PMC free article] [PubMed] [Google Scholar]
- 30. Schiffmann, R. et al Weekly enzyme replacement therapy may slow decline of renal function in patients with Fabry disease who are on long‐term biweekly dosing. J. Am. Soc. Nephrol. 18, 1576–1583 (2007). [DOI] [PMC free article] [PubMed] [Google Scholar]
- 31. Mehta, A. et al Enzyme replacement therapy with agalsidase alfa in patients with Fabry's disease: an analysis of registry data. Lancet 374, 1986–1996 (2009). [DOI] [PubMed] [Google Scholar]
- 32. Levey, A.S. et al A new equation to estimate glomerular filtration rate. Ann. Intern. Med. 150, 604–612 (2009). [DOI] [PMC free article] [PubMed] [Google Scholar]
- 33. Schiffmann, R. et al Fabry disease: progression of nephropathy, and prevalence of cardiac and cerebrovascular events before enzyme replacement therapy. Nephrol. Dial. Transplant. 24, 2102–2111 (2009). [DOI] [PMC free article] [PubMed] [Google Scholar]
- 34. Maschio, G. et al Effect of the angiotensin‐converting–enzyme inhibitor benazepril on the progression of chronic renal insufficiency. N. Engl. J. Med. 334, 939–945 (1996). [DOI] [PubMed] [Google Scholar]
- 35. Drechsler, C. et al Potential role of vitamin D deficiency on Fabry cardiomyopathy. J. Inherit. Metab. Dis. 37, 289–295 (2014). [DOI] [PMC free article] [PubMed] [Google Scholar]
- 36. Germain, D.P. , Benistan, K. , Boutouyrie, P. & Mutschler, C. Osteopenia and osteoporosis: previously unrecognized manifestations of Fabry disease. Clin. Genet. 68, 93–95 (2005). [DOI] [PubMed] [Google Scholar]
- 37. Stamp, T.C.B. & Round, J.M. Seasonal changes in human plasma levels of 25‐hydroxyvitamin D. Nature 247, 563 (1974). [DOI] [PubMed] [Google Scholar]
- 38. MacDermot, K. , Holmes, A. & Miners, A. Anderson‐Fabry disease: clinical manifestations and impact of disease in a cohort of 98 hemizygous males. J. Med. Genet. 38, 750–760 (2001). [DOI] [PMC free article] [PubMed] [Google Scholar]
- 39. Branton, M.H. et al Natural history of Fabry renal disease: influence of α‐galactosidase A activity and genetic mutations on clinical course. Medicine 81, 122–138 (2002). [DOI] [PubMed] [Google Scholar]
- 40. Lukas, J. et al Functional and clinical consequences of novel α‐galactosidase A mutations in Fabry disease. Hum. Mutat. 37, 43–51 (2016). [DOI] [PubMed] [Google Scholar]
- 41. Oder, D. et al Organ manifestations and long‐term outcome of Fabry disease in patients with the GLA haplotype D313Y. BMJ Open 6, e010422 (2016). [DOI] [PMC free article] [PubMed] [Google Scholar]
- 42. Oder, D. et al Clinical impact of the alpha‐galactosidase A gene single nucleotide polymorphism‐10c> t: a single‐center observational study. Medicine 97, e10669 (2018). [DOI] [PMC free article] [PubMed] [Google Scholar]
- 43. Spada, M. et al High incidence of later‐onset Fabry disease revealed by newborn screening. Am. J. Human Genet. 79, 31–40 (2006). [DOI] [PMC free article] [PubMed] [Google Scholar]
- 44. Lang, R.M. et al Recommendations for cardiac chamber quantification by echocardiography in adults: an update from the American Society of Echocardiography and the European Association of Cardiovascular Imaging. Eur. Heart J. Cardiovasc. Imaging 16, 233–271 (2015). [DOI] [PubMed] [Google Scholar]
- 45. Liu, D. et al Value of the CHA2DS2‐VASc score and Fabry‐specific score for predicting new‐onset or recurrent stroke/TIA in Fabry disease patients without atrial fibrillation. Clin. Res. Cardiol. 107, 1111–1121 (2018). [DOI] [PMC free article] [PubMed] [Google Scholar]