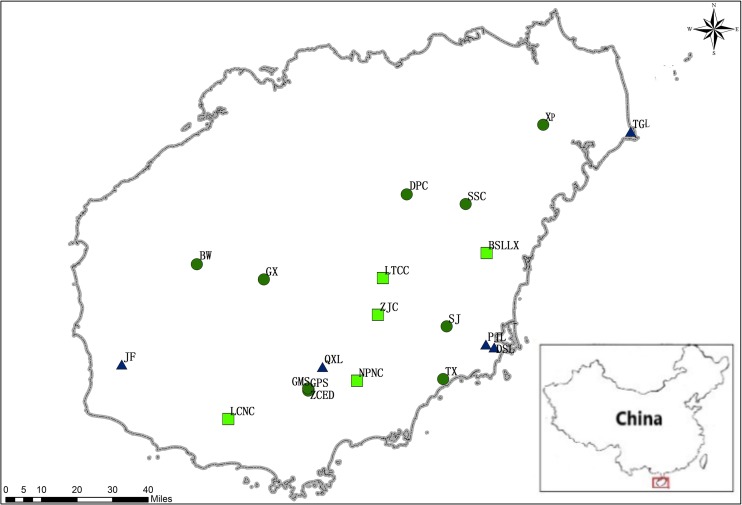
Figure 1. Locations of M. oblongifolius populations sampled in the current study (see Table 1 for explanation of population abbreviations).
Sampled populations from different habitats are marked with different colors: populations along stream banks (dark-green circles), populations along the mountainside (blue triangle), populations found at the foot of the mountain (green square).

