Abstract
Purpose
T2‐weighted lesional imaging is most commonly performed using inversion recovery turbo spin echoes. At 7 T, however, this acquisition is limited for specific absorption rate and resolution. This work describes and implements a method to generate CSF‐suppressed T2‐weighted imaging.
Methods
The strategy uses a driven equilibrium spin‐echo preparation within an inversion recovery with multiple 3D gradient‐echo imaging blocks. Images are combined using the self‐normalization approach, which achieves CSF suppression through optimized timing of individual blocks and minimizes sources of variation due to coil receptivity, T2 *, and proton density. Simulations of the magnetization‐prepared fluid‐attenuated inversion recovery gradient‐echo (MPFLAGRE) method over T1 and T2 relaxation values are performed, and in vivo demonstrations using an 8 2 transceiver array in healthy controls are shown.
Results
The specific absorption rate of the calculated MPFLAGRE sequence is 11.1 ± 0.5 W (n = 5 volunteers), which is 74 ± 2% of the US Food and Drug Administration guidelines. This method acquires both contrasts for CSF suppression with detection of long T2 components and T2‐weighted imaging in a single acquisition. In healthy controls, the former contrast generates increased signal in the cortical rim and ependyma. A comparison is shown with a conventional 3D SPACE fluid‐attenuated inversion recovery acquisition, and sensitivity to pathology is demonstrated in an epilepsy patient.
Conclusion
As applied with the 8 2 transceiver, the MPFLAGRE sequence generates both whole‐brain contrast suitable for lesional and T2‐weighted imaging at 7 T in fewer than 10 minutes within the US Food and Drug Administration's specific absorption rate guidelines.
Keywords: 7T, FLAIR, MP2RAGE, SAR, T2 weighted
1. INTRODUCTION
The increase in SNR at 7 T relative to 3 T has been used by numerous groups for higher‐accuracy physiological and metabolic MRI.1, 2, 3 However, although high‐resolution T1‐weighted structural imaging has been applied quickly,4, 5 T2‐weighted and fluid attenuated inversion recovery (FLAIR) imaging at 7 T has been less implemented—most likely because of the increased power deposition and poor transmit homogeneity due to the need for multiple spin echoes. Parallel transmit arrays have mitigated inhomogeneity problems; for example, RF shimming and a dual‐row transceiver array can achieve 15% SD B1 + over the human brain (Supporting Information Figures S1 and S2).6 However, given the squared dependence of voltage with frequency at 7 T, 7 turbo spin‐echo acquisitions or the use of adiabatic pulses still result in high specific absorption rate (SAR), such that T2‐weighted imaging covering the entire brain in acceptable scan times remains challenging. The variable flip angle turbo spin‐echo sequence provides a reasonable solution to control power deposition; however, it is sensitive to B1 + inhomogeneity,8, 9, 10, 11 with several groups proposing design of parallel transmit pulses as a function of k‐space position to generate more homogeneous excitation and inversion profiles. With this approach for turbo spin echo, however, achieving consistent contrast and motion insensitivity can be problematic by virtue of the dependence on accurate B1 + maps and applied B1 variation between k‐points.8, 12 Alternatively, to altogether avoid multiple refocusing pulses, a driven equilibrium spin‐echo strategy to longitudinally encode T2 contrast (i.e., T2 preparation) has been useful.13, 14, 15 To reduce the sensitivity of the acquisition to B1 + inhomogeneity at 7 T, Dyvorne and Balchandani16 implemented the T2 preparation with an adiabatic spin‐echo module in a multislab approach to generate excellent T2‐weighted whole‐brain coverage at 0.8‐mm3 isotropic resolution (approximate 5.5‐minute acquisition). The FLAIR imaging at 7 T, however, remains challenging.
To suppress the CSF signal, the now commonly used calculated MP2RAGE images from Marques17 provides an insightful T1‐based approach. This self‐correcting normalization combines 2 images acquired at different delays after an inversion to give a calculated signal within the range of [0.5, 0.5]. With a reconstruction in the complex domain (Eq. (1)),17 the calculated signal retains sensitivity to the inversion recovery, while eliminating B0‐based T2 * phase effects and correcting for common factors of M0 and B1 ‐. Inspection of this reconstruction shows that the largest signal (+0.5) is seen when the intensities between the 2 images are equal, and the smallest signal (0.5) when the intensities are equal and inverted in sign. For CSF, the calculated signal returns in the negative range (0.5 to 0), whereas the white matter (WM) and gray matter (GM) return in the positive range (0 to +0.5). In the MP2RAGE acquisition, the sign and timings of the individual imaging readouts are optimized to generate a suppressed CSF intensity of 0.5 and high contrast between WM and GM. The equation of self‐normalization reconstruction is
| (1) |
where S1 and S2 are the GRE signal at inversion recovery delays TI1 and TI2, respectively; and the “*” operator is a complex conjugator.
As discussed by O'Brien,18 the MP2RAGE reconstruction provides a much flatter T1‐weighted image (than the non‐reference‐corrected MPRAGE), which enables high‐consistency gray‐white‐CSF segmentation. More importantly, however, it is recognized that the self‐correcting strategy can be applied to other acquisitions that acquire multiple readout blocks with a common preparation sequence.
In this report we describe the incorporation of a longitudinal T2 preparation module with a multiblock inversion recovery 3D acquisition to achieve a CSF‐suppressed T2‐weighted image for 7T use in the detection of brain pathology. Our preliminary data demonstrate that the proposed sequence MPFLAGRE (magnetization‐prepared fluid attenuated gradient echo) achieves this goal. The sequence uses an inversion recovery with a T2 spin‐echo preparation and multiple short gradient‐echo imaging blocks, with the self‐correcting normalization17 generating the calculated MPFLAGRE image. Cerebrospinal fluid suppression is achieved through appropriate timing of TI for T1 weighting. In this report, we show Bloch simulations to examine the sequence's dependence on T1 and T2 and demonstrate its performance with a transceiver array at 7 T. Because of the longitudinal T2 preparation that is performed with conventional adiabatic refocusing pulses, this sequence efficiently generates whole‐brain T1 and T2‐weighted coverage in single sequence that is well within SAR guidelines.
2. THEORY
2.1. Two‐block sequence (MPFLAGRE‐2)
To generate T2 FLAIR contrast, our method introduces T2 weighting into the T1‐weighted MP2RAGE sequence using a longitudinal T2 encoding module performed after the initial inversion (Figure 1). The T2 weighting is performed with a nonselective spin‐echo module (90x+‐180y ‐180y ‐90x‐ of duration TE) and is followed by multiple short 3D gradient‐echo (readout) blocks. The MPFLAGRE‐2 uses 2 blocks, with the first block performed immediately after the spin echo, block S1. Another signal block, S2, is performed at another timepoint in the T1 recovery, which with increasing delay from the S1 block, reflects primarily T1 weighting. Equations (2) and (3) give the expressions for the signal for the 2‐block sequence:
| (2) |
Figure 1.

Pulse sequence showing the overall sequence (A), T2 spin‐echo module (B), and readout block (C). The MPFLAGRE (magnetization‐prepared fluid‐attenuated inversion recovery gradient‐echo) sequence is able to run with 2, 3, or 4 spoiled gradient blocks. In (C), the readout block is shown either as a centric out (S1) or a linearly (S2) encoded coverage
| (3) |
where ; and ,
where tr is the echo spacing; ε is efficiency of inversion; N is the resolution; ti1 is the delay for block 1; ti2 is the succeeding delay for block 2; teg is the TE for a single gradient echo; Mss is the steady‐state magnetization at the start of each inversion recovery; and M0 is the total available magnetization signal. Inspection of Eqs. (2) and (3) shows that, as expected, S1 is weighted strongly by T2 (center term with ; with a very short ti1, there is minimal T1 recovery). Whereas S2 demonstrates the T1 recovery due to ti2 (center term ), the T2 effect dissipates with increasing ti2. To combine these images, we use the self‐correcting normalization, as described by Marques,17 with the inclusion of sign inversion on the T2‐weighted image S1, to generate the desired tissue orientation (Eq. (3)) as follows:
| (4) |
The normalization from Eq. (4) for the 2 signals gives a high 0.5 value when the 2 input intensities, S1 and S2, are equal and of opposite sign, and a lesser value when the intensities are unequal. Thus, CSF suppression can be achieved through appropriate timing for the S2 block to give a CSF signal intensity that is different from the S1 block. Figure 2 shows Bloch simulations of the 2‐block sequence performed over the T1, T2 parameter space. For comparison, simulation of the MP2RAGE is shown in Figure 2A using timings of ti1/ti2/TR = 0.9/2.6/5 seconds and tip angles of 5° and 9°. As expected from the MP2RAGE, the base images (S1 and S2) and the calculated intensity R1/2 (from Eq. (1)) is primarily dependent on the T1 with minimal T2 dependence (a small dependence results from the finite duration of the adiabatic inversion pulse).
Figure 2.
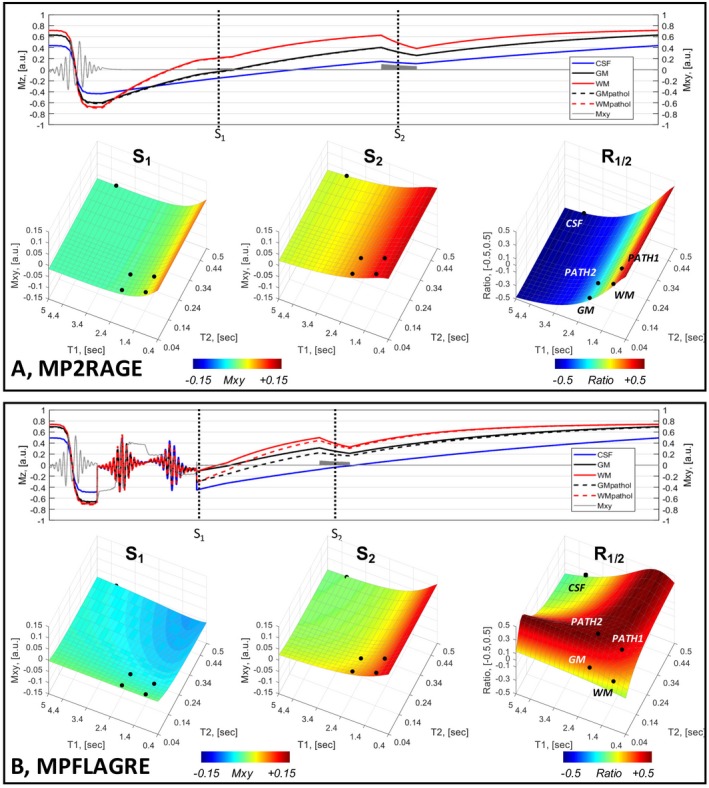
Bloch simulations of a 2‐block acquisition, S1 and S2. A, Using MP2RAGE parameters (i.e., without a T2 spin‐echo preparation). B, MPFLAGRE‐2 sequence with T2 preparation applied early in the inversion recovery. In both (A) and (B), the time course of Iz amplitudes is shown (5 tissue components: blue, CSF; black, gray matter [GM]; red, white matter [WM] with inversion, pathologic T2). Note that the time axis is not linear, with each unit representing a simulation step. The surface plots of the signal amplitudes are shown over the [T1, T2] parameter space for S1, S2, and the calculated signal R1/2 (using Eqs. (1) and (4)). The MP2RAGE sequence (A) shows only the T1 dependence, whereas the MPFLAGRE‐2 sequence (B) shows the effect of the T2 preparation and T1. The calculated R1/2 shows the CSF suppression and signal detection over the pathologic range of T2. The black dots on the surface plots indicate the 5 tissue components. The T1 and T2 values for CSF are assigned at 4.3 seconds, 0.9 seconds; GM at 2.0 seconds, 60 ms; and WM at 1.2 seconds, 60 ms19, 20, 21
In comparison, Figure 2B shows simulations of the MPFLAGRE‐2 sequence, including the T2 preparation module applied early in the T1 recovery and using a parameter set of ti1/ti2/TR/TE = 0.1/1.6/5/0.085 seconds and tip angles of 5° and 9°. The calculated image (Eq. (4)) shows that the CSF signal (T1, T2) taken at [4.3, 0.9] seconds19 is partially suppressed with ~‐0.18, which is substantially lower than normal and RWM. (The T1, T2 values for tissue components used in these simulations are CSF = 4.3 seconds, 0.9 seconds; GM = 2.0 seconds, 60 ms; WM = 1.2 seconds, 60 ms.19‐21) It should be stated that the strategy for MPFLAGRE can also be applied with the spin‐echo application applied late (rather than early) in the T1 recovery. Although there are differences between the early or late T2 preparation (Supporting Information Figure S3), the strategy remains similar (i.e., to optimize the timings of the T2 and T1 weighted blocks used with the self‐normalization to achieve CSF suppression due to T1 differences while maintaining T2 sensitivity). This report focuses on the T2 weighting applied early in the T1 recovery.
2.2. Three‐block and 4‐block sequences (MPFLAGRE‐3 and MPFLAGRE‐4)
The use of multiple readout blocks of acquisition in combination with both T1 and T2 preparation in the MPFLAGRE sequence provides additional flexibility. Two aspects of the multiple‐block acquisition are considered. First, although the MPFLAGRE‐2 sequence is able to suppress CSF, Figure 2B shows that there is relatively limited dynamic range for the calculated R1/2 image. To increase this sensitivity with T2, we recognize that the T2 preparation induces a change in the longitudinal magnetization and thus the rate of T1 recovery. Given the typically slow T1 recovery, the T2‐dependent effects on amplitude and T1 recovery rate thus transiently persist after the spin echo. To maximize the effect of the spin echo, we can then acquire an additional signal block (Figures 1 and 3A) and sum the 2 succeeding image blocks, S1 and S2. Analytically, this can be expressed as a sum of Eqs. (2) and (3), with simplifications including the small values for ti2, ti1, identical tip angles α for S1 and S2 (see Eqs. (2) and (3) for other terms, omitting the B1 ‐, tip angles, density, and T2 * factors), and extracting the TE dependent terms:
| (5) |
Figure 3.
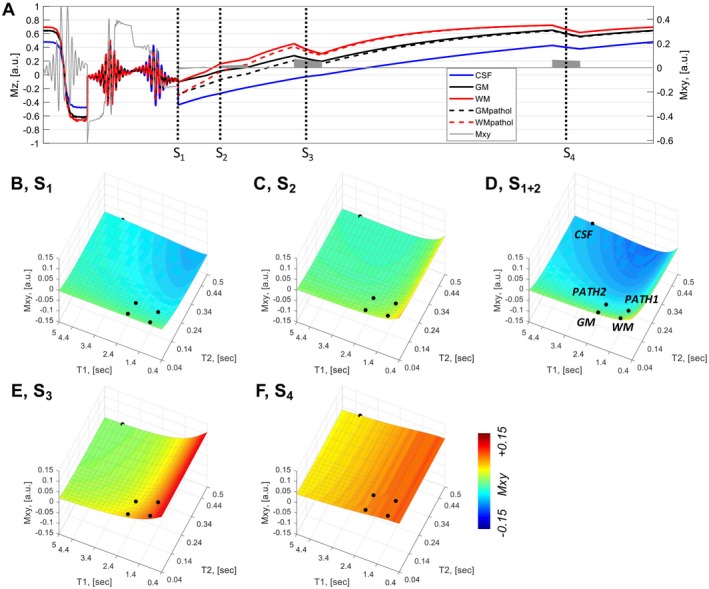
Bloch simulations of a 4‐block acquisition. A, Time course of Iz amplitudes (5 tissue components: blue, CSF; black, GM; red, WM; GM and WM with long T2 values for pathology). The [T1, T2] values for CSF are assigned at 4.3 seconds, 0.9 seconds; GM at 2.0 seconds, 60 ms; and WM at 1.2 seconds, 60 ms. B, Signal block 1 intensity is strongly T2 weighted, shown over the T1, T2 parameter space. C, Signal block 2 intensity. D, Summed signal blocks 1+2 show the combined T1 and T2 sensitivity. E,F, Signal blocks 3 and 4 are strongly influenced by T1. All signal intensities are plotted on a scale of [−0.1, 0.1]
With this sign inversion to maintain the desired tissue sensitivity, a third (delayed) block S3 is then used as the reference image for the self‐correcting normalization according to Eq. (6):
| (6) |
As seen from Eq. (5) and simulated in Figures 3B‐D, the summed block S1+2 increases the weighting of the term from 1 to . Consistent with this, simulation of the summed block strategy shows that the increase in dynamic range for the R(1+2)/3 image arises from a drop in the calculated signal for normal tissue, whereas the pathologic long T2 values “saturate” at 0.5 (Figure 4). Thus, the persistence of the spin‐echo effect is a function of T1 (WM returns more rapidly than GM) (i.e., R(1+2)/3 depends on the T1, as is larger [brighter] than ). With the adjacent block sum of S1 and S2, given the same numerical T2 range is present between normal and pathology for WM and GM (approximately 60 ms to 160 ms), the absolute increase in calculated intensity between normal to pathologic T2 values is similar between WM and GM: and .
Figure 4.
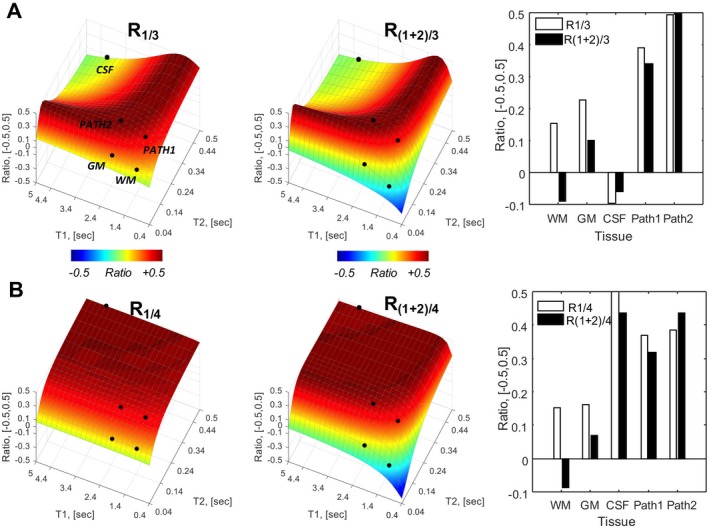
Bloch simulations for the MPFLAGRE‐4 sequence, adding a delayed S4 block. See Figure 3A for the time course. Behavior of 5 tissue components identified CSF (blue), GM (black), and WM (red); and GM and WM with long T2 values for pathology. Calculated R intensities are shown: R1/3 and R(1+2)/3 intensities as a function of T1, T2 space (A) and plots of signal amplitude from the 5 tissue points (far right). B, The R1/4 and R(1+2)/4 intensities. The R1/3, R(1+2)/3 amplitudes show CSF suppression and increased amplitudes over long T2 components. The R1/4 amplitude shows predominantly T2 dependence. The R(1+2)/4 intensity, similar to R(1+2)/3, shows a larger dynamic range for T2 dependence
The second aspect of multiple‐block acquisitions arises from the timing and use of the delayed reference image (e.g., through the addition of a fourth imaging block S4) (Figure 4). Combining the S1 and S4 images using Eq. (4) generates a calculated R1/4 that, by virtue of their common T1 factors, largely eliminates T1 dependence to generate a solely T2‐weighted image (which can be estimated from the simple 2‐block analysis in Eqs. (2) and (3) under the conditions of long ti2 and short ti1). For completeness, we also show the calculated R(1+2)/4; similar to R(1+2)/3, this shows an enhanced dynamic range over T2 but with mild T1 sensitivity. Figure 4 shows the resulting simulation, including the calculated R1/3 and R(1+2)/3 (CSF‐suppressed, T2‐weighted) and R1/4 and R(1+2)/4 (T2‐weighted) images.
2.3. B1 + dependence
Although the self‐correcting normalization eliminates B1 ‐ variation, variation in B1 + is not wholly corrected. Figure 5 considers the B1 + dependence of the sequence when multiple acquisition blocks are used to calculate the signal. The transceiver array exhibits 15% SD over the brain when combined with RF shimming (Supporting Information).6 Simulation results from a MPFLAGRE‐4 sequence are shown over the range of T2 values, using B1 + values at ± 15% and ±30% of the optimum B1 + value used (750 Hz). The CSF shows the greatest effect with B1 + variation, although the RCSF intensity remains at or below the normal‐tissue WM intensity RWM. Normal GM and WM show increased RGM and RWM, increasing by less than or equal to 25%. However, it should be noted that in the range of normal T2 values for GM and WM (40 ms‐70 ms20,21), the calculated intensity is steeply rising with T2, and that within a 15% erroneous B1 +, a less than 10‐ms T2 increase will give the same RGM intensity (i.e., the same signal intensity is equivalent to less than a 10‐ms T2 rise).
Figure 5.
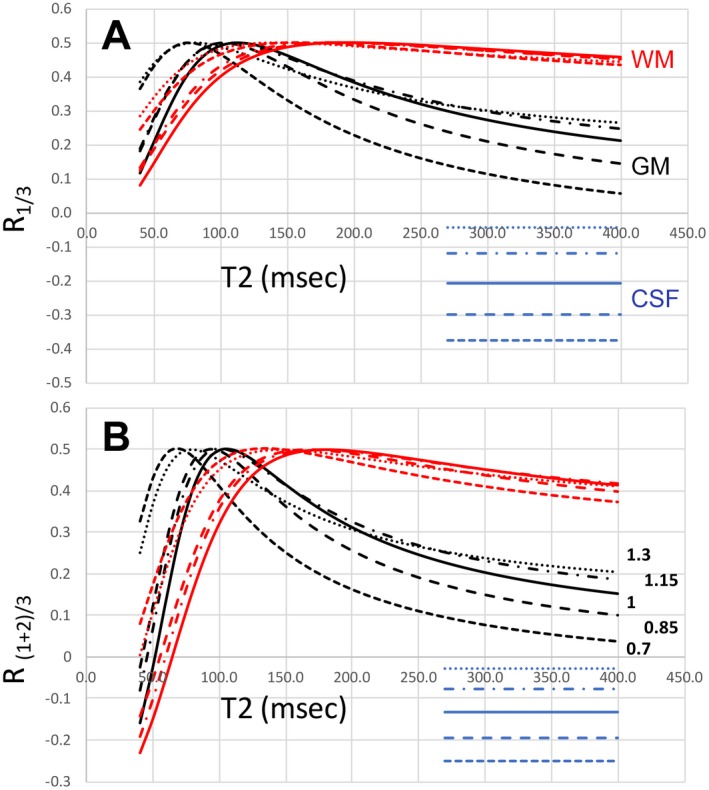
B1 + influence on MPFLAGRE‐4 as a function T2. A fixed T1 value is used for GM (2.0 seconds, black) and WM (1.2 seconds, red). The CSF is a single value plotted (4.3 seconds T1, 0.9 seconds T2, blue). The range of B1 + is 0.70 to 1.30, optimum at 1.0. A, Calculated intensity R1/3. B, Calculated intensity R(1+2)/3. Consistent with the surface plots in Figure 4, the dynamic range of R(1+2)/3 is larger than R1/2 by more than 50%. Based on the transceiver range of ±15% (dashed lines), the B1 + sensitivity of GM and WM is within approximately 25% over a T2 range of 60‐160 ms
2.4. Pathologic T2 values
As the goal of the FLAIR sequence is to detect tissues with long (and likely pathologic) T2 values, we need to have the values of pathologic relaxation at 7 T to properly optimize the parameters of the MPFLAGRE sequence. Although such values have not been widely reported, a 3T estimate is available,22 which found a less than 20% increase in hippocampal T2 in epilepsy versus control. We estimate that to leave adequate “head room” for pathology, the calculated image values for normal GM and WM tissue need to be less than 0.30, with CSF intensities at or below the normal tissue values; these values were achieved in these optimizations.
3. METHODS
We used a Siemens whole‐body 7T Magnetom 8‐channel multiple transmit system with body gradient coil and an 8 2 transceiver array for all acquisitions. All studies were approved by the institutional review board. The transceiver array was driven in coil pairs using 8 one‐to‐two splitters such that coils at equivalent azimuthal positions from the 2 rows are driven by the same RF transmit channel, with independent reception from all 16 channels. A fixed phase shift between the 2 rows is used to ensure constructive addition of the RF across rows and to maximize spatial coverage. B1 shimming was performed in all subjects, requiring about 3.5 minutes (including 2.5 minutes of B1 mapping acquisitions). In control subjects, a mean B1 + of 17.6 uT with a SD of 10.4 ± 1.8% over the brain using a maximum voltage for every RF channel of less than 170 V (n = 8 subjects6; Supporting Information Figures S1 and S2). As a result, conventional pulses are used, including hyperbolic secant pulses with mu = 10 and 4 time constants. With a single T2 preparation in the MPFLAGRE‐4 acquisition and 2π refocusing pulses, the acquisition has a global SAR of 74 ± 2% of the US Food and Drug Administration's guidelines of 3.2 W/kg (using 5 kg for adult head mass), as determined from the Siemens calibrated directional coupler measurements. A total of 5 control subjects were studied (Table 1), with mean height and weight of 62.1 ± 11 kg and 168.1 ± 8.1 cm (3 males, 2 females). A GRAPPA factor of 3 was used, achieving a 0.7 0.7 1.2 mm (nominal volume 0.6 mm3) resolution, with an acquisition time of 9.5 minutes. The phase encoding for the imaging blocks were either linear or center out, with the latter used to maintain maximal T2 weighting at the center of k‐space. All timings are thus reported as the duration between the center of the inversion recovery to the k‐space center acquisition.
Table 1.
Signal‐to‐noise ratio, contrast‐to‐noise ratio, and SAR for the MPFLAGRE sequence
| SNR | CNR | SAR (FDA max. 15 W) | ||||
|---|---|---|---|---|---|---|
| GM | WM | CSF | GM‐CSF | WM‐CSF | ||
| 3D SPACE | 8.6 | 12.0 | 5.6 | 0.20 | 4.21 | 11.6 W (77%) |
| 3D MPFLAGRE‐4 R1/3 | 13.7 | 30.4 | 7.0 | 6.17 | 8.00 | 10.7 W (70%) |
| 3D MPFLAGRE‐4 R1/3, N=5 | 17.0 ± 2.3 | 35.2 ± 6.1 | 5.4 ± 18 | 6.63 ± 1.0 | 6.94 ± 1.0 | 11.1 ± 0.5 W (74%) |
Abbreviations: CNR, contrast‐to‐noise ratio; FDA, US Food and Drug Administration.
4. RESULTS
4.1. MPFLAGRE‐2
Figure 6 shows the data acquired from a healthy control using the MPFLAGRE‐2 sequence. For comparison, Figure 6A,B shows the data without and with the T2 preparation, respectively. The timings in Figure 6A are set to create MP2RAGE‐like contrast (ti1/ti2/TR = 0.9/2.67/5 seconds, tip angle = 5° and 9°), and as expected, the acquired and calculated images are all strongly T1 weighted. Figure 6B,C shows the MPFLAGRE‐2 data, acquired with ti1/ti2/TR/TE = 0.14/1.65/5/0.100 seconds using pulse angles of 5° and 9°. Figure 6C shows the base images with T2 contrast dominating the S1 image. In S1, the WM‐GM contrast is small; this is due to the dynamic range of the signal intensity governed by the high proton density CSF signal and the small WM‐GM variation in T2 at 7 T. Consistent with simulation, there is little T2 contrast in the CSF‐suppressed R1/2 image (Figure 6B).
Figure 6.
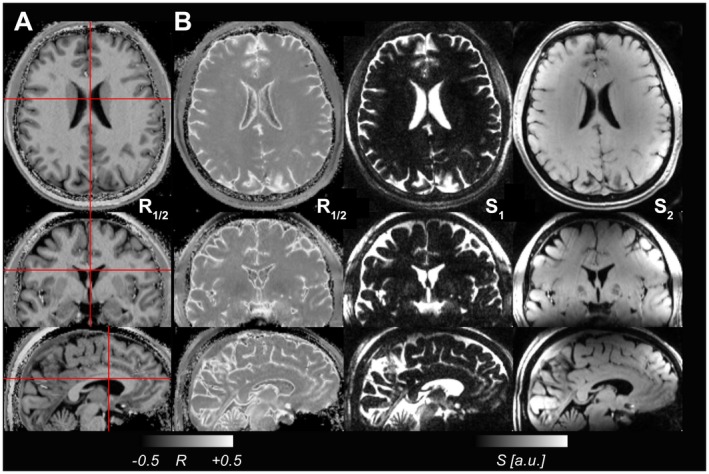
Images from a control acquired without a spin‐echo preparation with parameters selected to create (A) an MP2RAGE‐like image with CSF nulling and bright WM and (B) the MPFLAGRE‐2 R1/2 image, acquired with a spin‐echo TE of 100ms. The individual signal blocks S1 and S2 are also shown in (B) for the MPFLAGRE contrast, with image S1 being heavily T2 weighted. Image S2 acquired later is heavily T1 weighted. For the MPFLAGRE image in (B), the R1/2 image shows CSF suppression with relatively weak discrimination between WM and GM, as seen from simulation
4.2. MPFLAGRE‐4
As the MPFLAGRE‐3 acquisition is very similar to that of MPFLAGRE‐4, Figure 7 shows the data from the MPFLAGRE‐4 sequence. Shown are both the CSF‐suppressed (Figure 7A) and T2‐weighted (Figure 7B) calculated images, over a range of [0.5, 0.5]. The T2‐weighted images R1/4 and R(1+2)/4 again show the limited dynamic range of T2 variation at 7 T between WM and GM. The difference between the calculated R1/3 and R(1+2)/3 images (showing the increase in dynamic range in total signal) is consistent with the simulation, and is a result of decreased calculated signal in normal WM and GM in R(1+2)/3. With this effect being different between WM and GM, the R(1+2)/3 images show slightly more GM‐WM contrast in comparison with R1/3. Although this initial report is not intended to evaluate pathology, Figure 8 shows the performance of the MPFLAGRE‐4 (same acquisition parameters as in control from Figure 7) in 2 patients (epilepsy, left neocortical temporal lobe, anaplastic astrocytoma). In comparison to a clinical 3T FLAIR (Figure 8C), the epilepsy patient shows bright signal in the lateral cortex and hippocampus consistent with clinical data. The tumor patient shows that the bright MPFLAGRE signal in the temporal lobe extends into the posterior thalamus. The 3T studies were performed on a GE Signal Discovery MR750, with an inversion recovery for the epilepsy T1 image; T1 optimized fast spin echo for the tumor T1 image; and both FLAIRs acquired with 2D fast spin echoes (TR/TI/TE = 11.6 seconds/2.5 seconds/154 ms, resolution = 0.43 0.43 3.3 mm3 [epilepsy] and TR = 8.7 seconds/2.2 seconds/150 ms, resolution = 0.63 0.63 5 mm3 [tumor]).
Figure 7.
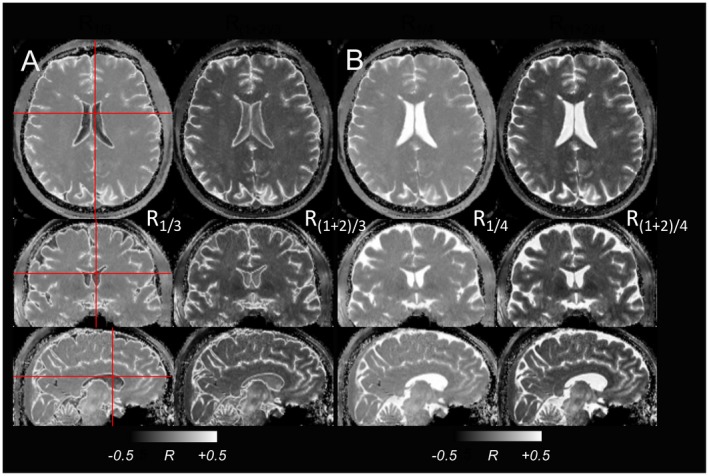
The MPFLAGRE‐4 data from healthy control. A, Suppressed CSF, showing the 3D view of R1/3 and R(1+2)/3 images. B, T2‐weighted image showing a 3D view of R1/4, and calculated R(1+2)/4 image. All gray scaling is shown at [−0.5, 0.5]
Figure 8.
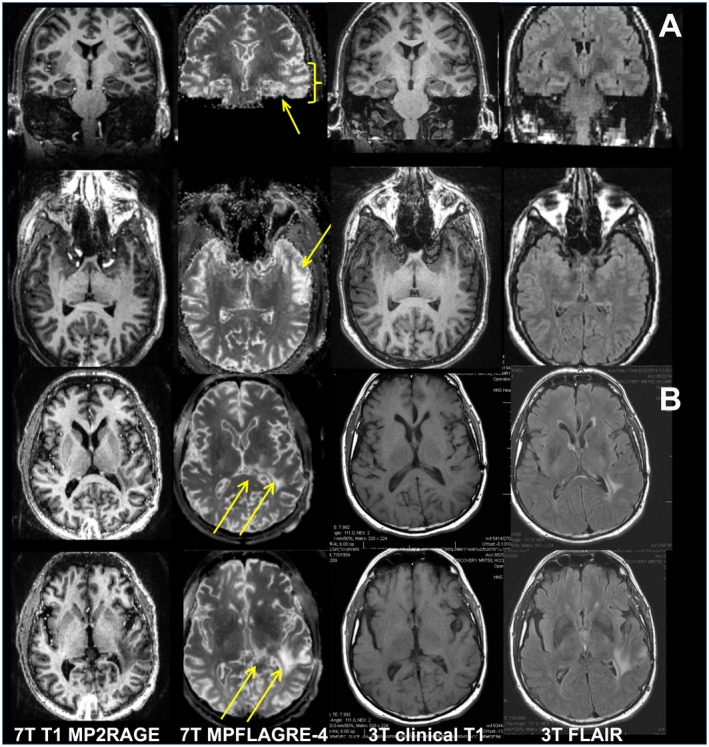
Data from an epilepsy (A) and brain tumor patient (B). For both, the coregistered 7T MP2RAGE, MPFLAGRE‐4 (S(1+2)/3), 3T clinical T1, and FLAIR images are shown. For the epilepsy patient, increased signal intensity is identified in the lateral left temporal lobe (thick arrows, axial and coronal) and is consistent with clinical data. Note from the coronal image that there is also increased signal in the left hippocampus (thin arrow, coronal), which is characteristic of the local network involvement in temporal lobe epilepsy. The 3T FLAIR from this patient, acquired within 3 months of the 7T images, was interpreted as negative. For the tumor patient, all 7T and 3T images were acquired within 1 week. The arrows identify the increased MPFLAGRE signal in the left temporal lobe extending into the posterior thalamus
4.3. Comparison with 3D SPACE and contrast‐to‐noise ratio
For whole‐brain coverage, the MPFLAGRE sequence is compared with the 3D variable flip angle SPACE acquisition. As reported by Visser,10 the SPACE acquisition benefits substantially from 2D acceleration (2.5 2.5) but still requires a long TR. Our implementation used a GRAPPA factor of 4; however, a TR of 10 seconds was needed to reduce SAR to within the US Food and Drug Administration's guidelines, resulting in an acquisition of 19.7 minutes with TR/TI/TE of 10.1 seconds/2.35 seconds/200 ms. Figure 9 shows the mildly brighter GM, characteristic of the residual T1 weighting. However, this contrast is B1 +‐sensitive, and the consistency of the image intensity is relatively poor, reflecting the variation in B1 ‐ (and B1 +). Matched in resolution (0.7 0.7 1.2 mm3) with the MPFLAGRE, Table 1 provides the contrast‐to‐noise ratio (CNR) and SNR between the SPACE and R1/3 images for a single volunteer (single session). For region of interest measurements, contiguous 4 4 1 pixel blocks were taken from the centrum semi‐ovale, thalamus, and posterior ventricle for WM, GM, and CSF. The CNR and SNR were calculated in 5 healthy volunteers (Table 1) using the following equation:
| (7) |
Figure 9.
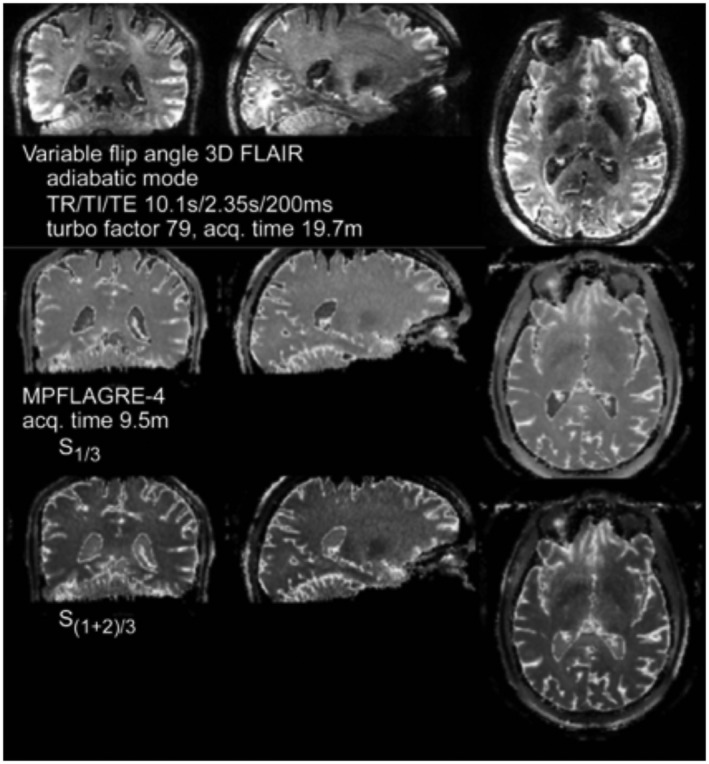
Comparison of 3D SPACE (top) with R1/3 (middle) and R(1+2)/3 (bottom) MPFLAGRE‐4 single volunteer in a single session
5. DISCUSSION
5.1. T1 and T2 dependence of the MPFLAGRE signal
As shown in simulation and implementation, the MPFLAGRE sequence is able to generate T2‐weighted images with controlled T1 effects. The data show that the T2 preparation is effective and the self‐correcting normalization with multiple acquisition blocks enables modulation of the T1 relaxation effects. The T1 and T2 behavior is better understood by recognizing the balance between the T2‐weighted S1 and reference (non‐T2‐weighted) images used in the normalization. In the case in which the common T1 relaxation factor contributes to both S1 and the reference image (e.g., S4 in the MPFLAGRE‐4), the normalization results in negligible T1 dependence regardless of the T2 value (Figure 4D).
However, if the reference image S4 is acquired with some residual T2 (in addition to T1) weighting, the normalization cannot cancel the T1 weighting over all T2 values. Tissues with very long T2 will be transparent to the spin‐echo weighting, and generate a T1‐weighted image. Tissues with extremely short T2 will approach 0.0 for all T1 values. Signal from tissues with intermediate relaxation values will vary depending on the specific acquisition parameters and the relaxation values, and thus is a target for optimization. As discussed, suppressing CSF is achieved by optimizing the timings of the 2 blocks (either S1 and S2 in MPFLAGRE‐2 or S1 and S3 in MPFLAGRE‐3 and MPFLAGRE‐4) to acquire substantially dissimilar signal intensities, ideally generating a signal in the 0 to 0.5 range. With lesional imaging, the goal is to generate significant calculated RT2w,Ref difference between normal and longer (pathologic) T2 values. Applying the T2 weighting before the T1 recovery null, we recognize that pathologic T2 values will result in “less T1 later shift” than tissues with normal T2 values. Thus, to generate an increase in calculated signal from tissue with pathology, the reference image needs to be acquired after the null, sign inverted and larger in absolute amplitude compared with normal T2 values (i.e., as exemplified with the MPFLAGRE‐2 timing).
The limited dynamic range of the 2‐block acquisition arises from the amplitudes of signal in the T2‐weighted and reference images. With the MPFLAGRE‐3 and MPFLAGRE‐4, we expand this range and take advantage of the temporal persistence of the T2‐dependent T1 later shift effect through the summation of the 2 adjacent blocks. This later shift effect is larger for shorter T2 components (i.e., normal T2) rather than pathologic T2 values (Figure 3). Thus, the sign‐sensitive summation of 2 adjacent blocks after the spin echo will result in an apparent decrease in amplitude for normal T2 components and give decreased R(1+2)/3, whereas the pathologic long T2 components effectively saturate with R(1+2)/3 at 0.5. With the shorter T1 of normal WM, the RWM falls more than RGM. However, because of the similar T2 values of WM and GM at 7 T, the absolute increases in and are similar for both tissues; this effect is also seen with the simpler MPFLAGRE‐2 sequence.
5.2. Specific absorption rate and CNR of the MPFLAGRE sequence
From a SAR perspective, the use of a single nonselective adiabatic spin echo allows the MPFLAGRE sequence to function with high efficiency. With the MPFLAGRE‐4 sequence, over n = 5 adult control volunteers, the 6‐minute average SAR was maintained at 74% ± 2% of the US Food and Drug Administration's guidelines. The CNR between WM‐GM is approximately 1.0 (data not shown), which is consistent with the small differences in their T2 at 7 T. For GM‐CSF the CNR is 6.63 ± 1.0, and for WM‐CSF the CNR is 6.94 ± 1.0, which again is consistent with the similar intensities between WM and GM. In spite of the combination of multiple images used in this approach, which may otherwise be expected to increase variability, the coefficient of variance(s) in the MPFLAGRE data are comparatively low at less than 15%, reflecting their nonrandom source of variability.17 As a result, the SNR and CNR are higher with the MPFLAGRE sequence in comparison with the variable flip angle acquisition.
Inspection of Figures 5 and 6 show that there is enhanced signal intensity at the cortical rim and ependyma. This is consistent with the report of von Veluw,23 who concluded that increased T2 contributes to their enhanced FLAIR signal intensity. Although quantitative T2 data do not exist on these tissue components, a long T2 for the cortical rim is not surprising, given that it contains the comparatively poorly vascularized molecular layer I of the neocortex. Similarly, the high signal intensity from the ependyma is likely related to its function as the neuroepithelial layer around the ventricle that contributes to the production and regulation of CSF.
5.3. Caveats with the MPFLAGRE sequence
The primary challenge with this sequence is its B1 + sensitivity, as shown in Figure 9. A 15% increase or decrease in B1 + results in increased intensity R1/3 by less than 20% for WM and less than 28% for GM, although this effect decreases at longer T2. However, this effect arises from the steep rise of R over the normal range of T2 values. From a viewpoint of a given R1/3 intensity, a 15% B1 + variation results in a small decline in apparent T2 by about 10 ms for GM (about 5 ms for white matter). With 30% B1 + inhomogeneity, these effects increase substantially, with the T2 sensitivity curves broadly shifting to lower T2 values (i.e., there can be erroneously bright signal [> 0.30] for relatively normal T2 values). In practice, our experience with the transceiver with the adiabatic refocusing pulses has not been shown to be a major problem for this over the entire head. Nonetheless, this sensitivity can be improved with incorporation of an adiabatic excitation spin‐echo module, such as that used by Dyvorne and Balchandani,16 although at added SAR cost.
With the CSF suppression generated from the normalization strategy performed between the multiple acquisition blocks, acquisition of differing resolution images but at the same delay times can change the resulting contrast. However, for the given parameters there is excellent consistency between different subjects, as indicated in Table 1 and the patient data. Nonetheless, this effect can be minimized with use of additional acceleration methods in 2 or 3 dimensions. In addition, magnetization‐transfer effects, which are not modeled here, can differentially affect the signal between the Si,j blocks and thus contribute to the contrast.24 Notably, with magnetization‐transfer effects typically decreasing the signal intensity in high‐density (normal) tissue, this would result in an enhancement of the apparent MPFLAGRE sensitivity to pathology (the pathologic longer T2 would exhibit a lesser magnetization‐transfer effect). Finally, the need for relatively long TR still limits the entire acquisition at approximately 10 minutes. However, with generation of both the T2 and CSF‐suppressed T2‐weighted images in a single matched image, the MPFLAGRE remains an efficient acquisition.
6. CONCLUSIONS
In summary, we have developed and demonstrated the MPFLAGRE sequence as a flexible acquisition that builds on the self‐correcting normalization strategy17 to generate T2 and CSF‐suppressed T2 weighted contrast at 7 T. This is performed by incorporating a longitudinal spin‐echo weighting within the context of an inversion recovery. With appropriate timing and combination of multiple imaging blocks during the inversion recovery, it is possible to control the T1 dependence and specifically suppress CSF. Not surprisingly, the T2‐weighted image, even when corrected for M0, B1 ‐ and T2 *, displays relatively little contrast between WM and GM, reflecting the small to minimal difference in T2 at 7 T. As applied with a transceiver array, the sequence functions well within SAR guidelines. Overall, as the CSF‐suppressed T2‐weighted contrast is designed for sensitivity to pathology, additional work with patients will be necessary to further optimize the parameters at 7 T.
Supporting information
FIGURE S1 Two configurations are shown for driving the 8 2 transceiver from 8 independent RF channels. In configuration A, a single RF channel drives 2 adjacent coils within a row. In configuration B, a single RF channel drives 2 longitudinally adjacent coils
FIGURE S2 Experimental data showing performance of the 2 configurations. For each configuration, the MP2RAGE and B1 maps are shown. In configuration B, 2 RF distributions can be defined to excite the “homogeneous” volume and a “ring” volume
FIGURE S3 Bloch simulations of a late T2 preparation 2‐block acquisition, S1 and S2. A, The time course of Iz amplitudes is shown (5 tissue components: blue, CSF; black, GM; red, WM with inversion; pathologic T2). Note that the time axis is not linear, with each unit representing a simulation step. B, The surface plots of the signal amplitudes are shown over the [T1, T2] parameter space for S1, S2, and the calculated signal R1/2 (using Eq. (1)). The calculated R1/2 shows the CSF suppression and signal enhancement over the pathologic range of T2. The black dots on the surface plots indicate the 5 tissue components: T1, T2 values for CSF are assigned at 4.3 seconds, 0.9 seconds; GM at 2.0 seconds, 60 ms; and WM at 1.2 seconds, 60 ms
ACKNOWLEDGMENTS
This work was supported by NIH R01EB011639, R01NS090417, and R01NS081772. The authors would like to thank Professor Robert Turner for pointing out the potential magnetization‐transfer effect in this acquisition.
Pan JW, Moon CH, Hetherington HP. Cerebrospinal fluid–suppressed T2‐weighted MR imaging at 7 T for human brain. Magn Reson Med. 2019;81:2924–2936. 10.1002/mrm.27598
Funding information
NIH; Grant/Award numbers R01EB011639, R01NS090417, R01NS081772 and R01EB024408. We thank Tiejun Zhao and Tobias Kober, Siemens Medical Systems for advice. Thanks also to Mark Lowe and Ken Sakaie, Cleveland Clinic Foundation for review of their 7T T2 parameters.
REFERENCES
- 1. Uğurbil K. The road to functional imaging and ultrahigh fields. NeuroImage. 2012;62:726–735. [DOI] [PMC free article] [PubMed] [Google Scholar]
- 2. Ivanov D, Poser BA, Huber L, Pfeuffer J, Uludağ K. Optimization of simultaneous multislice EPI for concurrent functional perfusion and BOLD signal measurements at 7T. Magn Reson Med. 2017;78:121–129. [DOI] [PMC free article] [PubMed] [Google Scholar]
- 3. Moser E, Stahlberg F, Ladd ME, Trattnig S. 7‐T MR—from research to clinical applications? NMR Biomed. 2012;25:695–716. [DOI] [PubMed] [Google Scholar]
- 4. Tallantyre EC, Morgan PS, Dixon JE, et al. A comparison of 3T and 7T in the detection of small parenchymal veins within MS lesions. Invest Radiol. 2009;44:491–494. [DOI] [PubMed] [Google Scholar]
- 5. Pittau F, Baud MO, Jorge J, et al. MP2RAGE and susceptibility‐weighted imaging in lesional epilepsy at 7T. J Neuroimaging. 2018;28:365–369. [DOI] [PubMed] [Google Scholar]
- 6. Hetherington H, Zhao T, Starewicz P, Pan JW. RF shimming approaches for 7T multi‐row transceiver arrays In: Proceedings of the 10th Biennial High and Ultra‐High Field MR Imaging Workshop, Minneapolis, MN; 2015. [Google Scholar]
- 7. Vaughan JT, Garwood M, Collins CM, et al. 7T vs. 4T: RF power, homogeneity, and signal‐to‐noise comparison in head images. Magn Reson Med. 2001;46:24–30. [DOI] [PubMed] [Google Scholar]
- 8. Eggenschwiler F, O'Brien KR, Gruetter R, Marques JP. Improving T2 ‐weighted imaging at high field through the use of kT ‐points. Magn Reson Med. 2014;71:1478–1488. [DOI] [PubMed] [Google Scholar]
- 9. Setsompop K, Alagappan V, Zelinski AC, et al. High‐flip‐angle slice‐selective parallel RF transmission with 8 channels at 7 T. J Magn Reson. 2008;195:76–84. [DOI] [PMC free article] [PubMed] [Google Scholar]
- 10. Visser F, Zwanenburg JJ. Hoogduin JM, Luijten PR. High‐resolution magnetization‐prepared 3D‐FLAIR imaging at 7.0 Tesla. Magn Reson Med. 2010;64:194–202. [DOI] [PubMed] [Google Scholar]
- 11. Busse RF, Hariharan H, Vu A, Brittain JH. Fast spin echo sequences with very long echo trains: design of variable refocusing flip angle schedules and generation of clinical T2 contrast. Magn Reson Med. 2006;55:1030–1037. [DOI] [PubMed] [Google Scholar]
- 12. Cloos MA, Boulant N, Luong M, et al. kT ‐points: short three‐dimensional tailored RF pulses for flip‐angle homogenization over an extended volume. Magn Reson Med. 2012;67:72–80. [DOI] [PubMed] [Google Scholar]
- 13. Haase A. Snapshot FLASH MRI. Applications to T1, T2, and chemical‐shift imaging. Magn Reson Med. 1990;13:77–89. [DOI] [PubMed] [Google Scholar]
- 14. Mugler J, Spraggins T, Brookeman J. T2 weighted 3‐dimentional MP‐RAGE MR imaging. J Mag Res Imaging. 1991;1:731–737. [DOI] [PubMed] [Google Scholar]
- 15. Parrish T, Hu X. A new T2 preparation technique for ultrafast gradient echo sequence. Magn Res Med. 1994;32:652–657. [DOI] [PubMed] [Google Scholar]
- 16. Dyvorne H, Balchandani P. Slice‐selective adiabatic magnetization T2 ‐preparation (SAMPA) for efficient T2 ‐weighted imaging at ultrahigh field strengths. Magn Reson Med. 2016;76:1741–1749. [DOI] [PMC free article] [PubMed] [Google Scholar]
- 17. Marques J, Kober T, Krueger G, et al. MP2RAGE, a self bias‐field corrected sequence for improved segmentation and T1 mapping at high field. NeuroImage. 2010;49:1271–1281. [DOI] [PubMed] [Google Scholar]
- 18. O'Brien KR, Kober T, Hagmann P, et al. Robust T1‐weighted structural brain imaging and morphometry at 7T using MP2RAGE. PLoS ONE. 2014;9:e99676. [DOI] [PMC free article] [PubMed] [Google Scholar]
- 19. Rooney WD, Johnson G, Li X, et al. Magnetic field and tissue dependencies of human brain longitudinal 1H2O relaxation in vivo. Magn Reson Med. 2007;57:308–318. [DOI] [PubMed] [Google Scholar]
- 20. Michaeli S, Garwood M, Zhu XH, et al. Proton T2 relaxation study of water, N‐acetylaspartate, and creatine in human brain using Hahn and Carr‐Purcell spin echoes at 4T and 7T. Magn Reson Med. 2002;47:629–633. [DOI] [PubMed] [Google Scholar]
- 21. Daoust A, Dodd S, Nair G, et al. Transverse relaxation of cerebrospinal fluid depends on glucose concentration. Magn Reson Imaging. 2017;44:72–81. [DOI] [PMC free article] [PubMed] [Google Scholar]
- 22. Briellmann RS, Syngeniotis A, Fleming S, Kalnins RM, Abbott DF, Jackson GD. Increased anterior temporal lobe T2 times in cases of hippocampal sclerosis: a multi‐echo T2 relaxometry study at 3 T. Am J Neuroradiol. 2004;25:389–394. [PMC free article] [PubMed] [Google Scholar]
- 23. van Veluw SJ, Fracasso A, Visser F, et al. FLAIR images at 7 Tesla MRI highlight the ependyma and the outer layers of the cerebral cortex. NeuroImage. 2015;104:100–109. [DOI] [PubMed] [Google Scholar]
- 24. Rioux JA, Levesque IR, Rutt BK. Biexponential longitudinal relaxation in white matter: characterization and impact on T1 mapping with IR‐FSE and MP2RAGE. Magn Reson Med. 2016;75:2265–2277. [DOI] [PMC free article] [PubMed] [Google Scholar]
Associated Data
This section collects any data citations, data availability statements, or supplementary materials included in this article.
Supplementary Materials
FIGURE S1 Two configurations are shown for driving the 8 2 transceiver from 8 independent RF channels. In configuration A, a single RF channel drives 2 adjacent coils within a row. In configuration B, a single RF channel drives 2 longitudinally adjacent coils
FIGURE S2 Experimental data showing performance of the 2 configurations. For each configuration, the MP2RAGE and B1 maps are shown. In configuration B, 2 RF distributions can be defined to excite the “homogeneous” volume and a “ring” volume
FIGURE S3 Bloch simulations of a late T2 preparation 2‐block acquisition, S1 and S2. A, The time course of Iz amplitudes is shown (5 tissue components: blue, CSF; black, GM; red, WM with inversion; pathologic T2). Note that the time axis is not linear, with each unit representing a simulation step. B, The surface plots of the signal amplitudes are shown over the [T1, T2] parameter space for S1, S2, and the calculated signal R1/2 (using Eq. (1)). The calculated R1/2 shows the CSF suppression and signal enhancement over the pathologic range of T2. The black dots on the surface plots indicate the 5 tissue components: T1, T2 values for CSF are assigned at 4.3 seconds, 0.9 seconds; GM at 2.0 seconds, 60 ms; and WM at 1.2 seconds, 60 ms


