

Summary
Background
No blood test has been shown to be effective in the prediction of primary liver cancer in patients without cirrhosis.
Aim
To construct and internally validate two sequential tests for early prediction of liver cancer. These tests enable an algorithm which could improve the performance of the standard surveillance protocol recommended (imaging with or without AFP), limited to patients with cirrhosis.
Methods
We performed a retrospective analysis in prospectively collected specimens from an ongoing cohort. We designed an early sensitive high‐risk test (LCR1) that combined (using Cox model) hepatoprotective proteins (apolipoproteinA1, haptoglobin) with known risk factors (gender, age, gammaglutamyltranspeptidase), and a marker of fibrosis (alpha2‐macroglobulin). To increase the specificity, we then combined (LCR2) these components with alpha‐fetoprotein.
Results
A total of 9892 patients, 85.9% without cirrhosis, were followed up for 5.9 years [IQR: 4.3‐9.4]. LCR1 and LCR2 time‐dependent AUROCs were not different in construction and validation randomised subsets. Among 2027 patients with high‐LCR1 then high‐LCR2, 167 cancers (113 with cirrhosis, 54 without cirrhosis) were detected, that is 12 patients needed to screen one cancer. The negative predictive value was 99.5% (95% CI 99.0‐99.7) in the 2026 not screened patients (11 cancers without cirrhosis) higher than the standard surveillance, which detected 113 cancers in 755 patients screened, that is seven patients needed to screen one cancer, but with a lower negative predictive value 98.0% (97.5‐98.5; Z = 4.3; P < 0.001) in 3298 not screened patients (42 cancers without cirrhosis).
Conclusions
In patients with chronic liver disease the LCR1 and LCR2 tests identify those with a high risk of liver cancer, including in those without cirrhosis. NCT01927133.
1. INTRODUCTION
Primary liver cancer (PLC), the second most frequent cause of cancer‐related death, mainly develops in patients with chronic liver disease.1 The discrimination of those at high risk from those at low risk of PLC would be highly important in these patients.2 Most published PLC risk scores have included histological cirrhosis as a major component, which is a limitation due to the adverse events and the cost of biopsy. The development of non‐invasive tests of fibrosis could improve the prediction of the cancer risk in large populations.3
In 1997 we constructed a fibrosis blood test (FibroTest®, FibroSure in USA),4 which has been validated in chronic hepatitis C (CHC)5, 6 and B (CHB),5, 7 alcoholic liver disease (ALD),8 and non‐alcoholic fatty liver disease (NAFLD),9 with similar prognostic values.10, 11 Therefore, the FibroTest can replace a biopsy to determine the presence or absence of cirrhosis when constructing new tests to predict candidates at risk who require surveillance .
Despite their association with fibrosis, two components of the FibroTest could also be predictive of PLC, independently of the presence of cirrhosis. Apolipoprotein A1 (ApoA1) is associated with an increased risk of overall cancer.12, 13 There is also evidence to indicate that ApoA1 and haptoglobin mediate hepatoprotection. In healthy volunteers testing acetaminophen, these proteins were differentially expressed in subjects who subsequently developed an increase in transaminases vs those who did not.14 Also, in patients with drug‐induced liver injury, higher serum levels of these two proteins were predictive of transaminase recovery.15 This suggests that individuals with lower ApoA1 or haptoglobin at inclusion could be at a higher risk of developing PLC, irrespective of the presence of cirrhosis.
GGT was the third component of interest, as several studies have demonstrated its strong independent predictive value for PLC. Although the underlying mechanisms are unclear, GGT is significantly associated with cytotoxicity induced by cholestatic and metabolic disorders, as well as with excessive alcohol consumption.16, 17, 18
Alpha2‐macroglobulin (A2M), is a multifunctional binding protein with protease and cytokine scavenging properties that has been studied as a marker of liver fibrosis.4, 19 So far, no direct association with PLC has been reported in either humans or rodent models.19, 20 On the contrary, A2M was strongly associated with anti‐cancer mechanisms in the nude mole rat.21
Our first aim was to construct a "high‐risk" individualized blood test (LCR1, patent pending) to measure the 10‐year risk of PLC in patients with liver disease, without or with cirrhosis. We used six components: apoA1 and haptoglobin as markers of hepatoprotection, GGT as a marker of cytotoxicity factors, adjusted to A2M to take into account the severity of fibrosis, as well as age and gender. LCR1 was constructed as a very early marker of the risk of liver cancer (LCR1), with the idea of possibly extending imaging surveillance which is now limited to patients with cirrhosis, to patients without cirrhosis, and a high risk of cancer.
The second aim was to obtain an early marker of cancer (LCR2, patent pending) combining the six components of LCR1 with alpha‐fetoprotein (AFP), for the prediction of cancer at 5 years. If the performance of LCR2 was better (more sensitive) than AFP alone, it could be used in patients without cirrhosis with an elevated LCR1 and in patients with cirrhosis.
The third aim was to assess the efficacy of surveillance combining LCR1 and LCR2 in patients without or with cirrhosis, compared to the standard surveillance protocol recommended in United States (imaging with or without AFP), which is limited to patients with cirrhosis.22
2. PATIENTS AND METHODS
Patients for test construction and internal validation were from the “Groupe Hospitalier Pitié Salpêtrière cohort” of FIBROFRANCE, a program organised in 1997 (Clinical registry number: NCT01927133). The protocol was approved by the institutional review boards, regulatory agency and performed in accordance with principles of Good Clinical Practice. All patients provided written informed consent before entry. All authors had access to the study data and reviewed and approved the final manuscript.
Patients with a FibroTest performed before 2013, without previous PLC or liver transplantation, were selected (Figure 1). Follow‐up and hepatitis treatments were scheduled according to updated guidelines and are described in File S2.3, 22 An ultrasound (US) examination and AFP were recommended every 6 months in patients with cirrhosis at inclusion. The diagnosis of PLC was based on a histological examination by an experienced pathologist or probabilistic non‐invasive criteria.3, 22 When the diagnosis of PLC was established, treatment was decided using a multidisciplinary approach. Reports of imaging results showing focal liver lesions were secondarily reviewed by the three senior hepatologists (TP, YN, and MM) and classified according to Milan criteria.23 PLC was defined as either hepatocellular carcinoma (HCC) or intrahepatic cholangiocarcinoma (iCCA) as these cancers are both derived from hepatic progenitor cells.
Figure 1.
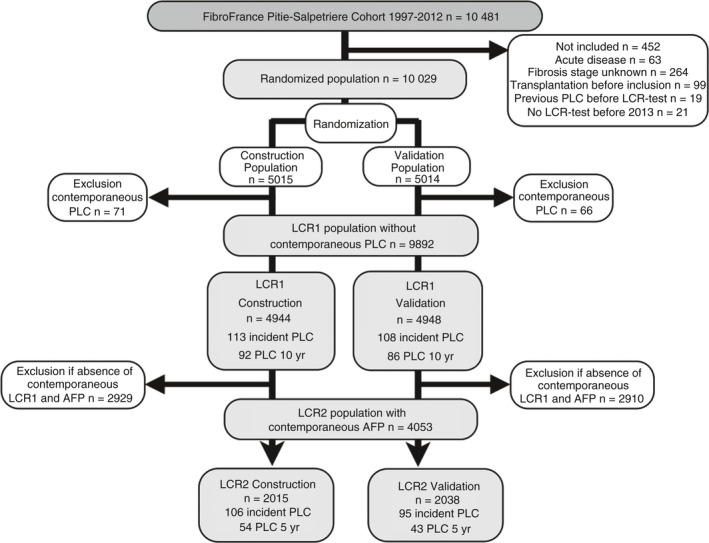
Flow sheet of population subsets
The retention rate was defined as the number of patients who came for a second assessment of fibrosis stage by either FibroTest or elastography. The outcome of lost to follow‐up patients was tracked by mail, calls to the patient or his/her private physician, and by the national death registry (INSERM‐CépiDC). More details are provided in File S2.
2.1. Statistical analysis
Included patients were randomly assigned to the construction or internal validation subset, to which model results were applied.
2.1.1. Construction and validation of LCR1 and LCR2
Cumulative survival of patients without incident PLC was estimated by the Kaplan‐Meier method. Univariate and multivariate Cox proportional hazards models were used to assess the performances of components, after checking that the variables confirmed the proportional‐hazard assumption using scaled Schoenfeld residuals.
The PLC risk estimate is a predictive score based on the Cox model at inclusion. Predicted PLC risks were estimated in the construction subset by the following equation: ^P = 1 ‐ S0 (t)exp(‐), where S 0 was inclusion PLC‐free probability, ß the Cox regression coefficients, x the individual risk factors value, and x¯i the mean of the risk factors in construction set. The model was constructed at 10 years for LCR1 among patients without cirrhosis, to predict the very early risk of PLC, and at 5 years for LCR2 to predict the occurrence of PLC at 5 years. The sample size of 200 events corresponded to recommendations.24 Performances were expressed and compared by the time‐dependent area under the ROC curve (AUROCt). The estimation of AUROCt in the presence of censored data used the inverse probability‐of‐censoring weights approach corresponding to two definitions of specificity.
The first aim was to obtain a significant prognostic performance, AUROCt >0.5, for the construction subset of LCR1, with no significant difference in the validation subset. Survivals without PLC in low‐risk vs high‐risk patients, defined as LCR1 below or above the optimal cut‐off values, respectively, were compared by the Logrank‐test.
The second aim was to obtain an improved performance (AUROCt) with LCR2 than with AFP alone, the standard PLC‐biomarker recommended by AASLD surveillance protocol, based on the integrated data base combining construction and validation subsets after checking for the absence of differences in AUROCt.
The third aim was in comparison with the standard surveillance protocol recommended by the American Association for the Study of Liver Diseases (AASLD) (imaging with or without AFP) limited to patients with cirrhosis (Figure 2A),22 to assess the efficiency of a new surveillance (imaging) limited to patients with cirrhosis and high‐LCR2 (≥optimal cut‐off), and extended to patients without cirrhosis but with high‐LCR1 (≥optimal cut‐off) and high‐LCR2 (Figure 2B). To determine the benefits and harms of these approaches we calculated the number of subjects needed to be screened (NNS) as well as the negative predictive value in nonscreened patients. Predictive values differences were compared using the Wald‐Z test.
Figure 2.
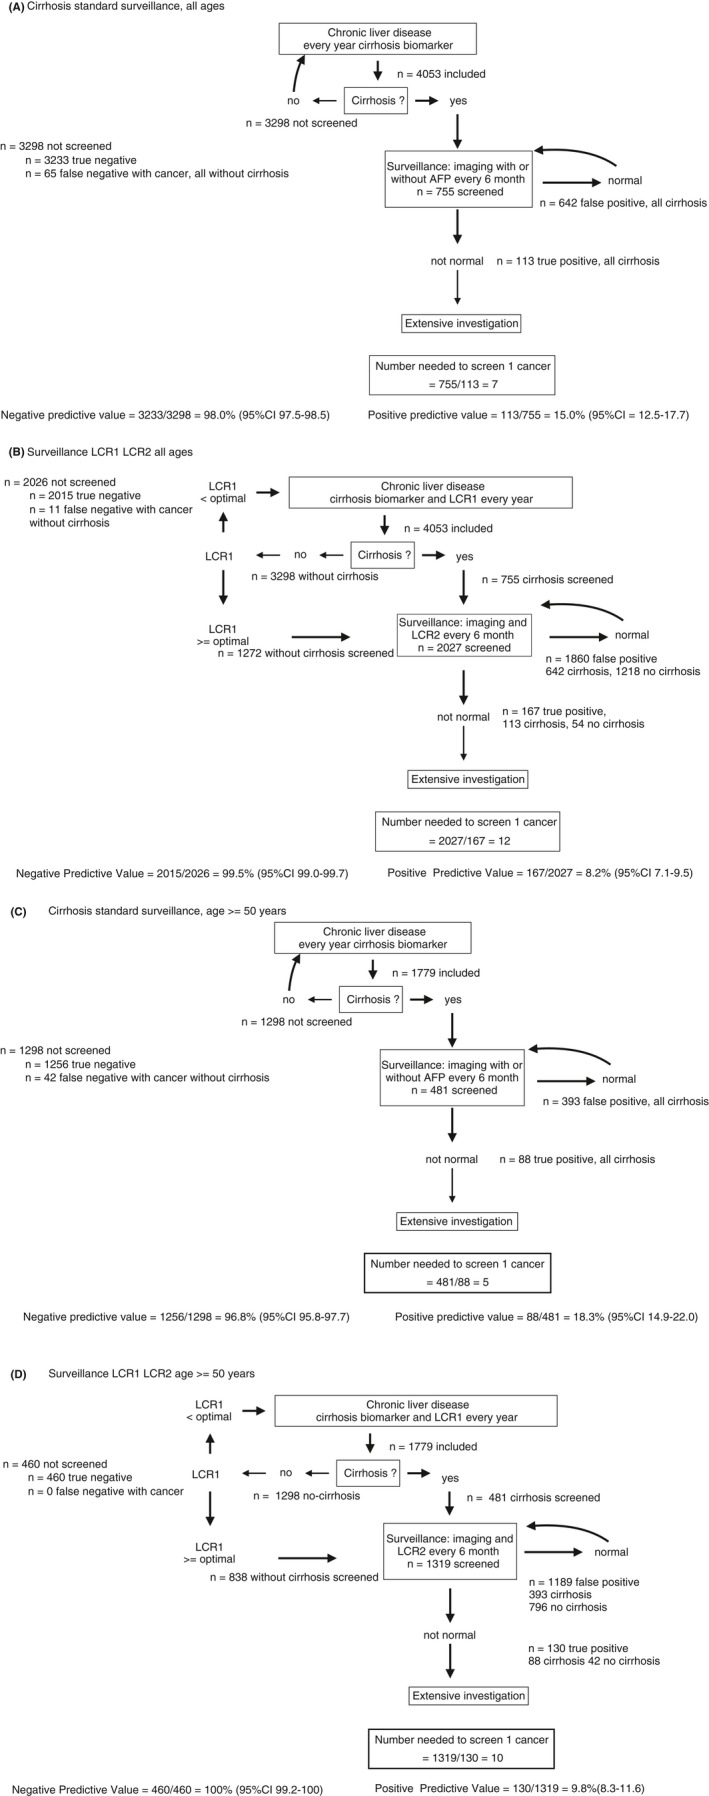
Standard surveillance in cirrhosis vs surveillance extended to noncirrhosis with high LCR1. In 4053 included patients, 178 cancers occurred at 10 years, including 130 in 1779 patients aged 50 years and older. A, Standard AASLD surveillance, limited to patients with cirrhosis. One hundred and thirteen primary cancers occurred in 755 patients with cirrhosis screened, that is seven patients needed to screen one cancer. Negative predictive value was 98.0% (97.5‐98.5) in 3298 not screened patients. B, New surveillance, limited to patients with cirrhosis and high LCR2, and extended to patients without cirrhosis and high LCR1 and high LCR2. One hundred and sixty‐seven primary cancers (113 with cirrhosis, 54 without cirrhosis) occurred in 2027 patients screened, that is 12 patients were needed to screen one cancer. Negative predictive value was 99.5% (95% CI 99.0‐99.7) in the 2026 not screened patients (11 cancers without cirrhosis) higher than using standard AASLD surveillance (Z = 4.3; P < 0.001). C, Standard AASLD surveillance, limited to patients with cirrhosis, and aged 50 years and older. Eighty‐eight primary cancers occurred in 481 patients with cirrhosis screened, that is five patients were needed to screen one cancer. Negative predictive value was 96.8% (95% CI 95.8‐97.7) in the 1298 not screened patients (42 cancers without cirrhosis). D, New surveillance, limited to patients with cirrhosis and high LCR2, and extended to patients without cirrhosis and high LCR1 and high LCR2, and aged 50 years and older. One hundred and thirty primary cancers occurred in 1319 patients (88 with cirrhosis, and 42 without cirrhosis) but high LCR1 and LCR2, that is 10 patients were needed to screen one cancer. Negative predictive value was 100% (95% CI 99.2‐100) in the 460 not screened patients (no cancer), higher than using standard AASLD surveillance (Z = 3.9; P < 0.001)
All the main analyses for the performance of LCR1 and LCR2 were based on the first serum samples obtained at inclusion. In the integrated database, AUROCt of LCR1 was assessed among patients without cirrhosis, and AUROCt of LCR2 was assessed among the clinical population at risk, patients with cirrhosis as defined by the standard FibroTest cut‐off of 0.74,5, 6, 7, 8, 9 and in patients without cirrhosis but with a cancer high risk defined as LCR1 above the optimal cut‐off. To improve the efficiency of surveillance, we also assessed the NNS in patients 50 years old or older, a well‐known risk factor of PLC. To assess calibration, the observed risk of developing PLC was plotted against the predicted risk by the Hare approach (https://CRAN.R-project.org/package=rms).25
2.1.2. Sensitivity analyses
To prevent any influence of colinearity from the stratification by FibroTest defining cirrhosis, which shares components with LCR1 and LCR2, we used three other definitions of cirrhosis; elasticity >12.5 k‐Pascal alone,26 biopsy alone, or at least one of these two methods.
We assessed the impact of patient characteristics, which can artificially change the AUROCs by a spectrum effect,27 in patients with inclusion PLC, and in patients who had repeated LCR1‐LCR2 measurements. One analysis (Cox model) assessed which characteristics were independently associated with incident PLC, and another one (logistic regression) those associated with cirrhosis. To homogenise the appropriate response criteria for the different liver diseases during follow‐up (chronic viral suppression, diabetic treatment, weight, or alcohol consumption), and prevent any risk of colinearity we used ALT transaminase as an indirect marker of necro‐inflammatory activity because this is not a FibroTest component. We defined significant improvement in LCR1 as a decrease for at least one quartile between inclusion and repeat LCR1. Factors associated with improvement on univariate and multivariate analysis were assessed using logistic regression.
All statistical analyses were performed using NCSS‐12.0 and R softwares, including timeROC library.25, 28
3. RESULTS
Four hundred and fifty‐three of the 10 481 consecutively enrolled patients were not included. The cohort retention rate was 62.8% (6581 out of 10 481). A total of 10 029 patients were included and randomly assigned to the construction (n = 5015) or validation (n = 5014) subsets (Figure 1).
Patient characteristics were similar in the randomised subsets (Table 1). The most frequent unique causes of chronic liver disease were CHC (34.3%) and CHB (20.5%). Viral suppression was achieved in almost all cases of CHB (97.0%) and in 46.9% of the patients with CHC during follow‐up.
Table 1.
Characteristics of patients at inclusion in the populations without contemporaneous cancer
| Characteristics | LCR1 Population without contemporaneous liver cancer Integrated database | LCR1 Construction randomised subset | LCR1 Validation randomised subset |
|---|---|---|---|
| Number | 9892 | 4944 | 4948 |
| Age median (interquartile) | 48.5 (39.3‐58.7) | 48.8 (39.7‐59.1) | 48.7 (39.2‐59.0) |
| Gender | |||
| Female number (percent) | 3992 (41.4) | 1974 (39.9) | 2018 (40.8) |
| Male | 5900 (59.6) | 2970 (60.5) | 2930 (59.2) |
| Ethnicity | |||
| Asian | 856 (8.7) | 404 (8.2) | 452 (9.1) |
| Caucasian | 6145 (62.1) | 3088 (62.5) | 3057 (61.8) |
| North AF‐ME | 1131 (11.4) | 563 (11.4) | 568 (11.5) |
| Subsaharan | 1760 (17.8) | 889 (18.0) | 871 (17.6) |
| Missing | 0 | 0 | 0 |
| Liver disease | |||
| ALD | 484 (4.9) | 247 (5.0) | 237 (4.9) |
| CHB | 2031 (20.5) | 1012 (20.5) | 1019 (20.5) |
| CHC | 3388 (34.3) | 1662 (33.6) | 1726 (34.9) |
| NAFLD | 1061 (10.7) | 554 (11.2) | 507 (10.2) |
| Other and mixed | 2928 (29.6) | 1469 (29.7) | 1459 (29.5) |
| Viral suppression by treatment | |||
| Not applicable | 3412 | 1716 | 1696 |
| No suppression | 2857 (44.1) | 1434 (44.4) | 1423 (43.8) |
| Suppression at inclusion | 238 (3.7) | 120 (3.7) | 118 (3.6) |
| Suppression follow‐up | 3385 (52.2) | 1674 (51.8) | 1711 (52.6) |
| Excess alcohol | |||
| Yes | 800 (8.1) | 401 (8.1) | 399 (8.1) |
| No | 9092 (91.9) | 4943 (91.9) | 4549 (91.9) |
| HIV infection | |||
| Yes | 715 (7.5) | 345 (7.3) | 370 (7.8) |
| No | 8776 (92.5) | 4406 (92.7) | 4370 (92.2) |
| Missing | 401 | 193 | 208 |
| T2 Diabetes | |||
| Yes | 904 (9.1) | 454 (9.2) | 450 (9.1) |
| No | 8988(90.9) | 4490 (90.8) | 4498 (90.9) |
| Fibrosis stage presumed by FibroTest | 9892 | 4944 | 4948 |
| Missing or not applicable | 0 | 0 | 0 |
| F0 | 4826 (48.8) | 2377 (48.1) | 2449 (49.5) |
| F1 | 1915 (19.4) | 972 (19.7) | 943 (19.1) |
| F2 | 723 (7.3) | 365 (7.4) | 358 (7.2) |
| F3 | 1033 (10.4) | 506 (10.2) | 527 (10.6) |
| Cirrhosis (F4) | 1395 (14.1) | 724 (14.6) | 671 (13.6) |
| Elasticity (TE) | 4283 (43.3) | 2131 (43.1) | 2152 (43.5) |
| Applicable and contemporaneous (AC) | 2897 (29.3) | 1421 (28.7) | 1476 (29.8) |
| Cirrhosis among AC | 381 (13.2) | 193 (13.6) | 188 (12.7) |
| Not applicable | 863 (20.2) | 445 (20.9) | 418 (19.4) |
| Not contemporaneous | 139 (3.3) | 64 (3.0) | 75 (3.5) |
| Missing | 5609 | 2813 | 2075 |
| Liver biopsy | 1204 | 618 | 586 |
| Applicable, contemporaneous (AC) | 895 | 465 | 430 |
| Cirrhosis among AC | 186 (20.8) | 108 (23.2) | 78 (18.2) |
| Not AC or missing | 8689 | 4326 | 4363 |
| Not applicable | 0 | 0 | 0 |
| Not contemporaneous | 309 | 153 | 156 |
| Missing | 8380 | 4173 | 4207 |
| TE or biopsy | 4247 | 2130 | 2117 |
| Applicable and contemporaneous (AC) | 3552 | 1766 | 1786 |
| Cirrhosis among AC | 560 (15.8) | 297 (16.8) | 263 (14.7) |
| Not AC or missing | 5645 | 2814 | 2831 |
| FibroTest | 0.29 (0.14‐0.57) | 0.31 (0.15‐0.60) | 0.29 (0.14‐0.59) |
| ActiTest | 0.23 (0.10‐0.45) | 0.23 (0.10‐0.46) | 0.23 (0.10‐0.47) |
| ApolipoproteinA1 | 1.45 (1.23‐1.69) | 1.44 (1.22‐1.69) | 1.45 (1.22‐1.68) |
| Haptoglobin | 1.02 (0.64‐1.45) | 1.02 (0.62‐1.45) | 1.02 (0.64‐1.44) |
| A2M | 2.06 (1.59‐2.82) | 2.08 (1.60‐2.83) | 2.05 (1.58‐2.82) |
| GGT | 45 (25‐103) | 46 (25‐107) | 47 (25‐107) |
| Bilirubin | 9.0 (7‐14) | 9.0 (7‐15) | 9.0 (7‐14) |
| ALT | 39 (24‐67) | 39 (25‐68) | 39 (24‐68) |
| AFP | 3.3 (2.2‐5.0) | 3.3 (2.2‐5.0) | 3.3 (2.3‐5.2) |
Characteristics were not significantly different between construction and validation subsets.
PLC was diagnosed in 221 out of the 9892 patients without existing PLC after a median follow‐up of 5.9 years [IQR 4.3‐9.4] (Table 2). Overall, 138 (74.3%) detected PLC were potentially resectable and 166 (75.5%) patients fulfilled Milan criteria for transplantation. There were no significant differences in PLC characteristics between the construction and validation subsets. The LCR2 population (n = 4053) had more cirrhosis and more PLC than the LCR1 population due to the surveillance of patients with cirrhosis by AFP (Tables S1 and S2).
Table 2.
Characteristics of cancer detected during follow‐up in the populations without contemporaneous cancer at inclusion
| Characteristics of LCR1 population without contemporaneous PLC | Number (%) |
|---|---|
| Included | 9892 (100) |
| Missing liver cancer data | 0 |
| No liver cancer | 9571 (97.8) |
| Total primary liver cancer | 221 (2.2) |
| Retrospective <−1 year | 0 (0) |
| Contemporaneous (−1 to +1 year) | 0 (0) |
| Incident >1 year (not actuarial) | 221 (2.2) |
| Between 1 year and 5 years | 109 (1.1) |
| Total death (not actuarial) | 1360 (13.8) |
| Total transplantation | 130 (1.3) |
| Primary liver cancer | 221 |
| Follow‐up median (IQR) year | 5.9 (4.3‐9.4) |
| Hepatocellular/Cholangio‐carcinoma/Mixed | 211/8/2 |
| Death (not actuarial) | 114 (51.6) |
| Liver Transplantation | |
| Before inclusion/After inclusion/No transplantation | 0 (0)/38 (17.2)/183 (82.8) |
| Stage of fibrosis | |
| F0/F1/F2/F3/F4 | 15 (6.8) /17 (7.7) /14 (6.4) 38 (17.3) 137 (61.8) |
| Gender: Female/Male | 166 (75.1)/54 (24.6)/167 (75.4) |
| Ethnicity: Asian/Caucasian/North‐Africa Middle‐East/Subsaharan/Missing | 19 (8.6)/144 (65.0)/29 (13.2)/29 (13.2)/0 |
| Liver disease: ALD/CHB/CHC/MLD/Other | 29 (13.1)/32 (14.6)/127 (57.3)/20 (9.1)/13 (5.9) |
| Type 2 diabetes: Yes/No | 46 (20.9)/175 (79.1) |
| Alcohol excess: Yes/No | 49 (22.3)/172 (77.7) |
| HIV: Yes/No/Missing | 20 (10.0)/183 (90.0)/18 |
| Sustained viral suppression: Yes/No or not applicable | 61 (27.7) 160 (72.3) |
| Tumour type: Uninodular/2 or 3 nodules/>3 nodules/Infiltrating/Missing | 106 (57.0)/50 (26.9)/25 (13.4)/5 (2.7)/34 |
| Diameter largest (mm) ≤30/31‐50/>50/missing or infiltrate | 130 (71.4)/31 (17.1)/21 (11.5)/38 |
| Portal thrombosis: yes/no/missing | 25 (13.4)/162 (86.6)/33 |
| Milan criteria: yes/no/missing | 166 (75.5)/54 (24.5)/0 |
| AFP level when diagnosed ng/mL: <10/10‐20/20‐120/>120/missing | 69 (33.0)/31 (14.8)/43(20.6)/66 (31.6)/11 |
| PLC treatment: curative intention/palliative intention/missing | 138 (74.3)/47 (25.7)/35 |
Characteristics were not significantly different between construction and validation subsets.
3.1. Construction and validation of LCR1 and LCR2
The proportional hazards assumption for the six components was validated (Figure S1), and the calibration plot was acceptable for the 10‐year follow‐up (Figure S2).
3.1.1. First aim
The AUROCt of LCR1 constructed according to the weights of the six components of the construction subset (Table S3), was 0.800 (0.724‐0.877) in the construction and 0.799 (0.736‐0.861) in the validation subsets, a nonsignificant difference (P = 0.95) (Table S4).
In the integrated database of 8497 patients without cirrhosis, the overall AUROCt of LCR1 was 0.781 (0.728‐0.834) (Table S5). The optimal cut‐off was 0.015. Among 5472 patients without cirrhosis with low‐LCR1 (<0.015), 13 PLC occurred, representing a 99.6% (95% CI 99.3‐99.8) 10‐year survival without PLC, vs 61 with high LCR1 (≥0.015) out of 3025 a survival without cancer = 95.9% (95% CI 94.8‐97.0) (P < 0.001) (Figure 3A).
Figure 3.
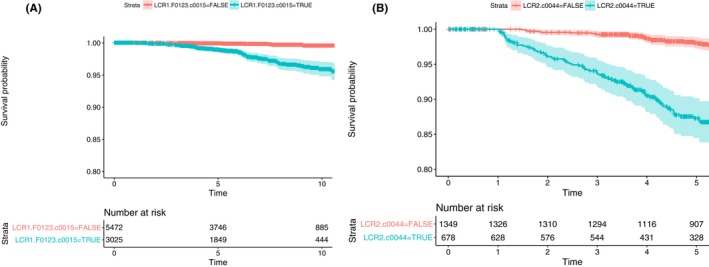
Survival without primary liver cancer according to LCR1 and LCR2 cut‐offs. A, 10‐year survival without primary liver cancer according to low (<0.015 optimal cut‐off) LCR1, vs high (≥0.015 optimal cut‐off) LCR1. Among patients without cirrhosis with low‐LCR1, 13 cancer occurred, representing a 99.6% (95% CI 99.3‐99.8) 10‐year survival without cancer, vs 61 with high LCR1, survival without cancer = 95.9% (95% CI 94.8‐97.0) (P < 0.001). B, Five‐year survival without primary liver cancer according to low (<0.044 optimal cut‐off) LCR2, vs high (≥0.044 optimal cut‐off) LCR2. Among patients selected by LCR1 (without cirrhosis or with cirrhosis) but a low‐LCR2 (<0.044), at 5 years 23 PLC occurred, a survival without cancer = 98.4% (95% CI 97.7‐99.0), vs 69 with high LCR2 (≥0.044) out of 681 a survival without cancer = 87.3% (95% CI 84.5‐90.2) (P < 0.001)
3.1.2. Second aim
The AUROCt of LCR2, was higher than that of AFP alone, in the integrated data base (n = 4053) 0.869 (0.833‐0.904) vs 0.718 (0.664‐0.772; P < 0.001). In the context of use of 2027 patients with cirrhosis (n = 755) or without cirrhosis but LCR1 above optimal cut‐off (n = 1272), the AUROCt of LCR2 was 0.796 (0.749‐0.843) vs 0.696 (0.639‐0.752) for AFP alone (P < 0.001). The optimal cut‐off was 0.044.
Among patients selected by LCR1 (without cirrhosis or with cirrhosis) but a low‐LCR2 (<0.044), at 5 years 23 PLC occurred, a survival without cancer = 98.1% (95% CI 97.3‐98.9), vs 69 with high LCR2 (≥0.044) out of 681 a survival without cancer = 87.3% (95% CI 84.4‐90.1) (P < 0.001) (Figure 3B).
3.1.3. Third aim
The possible efficiency of surveillance of more patients, including those without cirrhosis at high risk of cancer, was shown when the LCR1 and LCR2 tests were applied retrospectively to the 4053 cases with both tests. The algorithm “(F4‐or‐LCR1 ≥ optimal cut‐off)‐then‐LCR2” reached a NSS = 12 and a negative predictive value = 99.5% (2105/2026) (Figure 2B) vs NSS = 7 (755/113) and a negative predictive value = 98.0% (3233/3298) for the standard surveillance (Figure 2A).
In 1779 patients aged 50 or older, the algorithm “(F4‐or‐LCR1 ≥ optimal cut‐off)‐then‐LCR2”, reached a NNS = 10 and negative predictive value = 100% (Figure 2D) vs NNS = 5, but much lower negative predictive value (96.8%) for standard surveillance (Figure 2C).
3.2. Sensitivity analyses according to the cirrhosis definitions
In cases with LCR1 the presence of cirrhosis was obtained by elastography, biopsy, and one of these two methods in 2897, 895, and 3552 cases, and in 1858, 462, and 2160 cases, with LCR2, respectively. Results were similar to those observed using the FibroTest for the definition of cirrhosis, with the AUROCt of LCR1 range = 0.802‐0.825, and LCR2 range = 0.780‐0.850 (Table S5).
3.3. Sensitivity analyses according to the main patient characteristics
The characteristics associated with cirrhosis (defined using FibroTest or biopsy) are presented in Table S6a‐c and can be compared to those associated with PLC in Table S7a,b. Although HIV was associated with cirrhosis, it was not predictive of PLC, suggesting a benefit from HIV treatment. Although it was not associated with cirrhosis, the presence of diabetes was predictive of PLC, suggesting a mechanism independent of the progression of fibrosis.
3.4. Other sensitivity analyses
The AUROCt's of LCR1 and LCR2 were not different according to the different liver diseases and ethnicities (Table S8), or with the exclusion of eight cases with cholangiocarcinoma (data not shown).
For the diagnosis of contemporaneous PLC (121/4047), the AUROC of LCR2 (0.905; 0.875‐0.928) was higher (P < 0.001) than that of AFP (0.796; 0.741‐0.840) due to the increase in sensitivity (Table S9).
Repeated measurements of LCR1 were performed in 3931 patients, 3.6 years (3.6‐7.0) after inclusion (Table S10a). An improvement in LCR1 for at least one quartile was observed in 245 (6.2%) cases, and was strongly associated with an improvement of necrosis and inflammation assessed by ALT in uni and multivariate analyses (odds ratio = 19.8; 13.4‐29.3; P < 0.001) after adjustment for inclusion characteristics. Three PLC occurred in the 245 cases with improved LCR1 (1.2%) vs 140 (3.6%) in the 3646 patients without an improvement in LCR1 (Fisher‐exact test P = 0.03).
A subset of 1856 patients underwent repeated measurements for both LCR1 and LCR2 3.99 years after inclusion (IQR 1.86‐6.62), and the AUROCs remained both significant for the prediction of cancer (130/1856;7% incidence), 0.821 (0.730‐0.834) and 0.837 (0.782‐0.891) respectively and higher than repeated AFP (0.706; 0.637‐0.775) (Table S10b).
4. DISCUSSION
In this study we constructed and internally validated two multi‐analyte blood tests, LCR1, which identified patients without cirrhosis with a high risk of liver cancer at 10 years, and LCR2 which had better performance than AFP for the prediction of the occurrence of PLC at 5 years, both in patients without and with cirrhosis. Our results strongly suggest that assessing LCR1 in patients without cirrhosis, and LCR2 both in patients with cirrhosis or in those without cirrhosis but with high LCR1, should improve the efficiency of the AASLD‐standard surveillance protocol with ultrasonography, with or without AFP and limited to patients with cirrhosis.
This retrospective analysis of a prospective cohort has several strengths and limitations.
4.1. Strengths
First, this study confirmed the performance of these tests in patients without cirrhosis, who represented 86% of the cohort. Thus far, most patients without cirrhosis have been investigated in CHB cohorts.2, 16, 29, 30 Only one study has used elastography, which was found to have predictive value, however, no multi‐analyte test was constructed.29 Although one study constructed a test in patients with CHC without cirrhosis at biopsy, they did not use any validated marker of fibrosis.30
Also, our core analysis only included incident PLC detected after the first year of follow‐up. Thus, incident PLC were early stage with possible resection in 80%.
Moreover, although our population was selected from a tertiary centre, there was a broad spectrum of patient characteristics, including all stages of fibrosis (48% without fibrosis), different causes of liver disease, ethnicities, and comorbidities. Performance was similar in all these subsets. It is true that our cohort was designed 20 years ago to validate the performance of non‐invasive fibrosis biomarkers with close biological surveillance of patients with cirrhosis even if twice less AFP were performed. We also compare this new surveillance to the standard‐AASLD surveillance, which is still recommended in USA in the 2018 guidelines. Therefore, we recognise that the limitation was that we could not compare to recommended surveillance of the European Association for the Study of Liver disease (EASL) which extended the recommendation to pre‐cirrhotic stage in 2012 and to high‐risk patients with CHB according to a combination of simple characteristics in 2018.3, 31 Because of this particular context of use, and according to the small number of incident PLC, external and prospective validations should be performed, including also the EASL‐standard surveillance as comparator.
Nevertheless, the prospective follow‐up was long enough to obtain a sufficient number of events and to validate repeated test performances in 1856 patients (Table S10). In another study, the estimated 10‐year incidence of PLC was 4.8% in HBV Asian male carriers without metabolic factors.16 When we analysed our subset of Asian males without type‐2 diabetes, the 10‐year incidence of cancer (7/227) was similar, ie 4.2% (0.8‐6.5).
Fifth, we combined factors linked to PLC by different potential mechanisms. Whereas GGT had similar risk ratios in patients with and without cirrhosis,17, 18 ApoA1 and haptoglobin potential markers of hepatoprotection, had a higher risk ratio for predicting PLC in patients without cirrhosis than in those with cirrhosis (Table S3).
Thus, LCR1 was a sensitive test that identified high‐risk cases with no specific marker of PLC and independently of the presence of cirrhosis. Furthermore, the specificity of LCR2, which combined the components of LCR1 with AFP, the specific AASLD‐standard PLC marker, was higher than AFP alone, without decreasing the sensitivity.
The present strategy could be further improved with other available specific PLC markers. A recent study combined proteins and genetic biomarkers (CancerSEEK) to increase sensitivity without decreasing specificity for the detection of contemporaneous solid tumours. This test had an AUROC of 0.910 (0.900‐0.920).32 The AUROC for LCR2 in our study was similar for the diagnosis of contemporaneous PLC, ie 0.905 (0.874‐0.928) (Table S9). Appropriate comparisons must be direct and in the same patients. However, our analysis validated LCR2 for incident PLC using patients with liver disease as controls rather than healthy controls, which may have artificially increased the performance of CancerSeek.31 It should be noted that two of the CancerSEEK components, the tissue inhibitor of metalloproteinases‐1, and the hepatocyte growth factor, are connected to the two proteins used in LCR1, A2M, and haptoglobin.32, 33
Finally, LCR1 and LCR2 combined simple, available, and affordable components, in which the risks of false positive and negative are well known.
4.2. Limitations
First, the applicability of this predictive model is limited by the lack of external validation. We focused on the construction of LCR1 as a very early marker in patients without cirrhosis, according to the possible but not confirmed increase in the occurrence of PLC in CHB carriers2 and in NAFLD patients without cirrhosis, including obese patients and type‐2 diabetics.34 There is an unmet need to validate a new test in patients without cirrhosis. LCR1 has no clinical interest in patients with cirrhosis, as this condition is already known to be a main risk factor of PLC. LCR2 is of clinical interest in both patients without cirrhosis and a high LCR1 was well as in patients with cirrhosis.
We also acknowledge that we have constructed biomarkers that are significant, whatever the cause of liver disease. Therefore, we did not include other potential components that could have additional predictive value for a single liver disease such as HBV or HCV markers or a family history of HCC.2, 3, 31
In addition, we did not analyse the predictive value of evolving risk factors during follow‐up, such as alcohol intake or diabetes. However, test performances persisted in the large subset that received repeated testing. We also did not analyse the predictive value of steatosis, being overweight, tobacco, coffee, chocolate, or cannabis consumption, physical exercise, or long‐term drug use, all of which may be associated with fibrosis or the risk of PLC. However, GGT was highly associated with the risk of PLC, probably due to its association with cytotoxicity factors such as alcohol and metabolic factors.16, 17, 18 Indeed, the presence of type‐ 2‐diabetes was predictive of PLC (Table S7), although it was not associated with cirrhosis at inclusion, suggesting a mechanism independent of the progression of fibrosis. The association between non‐alcoholic fatty liver disease and the risk of hepatocellular cancer, was not validated in a systematic review35 but it was strongly suspected in patients without cirrhosis.34
Several known or unknown factors may be associated with the risk of PLC during a 10‐year follow‐up. In this study, the aim of LCR1 was to construct a very early sensitive marker of the risk of PLC, in a pragmatic context of use, assuming the possible variability due to these factors. In order to homogenise a criterion of response appropriate for the different liver diseases (viral suppression, diabetic treatment, weight, or alcohol consumption) during the follow‐up, we used ALT transaminase as a marker of necro‐inflammatory activity. Results showed a very high association between the improvement of LCR1 and those of ALT, as well as CHC as a cause of liver disease, in line with the beneficial effect of chronic viral suppression in these patients. In this large cohort, the proportional hazard assumption was validated, and no significant covariates were identified, with only a small age effect which should be checked in external validation. The incidence of cholangiocarcinoma was too small and largest cohort is needed for validating the tests for this PLC subset.
When considering a screening test, once must consider the benefits and harms, including the false positive impact.3, 36 We did not perform a cost‐efficiency analysis, but the simple analysis of the number needed to screen, and the negative predictive value suggested that the surveillance of patients without cirrhosis by the algorithm combining LCR1 and LCR2 could be compared to the standard including only cirrhosis.
In patients 50 years of age or older, the number of patients to be screened for one cancer detected raised from 5 (AASLD‐standard surveillance) (Figure 2C) to 10 using “(F4‐or‐LCR1 ≥ optimal cut‐off)‐then‐LCR2)” algorithm(Figure 2D). However, the negative predictive value of this simple algorithm reached 100% (99.2–100) vs 96.8% (95.8–97.7; P < 0.001) using AASLD‐standard surveillance.
Another limitation could be that surveillance is cost effective when PLC annual incidence is above 1%.22, 36 Here, in the population with LCR1 and LCR2, the 15 years incidence was 13% (95% CI 10%–16%), that is 0.9% after exclusion of the first year where PLC were not included and 1.1% if restricted to patients older than 50 years.
Diagnosis of PLC at early stage is susceptible to biases such as lead‐time bias (apparent improvement of survival because of an anticipated diagnosis, mainly occurring in follow‐up shorter than 5 years) and length time bias (over‐representation of slower‐growing tumours).3, 37 Here the risk was minimal, as LCR1 was not designed to diagnose a small cancer, but to identify risk profiles 10 years before the occurrence of cancer, including patients without cirrhosis. For LCR2, the endpoint was at 5 years, but all PLC occurring the first year were not included, and same performances were observed at 10 or 15 years. Moreover, the comparator AFP shared the same risk of bias than LCR2.
We acknowledge also that only 41% of our cases underwent AFP measurements, now more recommended together with ultrasonography.22, 37, 38 Other combinations should also be tested with imaging and forthcoming new direct PLC makers. The multi‐analyte test LCR2, used the LCR1 components combined with AFP alone as a PLC specific marker, but we did not combine second generation PLC biomarkers.3, 36
In conclusion, in patients with chronic liver disease we constructed two tests with significant performances, LCR1 for the early stratification of cancer risk in noncirrhotic patients and LCR2 for increasing the sensitivity of AFP alone. External validation should permit to extend imaging surveillance after the age of 50, to patients without cirrhosis with high LCR1, and to confirm the increased performance of LCR2 vs AFP alone, in patients with cirrhosis and in patients without cirrhosis but with high LCR1.
AUTHORSHIP
Guarantor of the article: TP.
Author contributions: Experiment conception and design: TP. Experiment performance: TP, VP, JM, MR, PL, RP, LB, FC, VT, LF, OL, DE, OS, ES, MAV, FIB, OR, DT, VR. Data analysis: TP, OD, MM, YN, AN, FD. Drafting of the paper: TP, OD, CH.
All authors approved the final version of the manuscript.
Supporting information
ACKNOWLEDGEMENTS
Declaration of personal interests: Thierry Poynard is the inventor of LCR1 and LCR2 tests, founder of BioPredictive; the patents belong to the public organisation Assistance Publique‐Hôpitaux de Paris. Valentina Peta, Olivier Deckmyn, Mona Munteanu, Yen Ngo, An Ngo, and Fabienne Drane are full employees of BioPredictive. The other authors have nothing to declare: Joseph Moussalli, Marika Rudler, Pascal Lebray, Raluca Pais, Luminita Bonyhay, Frederic Charlotte, Vincent Thibault, Laetitia Fartoux, Olivier Lucidarme, Daniel Eyraud, Olivier Scatton, Eric Savier, Marc Antoine Valantin, Françoise Imbert‐Bismut, Olivier Rosmorduc, Chantal Housset, Dominique Thabut, and Vlad Ratziu. Writing assistance: none.
Poynard T, Peta V, Deckmyn O, et al. LCR1 and LCR2, two multi‐analyte blood tests to assess liver cancer risk in patients without or with cirrhosis. Aliment Pharmacol Ther. 2019;49:308–320. 10.1111/apt.15082
The Handling Editor for this article was Professor Peter Hayes, and it was accepted for publication after full peer‐review.
Funding information
Valentina Peta, Olivier Deckmyn, Mona Munteanu, Yen Ngo, An Ngo, and Fabienne Drane are full employee of BioPredictive, HECAM C1410019W.
REFERENCES
- 1. Akinyemiju T, Abera S, Ahmed M, et al. The burden of primary liver cancer and underlying etiologies from 1990 to 2015 at the global, regional, and national level. JAMA Oncol. 2017;3:1683‐1691. [DOI] [PMC free article] [PubMed] [Google Scholar]
- 2. Wong VW, Janssen HL. Can we use HCC risk scores to individualize surveillance in chronic hepatitis B infection? J Hepatol. 2015;63:722‐732. [DOI] [PubMed] [Google Scholar]
- 3. EASL . Practice guidelines: management of hepatocellular carcinoma. J Hepatol. 2018;69:182‐236. [DOI] [PubMed] [Google Scholar]
- 4. Imbert‐Bismut F, Ratziu V, Pieroni L, et al. Biochemical markers of liver fibrosis in patients with hepatitis C virus infection: a prospective study. Lancet. 2001;357:1069‐1075. [DOI] [PubMed] [Google Scholar]
- 5. Houot M, Ngo Y, Munteanu M, et al. Systematic review with meta‐analysis: direct comparisons of biomarkers for the diagnosis of fibrosis in chronic hepatitis C and B. Aliment Pharmacol Ther. 2016;43:16‐29. [DOI] [PMC free article] [PubMed] [Google Scholar]
- 6. Chou R, Wasson N. Blood tests to diagnose fibrosis or cirrhosis in patients with chronic hepatitis C virus infection: a systematic review. Ann Intern Med. 2013;158:807‐820. [DOI] [PubMed] [Google Scholar]
- 7. Xu XY, Kong H, Song RX, et al. The effectiveness of noninvasive biomarkers to predict hepatitis B‐related significant fibrosis and cirrhosis: a systematic review and meta‐analysis of diagnostic test accuracy. PLoS ONE. 2014;9:e100182. [DOI] [PMC free article] [PubMed] [Google Scholar]
- 8. Thiele M, Madsen BS, Hansen JF, et al. Accuracy of the enhanced liver fibrosis test vs FibroTest, elastography and indirect markers in detection of advanced fibrosis in patients with alcoholic liver disease. Gastroenterology. 2018;5085:30016‐30017. [DOI] [PubMed] [Google Scholar]
- 9. Munteanu M, Tiniakos D, Anstee Q, et al. Diagnostic performance of FibroTest, SteatoTest and ActiTest in patients with NAFLD using the SAF score as histological reference. Aliment Pharmacol Ther. 2016;44:877‐889. [DOI] [PMC free article] [PubMed] [Google Scholar]
- 10. Poynard T, Vergniol J, Ngo Y, et al. Staging chronic hepatitis C in seven categories using fibrosis biomarker (FibroTest™) and transient elastography (FibroScan®). J Hepatol. 2014;60:706‐714. [DOI] [PubMed] [Google Scholar]
- 11. Poynard T, Vergniol J, Ngo Y, et al. Staging chronic hepatitis B into seven categories, defining inactive carriers and assessing treatment impact using a fibrosis biomarker (FibroTest®) and elastography(FibroScan®). J Hepatol. 2014;61:994‐1003. [DOI] [PubMed] [Google Scholar]
- 12. Melvin JC, Holmberg L, Rohrmann S, Loda M, Van Hemelrijck M. Serum lipid profiles and cancer risk in the context of obesity: four meta‐analyses. J Cancer Epidemiol. 2013;2013:823849. [DOI] [PMC free article] [PubMed] [Google Scholar]
- 13. Katzke VA, Sookthai D, Johnson T, Kühn T, Kaaks R. Blood lipids and lipoproteins in relation to incidence and mortality risks for CVD and cancer in the prospective EPIC‐Heidelberg cohort. BMC Med. 2017;15:218. [DOI] [PMC free article] [PubMed] [Google Scholar]
- 14. Borlak J, Chatterji B, Londhe KB, et al. Serum acute phase reactants hallmark healthy individuals at risk for acetaminophen‐induced liver injury. Genome Med. 2013;5:86. [DOI] [PMC free article] [PubMed] [Google Scholar]
- 15. Peta V, Tse C, Perazzo H, et al. Serum apolipoprotein A1 and haptoglobin, in patients with suspected drug‐induced liver injury (DILI) as biomarkers of recovery. PlosOne. 2017;12:e0189436. [DOI] [PMC free article] [PubMed] [Google Scholar]
- 16. Yu MW, Lin CL, Liu CJ, et al. Influence of metabolic risk factors on risk of hepatocellular carcinoma and liver‐related death in men with chronic hepatitis B: a large cohort study. Gastroenterology. 2017;153:1006‐1017. [DOI] [PubMed] [Google Scholar]
- 17. Xia J, Song P, Sun Z, et al. Advances of diagnostic and mechanistic studies of γ‐glutamyl transpeptidase in hepatocellular carcinoma. Drug Discov Ther. 2016;10:181‐187. [DOI] [PubMed] [Google Scholar]
- 18. Ganne‐Carrié N, Layese R, Bourcier V, et al. Nomogram for individualized prediction of hepatocellular carcinoma occurrence in hepatitis C virus cirrhosis (ANRS CO12 CirVir). Hepatology. 2016;64:1136‐1147. [DOI] [PubMed] [Google Scholar]
- 19. Rehman AA, Ahsan H, Khan FH. α‐2‐Macroglobulin: a physiological guardian. J Cell Physiol. 2013;228:1665‐1675. [DOI] [PubMed] [Google Scholar]
- 20. Smorenburg SM, Griffini P, Tiggelman AB, et al. Alpha2‐Macroglobulin is mainly produced by cancer cells and not by hepatocytes in rats with colon carcinoma metastases in liver. Hepatology. 1996;23:560‐570. [DOI] [PubMed] [Google Scholar]
- 21. Thieme R, Kurz S, Kolb M, et al. Analysis of alpha‐2 macroglobulin from the long‐lived and cancer‐resistant naked mole‐rat and human plasma. PLoS ONE. 2015;10:e0130470. [DOI] [PMC free article] [PubMed] [Google Scholar]
- 22. Marrero JA, Kulik LM, Sirlin C, et al. Diagnosis, staging, and management of hepatocellular carcinoma: 2018 Practice Guidance by the American Association for the Study of Liver Diseases. Hepatology. 2018;68:723‐750. [DOI] [PubMed] [Google Scholar]
- 23. Mazzaferro V, Regalia E, Doci R, et al. Liver transplantation for the treatment of small hepatocellular carcinomas in patients with cirrhosis. N Engl J Med. 1996;334:693‐699. [DOI] [PubMed] [Google Scholar]
- 24. Collins SG, Ogundimu EO, Altman DG. Sample size considerations for the external validation of a multivariable prognostic model: a resampling study. Stat Med. 2016;35:214‐226. [DOI] [PMC free article] [PubMed] [Google Scholar]
- 25. R Core Team . R: A Language and Environment for Statistical Computing. Vienna, Austria: R Foundation for Statistical Computing; 2015. https://www.R-project.org/. [Google Scholar]
- 26. Castéra L, Vergniol J, Foucher J, et al. Prospective comparison of transient elastography, FibroTest, APRI, and liver biopsy for the assessment of fibrosis in chronic hepatitis C. Gastroenterology. 2005;128:343‐350. [DOI] [PubMed] [Google Scholar]
- 27. Lambert J, Halfon P, Penaranda G, Bedossa P, Cacoub P, Carrat F. How to measure the diagnostic accuracy of noninvasive liver fibrosis indices: the area under the ROC curve revisited. Clin Chem. 2008;54:1372‐1378. [DOI] [PubMed] [Google Scholar]
- 28. Hintze JL. NCSS 2011 User Guide. Number Cruncher Statistical Systems Software NCSS. Kaysville, UT: NCSS; 2011. [Google Scholar]
- 29. Jung KS, Kim SU, Ahn SH, et al. Risk assessment of hepatitis B virus‐related hepatocellular carcinoma development using liver stiffness measurement (FibroScan). Hepatology. 2011;53:885‐894. [DOI] [PubMed] [Google Scholar]
- 30. Chang KC, Wu YY, Hung CH, et al. Clinical‐guide risk prediction of hepatocellular carcinoma development in chronic hepatitis C patients after interferon‐based therapy. Br J Cancer. 2013;109:2481‐2488. [DOI] [PMC free article] [PubMed] [Google Scholar]
- 31. Papatheodoridis GV, Idilman R, Dalekos GN, et al. The risk of hepatocellular carcinoma decreases after the first 5 years of entecavir or tenofovir in Caucasians with chronic hepatitis B. Hepatology. 2017;66:1444‐1453. [DOI] [PubMed] [Google Scholar]
- 32. Cohen JD, Li L, Wang Y, et al. Detection and localization of surgically resectable cancers with a multi‐analyte blood test. Science. 2018;359:926‐930. [DOI] [PMC free article] [PubMed] [Google Scholar]
- 33. Roeb E. Matrix metalloproteinases and liver fibrosis (translational aspects). Matrix Biol. 2018;68:463‐473. [DOI] [PubMed] [Google Scholar]
- 34. White DL, El‐Serag HB. Association between nonalcoholic fatty liver disease and risk for hepatocellular cancer, based on systematic review. Clin Gastroenterol Hepatol. 2012;10:1342‐1359. [DOI] [PMC free article] [PubMed] [Google Scholar]
- 35. Guillén MI, Gómez‐Lechón MJ, Nakamura T, et al. The hepatocyte growth factor regulates the synthesis of acute‐phase proteins in human hepatocytes: divergent effect on interleukin‐ 6‐stimulated genes. Hepatology. 1996;23:1345‐1352. [DOI] [PubMed] [Google Scholar]
- 36. Stine JG, Wentworth BJ, Zimmet A, et al. Systematic review with meta‐analysis: risk of hepatocellular carcinoma in non‐alcoholic steatohepatitis without cirrhosis compared to other liver diseases. Aliment Pharmacol Ther. 2018;00:1‐8. [DOI] [PMC free article] [PubMed] [Google Scholar]
- 37. Tzartzeva K, Obi J, Rich NE, et al. Surveillance imaging and alpha fetoprotein for early detection of hepatocellular carcinoma in patients with cirrhosis: a meta‐analysis. Gastroenterology. 2018;154:1706‐1718. [DOI] [PMC free article] [PubMed] [Google Scholar]
- 38. Fateen W, Ryder SD. Screening for hepatocellular carcinoma: patient selection and perspectives. J Hepatocell Carcinoma. 2017;4:71‐79. [DOI] [PMC free article] [PubMed] [Google Scholar]
Associated Data
This section collects any data citations, data availability statements, or supplementary materials included in this article.
Supplementary Materials