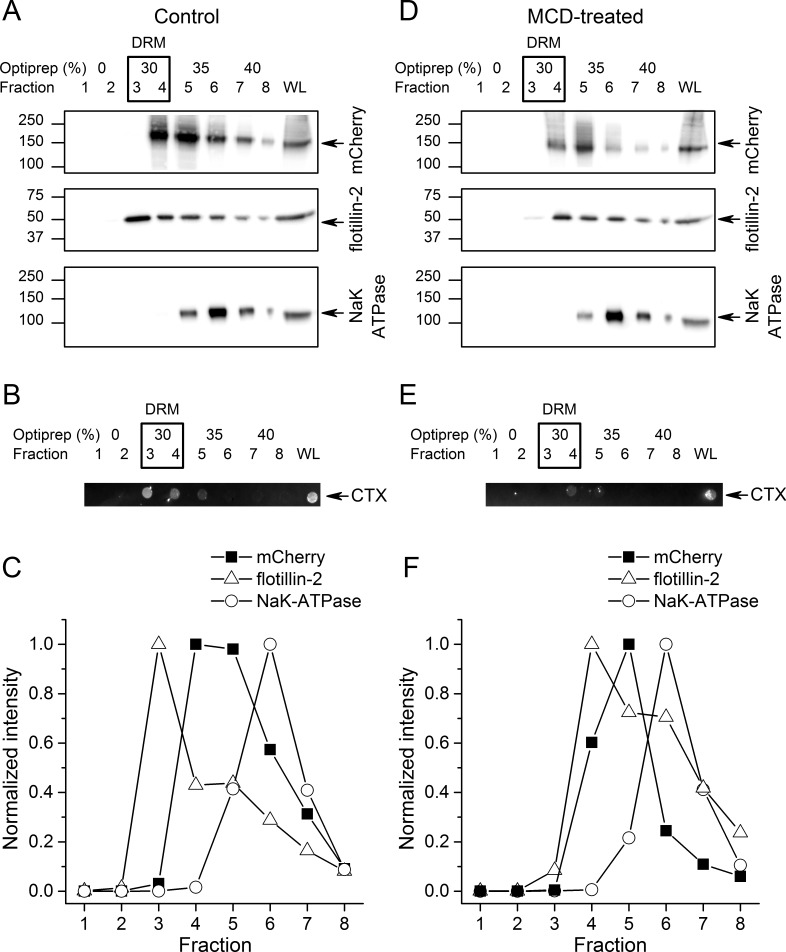
Figure 2. TRPA1 localizes in cholesterol-rich domains.
(A) Immunoblots of different fractions obtained after detergent-free lipid raft preparation presenting mTRPA1-mCherry immunoreactivity associated with detergent-resistant membrane (DRM) fractions and whole cell lysate (WL) in HEK293T-mTRPA1-mCherry cells (top panel); immunoreactivity against endogenous lipid raft marker flotillin-2 (middle panel); immunoreactivity against NaK-ATPase as a marker of non-raft membrane protein (bottom panel). (B) Dot blot presenting immunoreactivity associated with fluorescent cholera toxin subunit B (CT-B). (C) Quantitative analysis of density gradients for mCherry, flotillin-2 and NaK-ATPase. (D) Cholesterol depletion of HEK293T-mTRPA1-mCherry cells by treatment with 10 mM MCD interrupts association of TRPA1 (top panel) and flotillin-2 (middle panel) with the detergent-resistant membrane fractions. NaK-ATPase expression remains similar to control condition. (E) Dot blot presenting deficiency of fluorescent cholera toxin subunit B binding after lipid raft disruption. (F) Quantitative analysis of density gradients for mCherry, flotillin-2 and NaK-ATPase after MCD treatment reveals a shift of mTRPA1-mCherry and flotillin-2 to higher density gradients. Equal volumes of each collected fraction were determined by SDS-PAGE electrophoresis and blotted with specific anti-mCherry, anti-flotillin-2 or anti-NaK-ATPase antibodies.


