Abstract
Studies of visual temporal frequency preference typically examine frequencies under 20 Hz and measure local activity to evaluate the sensitivity of different cortical areas to variations in temporal frequencies. Most of these studies have not attempted to map preferred temporal frequency within and across visual areas, nor have they explored in detail, stimuli at gamma frequency, which recent research suggests may have potential clinical utility. In this study, we address this gap by using functional magnetic resonance imaging (fMRI) to measure response to flickering visual stimuli varying in frequency from 1 to 40 Hz. We apply stimulation in both a block design to examine task response and a steady-state design to examine functional connectivity. We observed distinct activation patterns between 1 Hz and 40 Hz stimuli. We also found that the correlation between medial thalamus and visual cortex was modulated by the temporal frequency. The modulation functions and tuned frequencies are different for the visual activity and thalamo-visual correlations. Using both fMRI activity and connectivity measurements, we show evidence for a temporal frequency specific organization across the human visual system.
Keywords: connectivity, fMRI, temporal frequency, thalamo-visual correlation, visual frequency
1. Introduction
Temporal frequency is an important attribute of any visual input. The study of the tuning properties of the visual system is fundamental towards understanding the processing of visual information in the human brain. Previous research has primarily focused on localized responses to frequencies below 20 Hz, neglecting higher frequency stimuli, and the effect of temporal frequency on connectivity between brain regions. Yet, recent work by Iaccarino et al. (2016) demonstrated that 40 Hz visual stimulation not only activates visual cortex, but also reduces amyloid plaque levels in a mouse model of Alzheimer’s disease. These observations motivate a closer examination of how the brain responds to a broader range of temporal frequencies of visual stimuli.
Earlier studies of visual temporal frequency focused primarily on estimating regional mean frequency preference for a limited set of regions-of-interest (ROI) involved in visual processing. Some animal studies suggest a preference for higher temporal frequency in the lateral geniculate nucleus (LGN) of cats (Orban et al., 1981; Yen et al., 2011) and the superior colliculus (SC) of rats (Van Camp et al., 2006) relative to that of primary visual cortex. Conversely, in humans, frequency tuning curves obtained using fMRI seem to not differ across many different visual areas, including V1/2/3, V3A/B, and V4/5 (Singh et al., 2000). Even when using stimuli containing very different spatial content ranging from patterned/unpatterned flickering to moving gratings, the mean amplitudes of activity throughout human visual cortex is usually reported to peak at 8–10 Hz (Fawcett et al., 2004; Fox and Raichle, 1984; Singh et al., 2003). This observation holds across different imaging modalities (EEG/MEG, PET and fMRI). One plausible reason for such unexpected spatial homogeneity in temporal frequency tuning property across visual cortex in humans might be that ROI-level explorations treat visual areas as homogeneous structures, disregarding potential variability in temporal frequency preference within each region (e.g., across voxels). In other words, lacking fine-grained voxel-wise explorations, the heterogeneity within each visual area and the global and local organization of the frequency preference could be missed.
To address this limitation of early studies, much effort has been devoted to mapping the temporal frequency preference of visual regions on a voxel-by-voxel basis. Khaytin et al. (2008) mapped the temporal frequency sensitivity in V1 of Otolemur garnetti with optical imaging and found that temporal frequency preference is arranged uniformly across V1. Using fMRI, Yen et al. (2011) mapped the preferred temporal frequency in early visual areas in cats, and also showed that the preferred frequency is homogenous within primary visual cortical areas 17 and 18 with a slight increase of preferred frequency in the peripheral visual field. However, a higher resolution (0.75×0.75 mm2) fMRI study in humans reported that low and high temporal frequency domains are clustered separately within V1 (Sun et al., 2007). Another high resolution fMRI study showed a strip-based subdivision between slow and fast temporal frequencies in human V2 and V3 (Dumoulin et al., 2017). All together, these results suggest that, at least in humans, there is some level of heterogeneity in temporal frequency preference within individual visual regions. Unfortunately, a fine detailed map of temporal frequency tuning of these regions is still lacking, since the two above-mentioned human studies only classified voxels into either low or high temporal frequency domains; disregarding the possibility of more subdivisions, or a gradual pattern of frequency preference across some cortical topology. A more expansive approach covering a broader frequency range, and that avoids collapsing frequency tuning profiles into a limited number of brackets may provide additional insights regarding how the temporal-frequency filtering spatially evolves as information travels through visual cortex.
Lastly, another limitation of earlier electrophysiological and function imaging studies of temporal frequency preference is their exclusive focus on local activity when estimating regional tuning temporal-frequency curves. Brain regions in the visual pathway are not isolated, but highly interconnected. Moreover, most visual information enters this processing pathway via the thalamus (Vialatte et al., 2010). As such, the connectivity between thalamus and occipital visual cortex may play an important role in human perception of visual temporal information. To date, little is known about the temporal frequency tuning properties of thalamo-visual connectivity in humans.
In this study, we attempted to address the knowledge gaps described above. We used both blood-oxygenation-level dependent (BOLD) activity and thalamo-visual connectivity to generate preferred temporal frequency maps for the whole human visual system. Because saccades and eye blinks can facilitate human perception of pattern stimulations (Deubel and Elsner, 1986), and even lead to perception of stimuli at very high temporal frequencies that would be invisible without eye movement (Shady et al., 2004), we used flashing stimuli without any spatial pattern. This helps attenuate the potentially confounding effect of eye movements. In addition, previous studies typically explored frequencies under 20 Hz. Here we tested a range of temporal frequencies up to 40 Hz, given prior evidence that such higher frequencies have an impact on cortical processes (Iaccarino et al., 2016).
We find clear evidence of cortical activity for 40 Hz stimulation. We also show distinct patterns of activity for 1 Hz and 40 Hz stimuli, suggestive of an organization of visual areas in terms of temporal-frequency preference. For both visual activity and connectivity, we show evidence for a temporal frequency-specific architecture in the visual system.
2. Materials and methods
2.1. Participants
Twenty right-handed subjects (ten males/ten females; aged 18–50, mean age 26.5) completed this study. All subjects were in good health with no history of neurological disorder and had normal or corrected-to-normal visual acuity. All participants gave their informed consent in compliance with the protocol 93-M-0170 approved by the Institutional Review Board of the National Institute of Mental Health in Bethesda, MD.
2.2. Visual Task
Visual stimulation was generated using PsychoPy v1.84 (Peirce, 2007) and was displayed through an MR-compatible monitor (BOLDscreen 32 in. LCD, Cambridge Research Systems, UK) with a resolution of 1920×1080 pixels and a refresh rate of 120 Hz. Visual stimulation was presented for a specified number of frames to achieve precise stimulus timing. The temporal frequency accuracy of the LCD screen was verified independently using a photodiode for all the stimulation frequencies presented in this study. Subjects laying in the MRI scanner viewed the screen by means of a mirror above their heads.
A visual target detection task was introduced to assure a constant level of vigilance. Subjects were asked to fixate on a blue dot at the center of the screen and press a button with their right index finger when the dot color turned red. The red dot was presented for 200 ms with a random interval between 20 s and 100 s. The button pressing response was recorded using PsychoPy. This vigilance task was embedded within both the block-designed and the steady-state stimulation. If the detection rate for the vigilance task was less than 80%, the data of that run would be discarded.
Visual flickering was generated through alternating the whole screen (21.3°×12.6°) from black to white. Two different experimental paradigms were used with these stimuli.
Block design: Each block-design run started with a 20 s fixation period followed by 20 repetitions of activation/fixation blocks (a 10 s activation block followed by a fixation block of 18.9, 20.6 or 22.3 s). A jittered interstimulus interval (ISI) was used to reduce the expectancy for upcoming stimuli and to improve the statistical efficiency of fMRI response estimates (Dale, 1999). One of five temporal frequencies (1, 5, 10, 20 and 40 Hz) was applied in each activation block. The order of the frequencies was randomized, and each frequency was presented 4 times per run. Seven subjects completed two such block-design runs, and ten subjects completed three runs. Accuracy rate of vigilance detection task was higher than 80% across all runs.
Steady state: In each steady state run, the whole screen flickered for 386 s at one of four temporal frequencies (1, 10, 20 and 40 Hz) with the same vigilance task as during the block-design runs. In addition, there was a control run in which only a static gray screen was presented. The order of the runs was randomized across subjects. Sixteen subjects completed all five runs (four target frequencies plus control condition). For the remaining four subjects, one or two active conditions are missing due to insufficient vigilance (i.e., vigilance task detection rate < 80%).
2.3. Image acquisition
Data was acquired on a Prisma 3T scanner with a head 32-channel head coil (Siemens Healthcare, Erlangen, Germany). Simultaneous multislice (SMS) gradient echo EPI (Moeller et al., 2010) was used with TR/TE 1700/28 ms, flip angle 60°, matrix 90×90, 2.5 mm isotropic voxels, 52 slices, 2 SMS excitation and no in-plane acceleration. Anatomical images were also acquired using a 3D Magnetization-Prepared 2 Rapid Acquisition Gradient Echo (MP2RAGE) sequence with TI1/TI2/TR/TE 700/2500/5000/2.88 ms, flip angle 5°, matrix size 176×240×256, and resolution 1.2×1×1 mm3.
2.4. Image Processing
Data were processed using the AFNI software package (Cox, 1996), FreeSurfer (Fischl, 2012) and MATLAB (Mathworks, Natick, MA). Brain connectivity was visualized using BrainNet Viewer (Xia et al., 2013).
2.4.1. Preprocessing and statistical analysis for the block-designed task
Preprocessing steps on each individual included: discarding the first 8 fMRI volumes from each run to ensure the MRI signal reached a steady state, slice-timing correction, alignment of EPI images to the anatomic images followed by registration to the Montreal Neurological Institute (MNI) standard brain space, head motion correction, spatial smoothing (FWHM = 4 mm), and intensity normalization. Next, linear regression analysis was conducted. Both sustained and transient (onset/offset) responses were modeled. The regressor for sustained BOLD responses was modeled by a boxcar function for the duration of the stimuli; and transient responses were modeled using impulse functions at the start and end of each block. All regressors were convolved with a Gamma variate function. In addition, the following nuisance regressors were included: 6 head motion parameters and slow signal drift modeled with polynomials up to fifth order. Time points were censored from the regression model whenever the Euclidean norm of the motion derivatives exceeded 0.4 mm or when at least 10 % of the brain voxels were seen as outliers from the trend. Subject-level activation maps were generated for the sustained response at each stimulation frequency using cluster-based thresholding (family-wise error (FWE) corrected p < 0.01). Group-level activity maps for the sustained BOLD response were generated using AFNI program 3dttest++, also with cluster-based thresholding (FWE corrected p < 0.01). The transient responses were not used as we focused on the frequency modulation effects that arose during the stimulation rather than the onset or offset of the stimulation.
Following statistical analysis, four different regions of interest (ROI) were defined. These ROI names are used throughout this manuscript:
Low-frequency ROI: voxels where the 1 Hz stimuli induced a significantly larger response amplitude than the mean amplitude caused by 20 Hz and 40 Hz stimuli (group level, FWE corrected p < 0.01);
High-frequency ROI: voxels where the 1 Hz stimuli induced a significantly lower response than the mean activity caused by 20 Hz and 40 Hz stimuli (group level, FWE corrected p < 0.01);
LGN ROI: voxels within the thalamus, activated by visual stimuli at any frequency. Thalamic voxels are estimated using Freesurfer on each subject’s anatomical scan (subject level, uncorrected p < 0.01);
Visual ROI: voxels within occipital cortex activated by visual stimuli at any frequency (group level, FWE corrected p < 0.01).
The first three ROIs were used to show representative frequency tuning curves in block-designed task runs. The visual cortex ROI was used for connectivity analysis in the steady-state stimulation runs.
2.4.2. Preprocessing and correlation analysis of steady-state stimulation
Preprocessing steps on each individual included: discarding the first 15 fMRI volumes from each run to allow the BOLD hemodynamic response to reach a steady state, despiking, slice-timing correction, alignment of EPI images to the anatomic images followed by registration to MNI standard brain space, head motion correction, and spatial smoothing (FWHM = 4 mm). Time points were censored whenever the Euclidean norm of the motion derivatives exceeded 0.3 mm or when at least 10 % of the brain voxels were seen as outliers from the trend. Next, slow signal drifts were modeled with polynomials up to third order. Head motion estimates and their first derivatives, signal from eroded local white matter, and signal from the lateral ventricles (cerebrospinal fluid) were removed through linear regression analysis. The residual signal was used for the following correlation analyses.
In order to reveal which connections are modulated by the temporal frequency of visual stimuli, we conducted a network statistical analysis. We first parcellated the whole brain into 500 nodes using one publicly available atlas (Craddock et al., 2012). For each node, a representative time series was extracted through averaging across all gray matter voxels within that node. Pearson correlation was calculated for each pair of nodes and then Fisher-z transformed. At the group level, the resultant connectivity matrices for 20 subjects at different stimulation conditions were included in a linear mixed effects model using AFNI program 3dLME (Chen et al., 2013). Significant correlation changes were obtained through false discovery rate (FDR) corrected thresholding with p < 0.05.
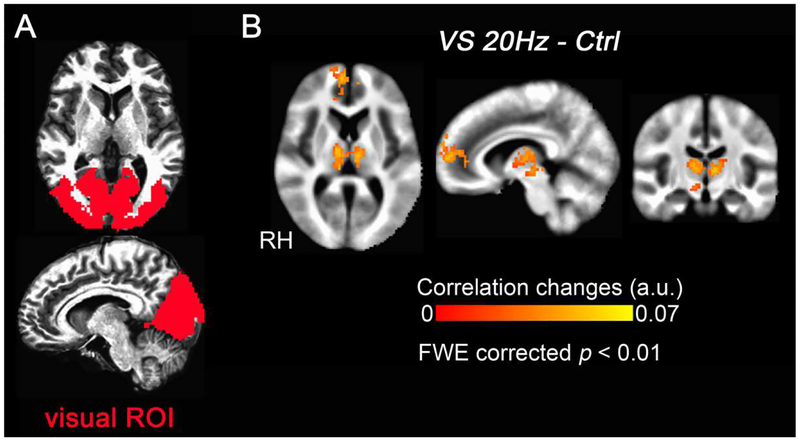
This network statistical analysis revealed changes in functional connectivity as a function of temporal frequency for the pathway between thalamus and visual cortex. In order to map the temporal frequency preference for this connectivity pathway, an intermediate step was performed to define the exact region within thalamus that was modulated by temporal frequency. In particular, we estimated the connectivity of the visual ROI with all gray matter voxels in the brain as follows. First, the time series of each voxel inside the visual ROI were extracted. Next, for each voxel inside gray matter, its correlations with all the voxels belonging to the visual ROI were computed, then transformed to Fisher’s Z values. For each gray matter voxel outside of the visual ROI, the mean positive correlation to all visual ROI voxels was calculated. Group-level analyses were performed with a linear mixed effects model using the AFNI program 3dLME (Chen et al., 2013), and significant correlation changes at each stimulation frequency relative to control were obtained using cluster-based thresholding (FWE corrected p < 0.01). This analysis revealed how the medial thalamus had a significantly enhanced correlation with visual cortex at 20 Hz stimulation (detailed in Results and Fig. 7). We defined this region as the medial thalamus ROI, and used it as the seed region for the connectivity measurement of visual cortex.
Figure 7.
Group-level correlation changes with the visual ROI (N = 20). (A) The activated visual occipital region that was defined as the visual ROI. (B) Compared with the control condition, visual stimulation at 20 Hz (VS 20Hz) significantly increased the correlation between the medial thalamus and the visual ROI. The medial frontal gyrus also shows significantly increased correlation with visual ROI. RH marks the side of right hemisphere.
2.5. Mapping of temporal frequency preference
Voxels in the visual cortex were model fitted and clustered using: (1) The response amplitude at each frequency during block-design stimulation; (2) The correlations with the medial thalamus ROI relative to control during steady-state stimulation.
2.5.1. Model fitting of frequency tuning curve
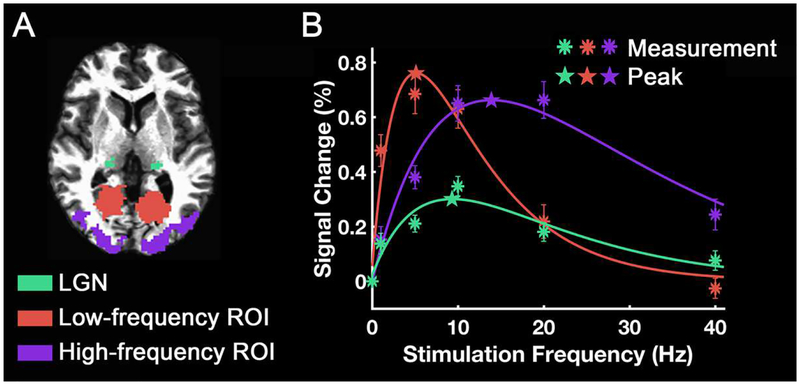
First, the frequency-dependent BOLD signal changes were used to determine the tuning frequency in LGN and visual areas. At each voxel inside the active region, the BOLD signal change vs. stimulation frequency was fitted to a difference of exponentials function (Gegenfurtner et al., 1997; Hawken et al., 1996). Representative fits are shown in Fig. 3B. For voxels with the correlation coefficients of the fitting larger than 0.3, we defined the peak frequency of the fitted curve as where the signal was highest (Yen et al., 2011). These analyses were conducted both at single-subject and group levels.
Figure 3.
Frequency tuning curves of different ROIs. (A) ROI areas. (B) ROI-mean signal change was plotted as a function of stimulation frequency. The asterisks indicate the measured signal changes. The curves are the difference of exponential functions that best fit the data. The stars indicate the peak frequencies of each curve. The error bars indicate ± the standard error of the mean (SEM) across subjects (N = 17).
Frequency-dependent correlations with medial thalamus ROI were also used to determine the preferred frequency. At voxels whose correlations were significantly modulated by visual stimuli at any frequency, we applied a Gaussian function to fit the correlations relative to control vs. the stimulation frequencies (Allison et al., 2001; Yen et al., 2011). For the correlation data, this Gaussian model provided a more reliable fit than the difference of exponentials function. Similarly, the frequency tuning value was not used if the correlation coefficient of the fitting was lower than 0.3.
2.5.2. k-means clustering of frequency preference
Following model fitting, we applied k-means clustering (Goutte et al., 1999) to group areas according to the similarity of their responses across frequencies.
We first input BOLD signal changes at each temporal frequency to the k-means clustering algorithm in MATLAB. This algorithm sorted visual areas into 3 or 4 groups by maximizing within-cluster similarity and between-cluster dissimilarity, using correlation as a distance measure. We performed this analysis on both group and individual levels. Clustering was attempted only using voxels that were significantly active under stimulation at any frequency. In addition, we also applied the same k-means analysis to the correlations with medial thalamus vs. temporal frequencies and restricted the clustering to voxels where correlations with medial thalamus ROI were significantly different between visual stimulation and control.
2.6. Comparison of the temporal frequency preference across different visual ROIs and retinal eccentricities
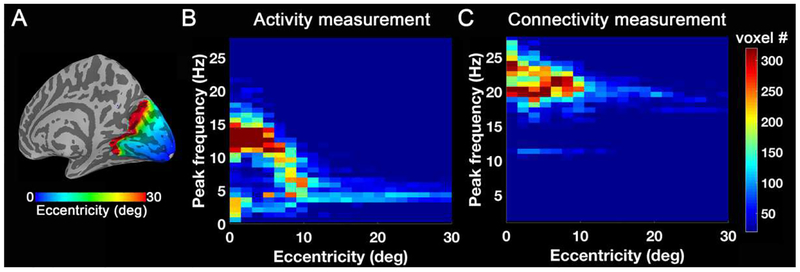
We used an eccentricity template and a visual area template from the retinotopy atlas of Benson et al. (2014). V1/2/3 ROIs were defined by the visual areas template (Benson et al., 2014) and further restricted by the preferred frequency mapping regions. Mean frequency tuning curves were computed for each ROI. Additionally, we computed one-dimensional (1D) histograms for V1/2/3 to show the number of voxels at different preferred temporal frequencies. For the retinal eccentricity domain, we calculated two-dimensional (2D) histograms to show how the preferred temporal frequency is distributed across different eccentricity degrees. Each cell in the 2D histogram plot counts the number of voxels at a given eccentricity and having a certain preferred temporal frequency as shown in Fig. 10.
Figure 10.
2D-histogram across eccentricity and peak frequency. (A) Eccentricity template from Benson et al. (2014). (B) Number of voxels as a function of eccentricity and peak frequency for the group-level preferred frequency map of BOLD signal changes. (C) Number of voxels as a function of eccentricity and peak frequency for the group-level preferred frequency map of correlation changes.
3. Results
3.1. Cortical architecture revealed by frequency-dependent BOLD signal changes
Fig. 1 shows the activation maps for 8 representative subjects. The 1 Hz stimuli caused significant activation across most of the calcarine sulcus (top row), while 40 Hz stimuli resulted in relatively more significant activation in lateral occipital cortex (bottom row). The distinct spatial distribution of activation for 1 Hz and 40 Hz stimuli suggests that calcarine cortex is more sensitive to a lower flicker frequency while lateral occipital cortex responds more strongly to a higher flicker frequency.
Figure 1.
Activation maps from 8 representative subjects. The upper row shows that 1 Hz stimuli caused significant activation across most of the calcarine sulcus, while the bottom row shows that 40 Hz stimuli resulted in relatively more significant activation in lateral occipital cortex.
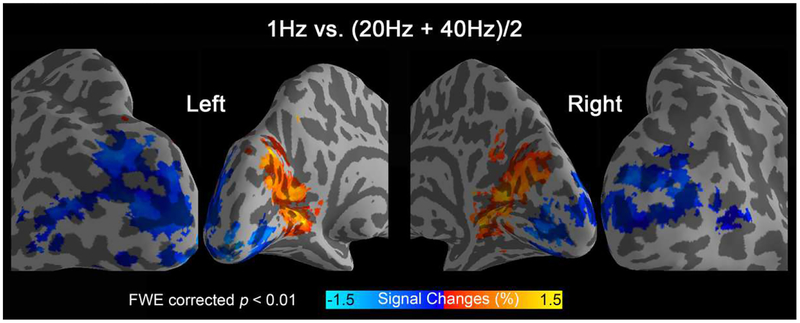
We then compared activity levels for low (1 Hz) verse high stimulation frequencies (20 Hz and 40 Hz) at the group level. Stimulation at low temporal frequency evoked significantly stronger activation in the anterior calcarine region, while stimulation at high temporal frequencies generated significantly higher responses in lateral occipital region (Fig. 2). These two regions were defined as the low-frequency ROI and the high-frequency ROI, respectively, and used later to generate representative tuning curves.
Figure 2.
Group activation differences for low (1 Hz) vs. high (20 Hz and 40 Hz) frequency stimulation (17 subjects).
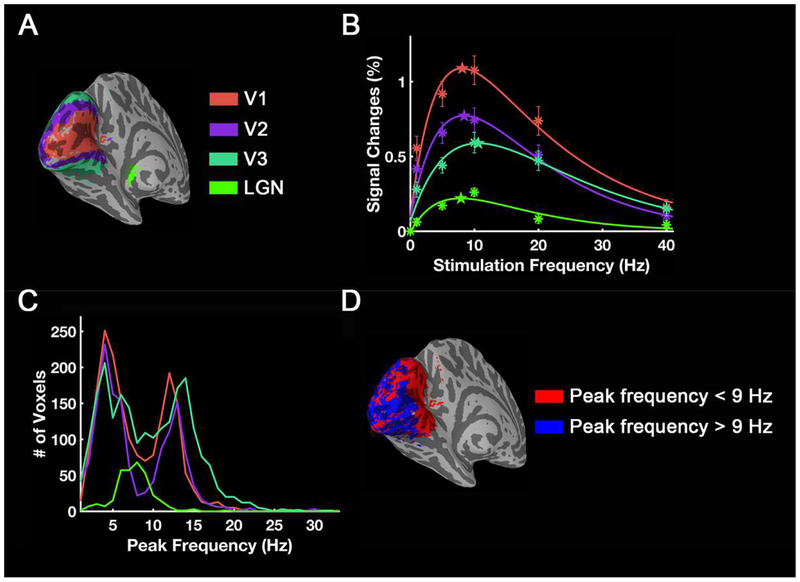
Fig. 3 shows mean frequency-tuning curves for the LGN, and low/high-frequency ROIs. For this purpose, the activity was averaged across voxels within each ROI, averaged across 17 subjects, and plotted as a function of stimulation frequency (asterisks in Fig. 3B). Fitted curves show distinct shapes with different peak or preferred frequencies (star points) and widths for different ROI’s.
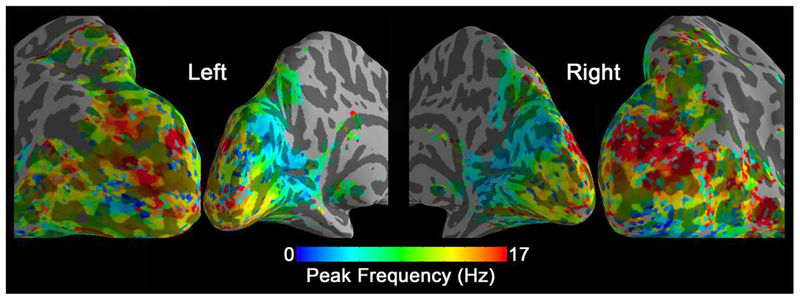
Similar fits were computed on every voxel inside the active visual areas. The resulting voxel-wise preferred temporal frequencies are shown in Fig. 4. In this tuning map, we can observe how the calcarine sulcus is tuned to the lowest frequencies (blue colors). When moving from the anterior to posterior calcarine cortex, the preferred frequency increases. Lateral occipital areas show a preference for the highest flickering frequencies (red colors).
Figure 4.
Peak frequency map of group-level BOLD signal changes (N=17). In each voxel, the peak frequency was generated by fitting the BOLD signal changes vs. temporal frequencies.
The trend of increasing preferred temporal frequency from anterior to posterior calcarine and then to lateral occipital cortex was observed in each individual subject (see Supplementary Fig. 1 for 8 representative subjects). In addition, Supplementary Fig. 1 also shows the frequency tuning curves for low/high-frequency and LGN ROIs. Detailed examination of these curves reveals inter-subject differences. For example, subject 21 (peak frequency = 19.2 Hz / 6.2 Hz / 17.8 Hz / for LGN, low and high frequency ROI’s respectively) showed much higher preferred frequency than subject 19 (peak frequency = 8.4 Hz / 2.6 Hz / 11.9 Hz for LGN, low and high frequency ROI’s respectively). This suggests that, despite an overall common organization, each subject exhibits unique tuning curve shape and frequency preference.
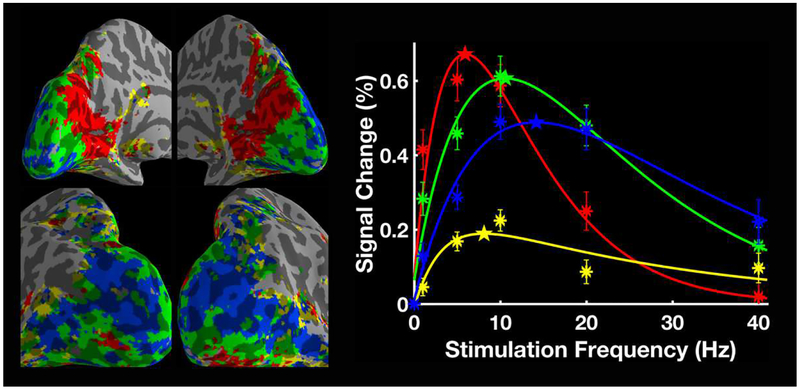
To confirm that our observations weren’t due to our model choice, we also adopted a model-free method to verify the spatial distribution of the preferred temporal frequency. At the group level, we applied k-means to cluster areas according to the similarity in their frequency responses (Fig. 5). The resulting cluster distribution suggests a clear trend of increasing peak frequency from anterior to posterior calcarine and then to lateral occipital areas. This is consistently seen across individuals (Supplementary Fig. 2), which agrees well with the maps generated through the model fitting approach.
Figure 5.
k-means parcellation (k = 4) based on group-level frequency-dependent BOLD signal changes (N=17). The mean BOLD signal changes for each cluster are plotted as a function of stimulation frequency. The asterisks indicate the measured signal changes and the stars mark the peak frequency of each curve. The error bars indicate ± SEM across all subjects.
3.2. Cortical architecture revealed by frequency-dependent thalamo-visual correlation
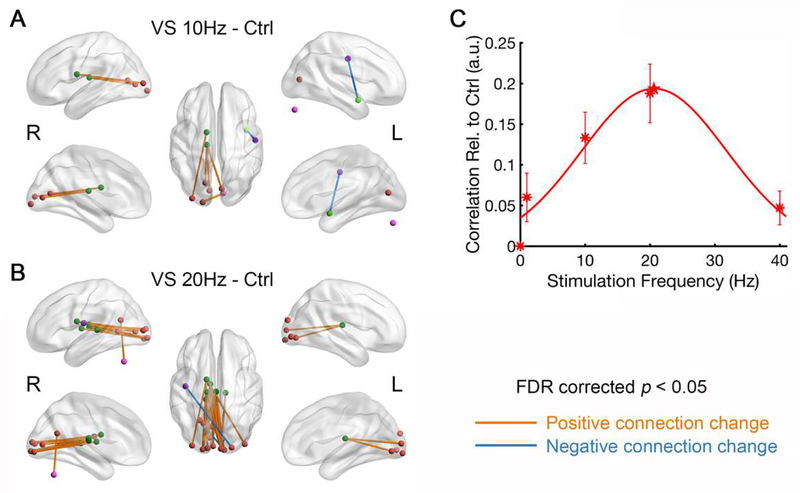
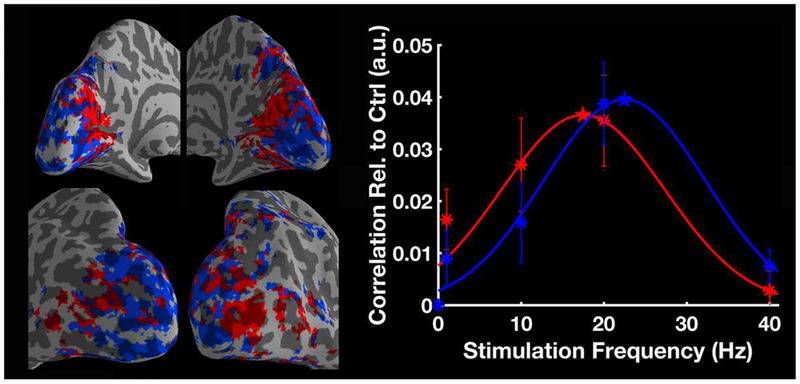
For the steady-state paradigm, we first explored whole-brain connectivity patterns looking for connections modulated by visual stimulation. We found multiple connections between thalamic and visual nodes that show significant frequency modulatory effects (Fig. 6). Particularly, visual stimulation at 20 Hz vs. control has the largest number of significant thalamo-visual connections. Visual stimulation at 10 Hz also caused a significant correlation increase, however not as high as at 20 Hz. Averaging all the connections that are significantly enhanced during stimulation at 10 Hz or 20 Hz, the thalamo-visual correlation was well-approximated by a Gaussian shape tuning curve (Fig. 6C).
Figure 6.
Results of network statistical analysis and the tuning curve of thalamo-visual correlation (N = 20). Compared to control, visual stimulation at (A) 10 Hz and (B) 20 Hz significantly enhanced the connectivity between thalamus and visual cortex. The purple nodes outside of the brain are cerebellar region. (C) Mean correlation between thalamus and visual cortex (arbitrary unit, a.u.) was plotted as a function of stimulation frequency. The asterisks indicate the measured correlations relative to control and the curves are the Gaussian functions that best fit the data. The star indicates the peak frequency of the fitted curve. The error bars indicate ± SEM across subjects. R and L mark the side of left/right hemisphere.
While a binary count of connections that cross a statistical threshold clearly shows the frequency selectivity of thalmo-visual connections, we don’t want to over-assign meaning to specific connections. For example, there is a hemispheric asymmetry for significant connectivity changes with the right thalamus showing more connections than the left thalamus (Fig 6A and 6B). This observation could reflect measurement noise that keeps the left connections under threshold a meaningful difference in correlation magnitudes. We examine this further by looking at the frequency-dependent profiles in both hemispheres.
We first examined correlation changes using the bilateral visual cortex ROI as a single seed. The medial thalamus has its connectivity significantly modulated by stimulation frequency (Fig. 7). This medial thalamus region does not overlap with LGN, which is activated in block-designed task runs. To evaluate if the above-mentioned hemispheric asymmetry is visible in tuning curves of correlation changes, we estimated connectivity between visual regions and both left/right medial thalamus ROIs (Supplementary Fig. 3). Resulting frequency tuning curves were similar for both left/right thalamic region.
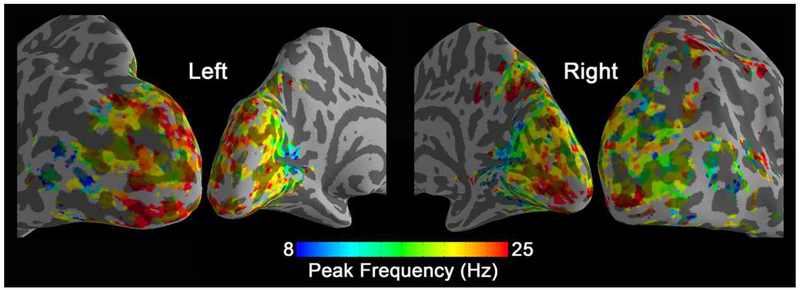
Finally, we computed the correlation of every voxel in visual cortex with the medial thalamus ROI and fitted a Gaussian function to these data. Resulting voxel-wise maps of peak frequency are shown in Fig. 8. Similar to activity-based tuning maps, a low frequency preference in connectivity-based tuning maps also appears in bilateral anterior calcarine cortex, while posterior calcarine and lateral occipital areas prefer high flickering frequencies. Fig. 9 shows group-level results for the model-free approach (k-means, k = 2). One resulting cluster is sensitive to low frequency and the other sensitive to high frequency. The distribution of these two clusters is consistent with the spatial trend of the preferred frequency map, described above.
Figure 8.
Preferred frequency map of group-level correlation changes (N=20). In each voxel, the peak frequency was generated by fitting the frequency-dependent correlations with medial thalamus.
Figure 9.
k-means parcellation based on frequency-dependent correlation changes to the thalamus at the group level (N=20). k = 2 was used and the mean correlation for each cluster was plotted as a function of stimulation frequency. The asterisks indicate the measured correlations relative to control, and the stars mark the peak frequency of each fitted curve. The error bars indicate ± SEM across subjects.
3.3. Preferred frequency map vs. retinotopic map
Fig. 10 shows the relationship between the eccentricity and peak frequency in the form of a two-dimensional (2D) histogram. Based on activity measurements, most voxels have peak frequencies of about 12–15 Hz in the fovea. As eccentricity increases from 0 to 10 degrees, the peak frequencies preferred by most voxels at that specific eccentricity decrease (Fig. 10B). With respect to thalamo-visual correlation, most voxels exhibit peak frequencies of about 20–25 Hz in fovea. As eccentricity increases from 0 to 10 degrees, more voxels gather near a lower peak frequency (Fig. 10C).
Fig. 11 and Fig. 12 show the mean frequency tuning curves and histograms of peak frequency in each visual area. Based on BOLD magnitude changes, ROI-mean peak frequencies for LGN, V1, V2 and V3 are 7.9 Hz, 7.7 Hz, 8.1 Hz and 11.1 Hz, respectively (Fig. 11B). However, the histogram shows that most voxels in these visual areas except LGN have peak frequencies around either 4 Hz or 12–14 Hz (Fig. 11C). The distribution of these two clusters is shown in Fig. 11D. For the thalamo-visual correlations, the peak frequencies for V1, V2 and V3 are 19.7 Hz, 20.2 Hz and 20.9 Hz, respectively (Fig. 12B), which are also the preferred frequencies of most voxels in these areas (Fig. 12C).
Figure 11.
Frequency tuning curves and histograms across visual areas for group-level activation. (A) V1/2/3 were defined by taking the intersection of the visual areas template from Benson et al. (2014) and preferred frequency mapping regions. Using measured BOLD magnitude changes, frequency tuning curves for different visual areas are shown in (B), and the histogram (C) shows how many voxels have a specific peak frequency. The color of the curves and points correspond to different visual areas. Asterisks are the measured mean value from each visual area and the stars mark the peak frequency of each fitted curve. The error bars indicate ± SEM across subjects (N = 17). (D) Distribution of areas with preferred frequency < 9Hz and > 9Hz.
Figure 12.
Frequency tuning curves and histograms across visual areas for group-level correlation. Based on the thalamo-visual correlation, frequency tuning curves for different visual areas are shown in (B), and the histogram (C) shows how many voxels have a specific peak frequency. The color of the curves and points correspond to different visual areas. Asterisks are the measured mean value from each visual area and the stars mark the peak frequency of each fitted curve. The error bars indicate ± SEM across subjects (N = 20).
4. Discussion
The main goal of our study was to determine how the temporal frequency of visual stimuli modulates local activity within visual cortex, and brain connectivity across visual areas. To accomplish this, we estimated temporal frequency tuning functions and characterized how tuning properties vary systematically across the human visual system. We outline four ways in which our study advance understanding of temporal frequency processing throughout the visual hierarchy: (i) Stimuli lacking spatial patterns were used to attenuate the saccadic facilitation effect. (ii) Stimuli at 40 Hz caused selective activation of the lateral occipital cortex while 1 Hz stimuli mainly activated calcarine sulcus. (iii) Both local BOLD magnitude and thalamo-visual correlation changes were used to evaluate preferences for temporal frequency in the human brain. To the best of our knowledge, this is the first demonstration of mapping the visual frequency preference for connectivity. (iv) Consistent with previous research, we find that lateral occipital regions prefer the highest temporal frequencies compared to other visual areas. However, along the visual field eccentricity axis, higher frequencies are preferred in central rather than peripheral areas. This observation diverges from the prevailing view.
4.1. Benefits and limitations for flashing stimuli with no pattern
Both patterned and flashing light have been utilized to probe the visual temporal frequency sensitivity in earlier studies (Bayram et al., 2016; Singh et al., 2000; Van Camp et al., 2006; Yen et al., 2011). We adopted the flashing stimuli without any spatial pattern based on the following two considerations.
First, the visual perception of patterned flickering at high temporal frequencies can be facilitated considerably by saccadic eye movements (Deubel and Elsner, 1986). Under patterned stimulation at high temporal frequencies, eye movements or blinks can introduce additional transients that improve stimulus visibility. This effect can be strong enough to override saccadic suppression (Deubel et al., 1987). In our study, we modulated temporal frequency up to 40 Hz, which is near the cut-off temporal frequency humans can perceive (Shady et al., 2004). As such, there was a concern that patterned stimulation at this cut-off frequency could be more easily visible with eye movements or blinks. These saccades and blinks would induce lower frequency perception of stimulus changes during high frequency stimulation and thus artifactually increase estimates of preferred temporal frequency. Initial pilot data using 40Hz flashing checkerboard stimuli revealed that subjects couldn’t readily perceive such rapid flickering but reported seeing the image change when they moved their eyes or blinked. This facilitation effect was not observed with the unpatterned stimuli. Consequently, for the main experiments, we decided to use flashing stimulation without any spatial pattern in order to attenuate the facilitation effects caused by eye movements and blinks.
Second, several properties of patterned stimuli, such as spatial frequency and direction, can introduce modulatory effects on the preferred temporal frequency. For example, Mirzajani et al. (2015) presented flickering checkerboards at different spatial frequencies and temporal frequencies. They found that the temporal tuning curve of high spatial frequency stimulation (8 cycles/degree) peaked at 6 Hz, while that of low spatial frequency stimulation (0.4 cycles/degree) peaked at 8 Hz (Mirzajani et al., 2005). Other psychophysical and electrophysiological studies also indicate that temporal frequency tuning varies with spatial frequency, particularly the preferred temporal frequency increases when using visual stimuli at lower spatial frequencies (Lee et al., 2007; Morrone et al., 1986). Moreover, different types of checkerboards and gratings, which can consist of diverse spatial frequency and direction components, can inadvertently complicate the interpretation of temporal frequency tuning studies. In the present study, our spatial frequency essentially had 0 cycles/degree, which can be thought of as the simplest type of stimulation without any pattern to modulate temporal frequency. As such, the final observable temporal frequency sensitivity can be mainly attributed to neurons favoring low spatial frequency, such as magnocellular cells, and directionally-inselective neurons. It is worth noting that the frequency preference pattern reported here could be sensitive to the type of stimuli selected for this work.
4.2. Unique activation pattern evoked by 40Hz stimuli
Earlier literature suggests that visual stimulation at Gamma frequency causes unique visual and physiologic effects. For example, light flickering at 40 Hz has been shown to reduce amyloid plaque levels in a mouse model of Alzheimer’s disease, and this effect is absent with visual stimulation at other frequencies (20 Hz, 80 Hz) or random flicker (Iaccarino et al., 2016). This unique treatment effect was suggested to be achieved through entraining Gamma oscillations as they are thought to play a role in visual perception and sensory integration (Engel et al., 2001; Pastor et al., 2003; Singh, 2012). In humans, several studies have explored the effect of visual stimulation at Gamma frequencies, yet those studies are challenging because flicker at Gamma frequency induces relatively weak activity—relative to lower stimulation frequencies—given its proximity to the upper perception threshold for humans (Shady et al., 2004). Moreover, PET studies have demonstrated that activation patterns induced by 40Hz stimulation are distinct from those at other stimulation frequencies: 40Hz stimuli activated only the dorsolateral portion of primary visual and association areas representing the macular region of the retina (Pastor et al., 2003; Pastor et al., 2007). Comparable activation patterns were obtained here (Fig. 1): for 40 Hz stimuli, the activation is mainly in lateral occipital cortex whereas it is absent or much weaker in calcarine sulcus. These results suggest that lateral occipital areas and extrastriate areas are more involved than V1 in the processing of Gamma frequency stimuli.
4.3. The Influence of visual stimulation frequency on brain connectivity
Visual stimuli not only activate selective cortical regions but also modulate specific brain connections. To estimate functional connectivity, we used a continuous visual stimulation paradigm to ensure task-evoked activity levels could reach a steady state. Other studies have used a similar continuously active task paradigms to study task-related functional connectivity changes (Buckner et al., 2013; Gonzalez-Castillo et al., 2015; Newton et al., 2007; Newton et al., 2011). For steady state visual stimulation, previous electrophysiological studies in animals and humans have reported that steady state visually evoked potentials (SSVEP) occur in a large scale functional cortical network (Vialatte et al., 2010) and the stimulation frequency can be modulate to alter functional connections (Srinivasan et al., 2007; Xu et al., 2013). This suggests that the frequency-dependent correlation changes in this study might be arising from a reorganization of communication patterns between distant brain regions. In addition to thalamo-visual correlation changes, we also found correlations between visual cortex and medial frontal cortex to be modulated by the visual stimulation frequency (Fig. 7), which is consistent with the results reported by previous EEG (Yan and Gao, 2011) and fMRI studies (Srinivasan et al., 2007) in humans.
We also observed hemispheric asymmetry for the number of thalamo-visual connections that showed significant frequency-dependent correlation changes (Fig. 6). When we examined correlations from the visual cortex to the thalamus (Fig. 7) and the thalamus to visual cortex (Figs. 8 and 9), we saw similar patterns of correlation-based frequency preference in each hemisphere. The frequency tuning curves are also very similar for visual connections with left and right thalamic regions (Supplementary Fig. 3). We interpret the asymmetry in the current data as being caused by small, but asymmetric changes in magnitude or noise that result in an asymmetry for what crosses a significance threshold, even if the overall pattern of frequency preferences is clearly bilateral. Additional studies will be necessary to determine if the asymmetry is caused by hemispheric neural processing differences.
4.4. Similarity and differences of the temporal frequency preferences derived from BOLD magnitude changes and thalamo-visual correlation
Preferred temporal frequency maps and cluster distributions derived from BOLD magnitudes and thalamo-visual correlations are similar in term of their overall spatial pattern. Both measurements resulted in maps showing an increase in preferred temporal frequency moving from anterior to posterior calcarine cortex.
Nonetheless, the frequency tuning properties and maps derived from activity and connectivity estimates also showed some differences worth noting: (i) Thalamo-visual correlation changes peaked at a higher temporal frequency (around 20 Hz) than that of BOLD magnitude changes (5–15 Hz). The frequency tuning curves also look different for the two measurements. (ii) An increase in preferred temporal frequency from posterior calcarine to lateral occipital cortex is only observable in the map based on BOLD magnitude changes. (iii) The trend of increasing preferred temporal frequency going from anterior towards posterior calcarine cortex is visually clearer for activity-based estimates than those based on connectivity.
Observed differences in frequency preference between activity and connectivity based results could be caused by separate visual pathways. Visual input enters into visual cortex through LGN (Vialatte et al., 2010). Thus, both LGN and visual cortex are activated by visual stimuli, and their local activity levels can be modulated by the temporal frequencies of the input stimuli. Unexpectedly, the overall correlation between LGN and visual cortex was not significantly modulated by temporal frequency (ANOVA using R package nlme (Pinheiro and Bates, 2000), F3,50 = 0.97, p = 0.42). A modulatory effect was only observable when focusing on medial thalamus (Fig. 7). This modulated connection is different from the input visual pathway from LGN to primary visual cortex. While the frequency tuning profiles of activation in LGN and visual cortex seem to be formed at the earliest stage of visual processing, the correlation changes between medial thalamus and visual cortex may reflect connections involved in top-down processing (Engel et al., 2001).
4.5. Comparison of the preferred temporal frequency pattern in this study with previous studies
Consistent with previous research, our results show that lateral occipital cortex prefers higher temporal frequency stimuli than other visual regions based on activity measurement. Stigliani et al. (2017) modeled the BOLD signal of the temporal processing in human visual cortex with a high frequency transient and a low frequency sustained model. They found that lateral occipitotemporal regions manifested transient response and had little contribution from sustained response, suggesting that the lateral occipitotemporal areas are more sensitive to the stimuli of high temporal frequency (Stigliani et al., 2017). This phenomenon is also seen in the preferred frequency maps of present study.
However, the increasing trend of the preferred temporal frequency from anterior to posterior calcarine is inconsistent with the prevailing view. In previous psychophysical studies, fusion frequency or critical frequency of flicker (CFF), defined as the frequency at which a flickering light is indistinguishable from a steady non-flickering light, had been used extensively for assessing the temporal characteristics of the visual system. It had been shown that the relationship between CFF and eccentricity could vary depending on the target size and luminance and the surrounding luminance (Douthwaite et al., 1985; Hartmann et al., 1979). When the stimulus size was scaled by the human cortical magnification factor (M) and the stimulus luminance is reduced in inverse proportion to Ricco’s area (F-scaled) with increasing eccentricity, CFF became independent of the visual field location (Rovamo et al., 1985). Recently, fMRI has also been used to study the eccentricity-dependent tuning properties of human visual cortex. Using either M-scaled localized grating (Himmelberg and Wade, 2018) or whole field phase-scrambled stimuli (Stigliani et al., 2017), voxels at peripheral eccentricity were reported to have higher sensitivity for flickering at high temporal frequencies compared to central representations. The opposite frequency preference trend in eccentricity domain observed in the present study could be attributed to difference in stimuli. In our study, we used a spatially-constant stimulus with no spatial pattern at any spatial frequency. The stimuli used in previous CFF or frequency-tuning studies were discrete in space and included a range of spatial frequency components. Data from an independent ongoing study also suggests stimuli can play an important role. When we compare the eccentricity-dependent frequency tuning between spatially-constant stimulus (whole-field uniform flickering) and checkerboard flashing in humans at 7T (details in Supplementary Experiment), we observe different eccentricity-dependent frequency preference across stimulus types. For the spatially-constant stimuli, in peripheral visual cortex, we detected a higher response at low stimulation frequencies while central representations responded more to high stimulation frequencies (Supplementary Fig. 4). This result is consistent with our finding in the main experiment (Fig. 4 and Fig. 10). However, for the checkerboard stimulus, the relationship of eccentricity and preferred temporal frequency looks reversed. At least for frequencies below 20 Hz, peripheral area preferred a higher stimulation frequency in order to achieve a stronger response, compared with central eccentricity (Supplementary Fig. 4C). This finding for checkerboard stimulus matches the prevailing view that periphery has a higher sensitivity of flicker at high temporal frequencies compared to fovea. This shift in eccentricity-dependent preferred temporal frequency suggests that the distribution of spatially-constant temporal channels in human visual cortex across eccentricity is different from that of the temporal channels for other spatial frequencies. The decrease we observed in preferred temporal frequency as eccentricity moves from fovea to periphery appears to be unique for spatially-constant stimuli.
In the far peripheral area with eccentricity larger than 12.6° (visual field is beyond this edge of the stimulus screen), temporal frequency preference can be affected by low stimulation luminance. In our study, participants perceived the flicker both directly from the screen, but also from the reflection of the screen’s illumination on the sides of the MRI scanner bore. At eccentricities above 12.6°, the preferred temporal frequency stayed at a relatively low level (about 4–5 Hz base on BOLD signal changes and 20 Hz based on thalamo-visual correlation) and almost did not change with increasing eccentricity (Fig. 10). This low preferred temporal frequency can be partially attributed to the above-mentioned low stimulation luminance effect as the flicker reached the eyes through reflection. Previous psychophysical studies found that decreasing stimulus luminance decreased corresponding CFF (Douthwaite et al., 1985). Another fMRI study measured BOLD response of human visual cortex to drifting gratings at different luminance and it reported that low luminance reduced the preferred drifting speed compared with high luminance condition (Hammett et al., 2013). These suggest that the responses to stimulation at different temporal frequencies are differentially modulated by luminance and that therefore the low luminance in the peripheral visual field (caused by reflection) can shift the preferred temporal frequency to a lower value as we observed.
Comparing the mean preferred temporal frequency across early visual areas, we found V3 preferred a higher temporal frequency than V1 and V2 based on the BOLD magnitude measurement. Using electrophysiological recording in the macaque, Gegenfurtner et al. (1997) also found that neurons in V3 preferred higher temporal frequencies than V2 neurons. Using fMRI in humans, Stigliani et al. (2017) showed V3 has more contributions from the transient channels than V1 and V2, which similarly suggests a higher sensitivity to high temporal frequency stimulus in V3. In LGN, we found the mean preferred temporal frequency to be similar to that of V1 and V2, which is approximately 8 Hz. Similarly, in another fMRI study in humans, Kastner et al. (2004) found response modulation by varying flicker rate to be similar in the LGN and V1 and their response was constrained to a relatively lower temporal frequency range than in extrastriate areas. In contrast, research in cats using fMRI (Yen et al., 2011) and in monkeys using electrophysiological recording (Hawken et al., 1996) both show that LGN prefers a relatively higher temporal frequency than V1. This discrepancy in LGN may arise from the difference in species or stimulation patterns.
Although the mean preferred temporal frequencies of early visual areas in our study are similar to the typical value of 8–9 Hz reported in previous fMRI studies (Lin et al., 2008; Singh et al., 2000; Singh et al., 2003), the non-uniformity of the tuned frequency distributions of human early visual areas has not been explored. For the voxels in V1, V2 and V3, about half prefer temporal frequency at 4 Hz and the other half prefer 12–14 Hz (Fig. 11C). Numerous functional imaging studies typically reported a ROI-mean peak frequency of 8 Hz across broad activation areas (Fox and Raichle, 1984; Lin et al., 2008; Singh et al., 2000; Singh et al., 2003). However, the organization is likely more nuanced in that 8 Hz is actually the median peak frequency of low and high frequency clusters. For example, in V1, based on the mean activity of the whole area, the peak frequency is 10 Hz. However, the voxels in V1 are mostly tuned to 4 Hz and 12 Hz, and those two voxel clusters occupy low-eccentricity and high-eccentricity regions, respectively (Fig. 11D). It means that the voxels in V1 are not uniformly tuned to the same frequency, for some of the reasons discussed above.
5. Conclusions
We demonstrated a visual cortical architecture that is selectively tuned to different temporal frequencies. Using BOLD magnitude as an index, human visual cortex is shown to be organized with the anterior, posterior calcarine, and lateral occipital cortex preferring low, middle, and high temporal frequencies respectively. Using correlation with thalamus as the unit of merit, we also observed that the anterior calcarine forms a cluster that is sensitive to low temporal frequencies, while posterior calcarine and lateral occipital cortex prefer high temporal frequencies. This map of the preferred temporal frequency provides insight as to the spatial structure of temporal-frequency processing within and across human visual areas.
Supplementary Material
7. Acknowledgements
We acknowledge Lori Talagala of NIAAA for great help during scanning, Dr. Hua Xie of Texas Tech University for assistance in k-means analysis, Dr. Charles Zheng of NIMH and Dr. Yoichi Miyawaki of University of Electro-Cummunications (Tokyo, Japan) for helpful discussions, and NIH Fellows Editorial Board for editorial assistance.
6 Funding
This work was supported by the Intramural Research Program of the National Institute of Mental Health (Grant: ZIAMH002783).
Footnotes
Publisher's Disclaimer: This is a PDF file of an unedited manuscript that has been accepted for publication. As a service to our customers we are providing this early version of the manuscript. The manuscript will undergo copyediting, typesetting, and review of the resulting proof before it is published in its final citable form. Please note that during the production process errors may be discovered which could affect the content, and all legal disclaimers that apply to the journal pertain.
8 References
- Allison JD, Smith KR, Bonds AB, 2001. Temporal-frequency tuning of cross-orientation suppression in the cat striate cortex. Vis Neurosci 18, 941–948. [PubMed] [Google Scholar]
- Bayram A, Karahan E, Bilgic B, Ademoglu A, Demiralp T, 2016. Achromatic temporal-frequency responses of human lateral geniculate nucleus and primary visual cortex. Vision Res 127, 177–185. [DOI] [PubMed] [Google Scholar]
- Benson NC, Butt OH, Brainard DH, Aguirre GK, 2014. Correction of Distortion in Flattened Representations of the Cortical Surface Allows Prediction of V1-V3 Functional Organization from Anatomy. PLoS Comput Biol 10. [DOI] [PMC free article] [PubMed] [Google Scholar]
- Buckner RL, Krienen FM, Yeo BT, 2013. Opportunities and limitations of intrinsic functional connectivity MRI. Nat Neurosci 16, 832–837. [DOI] [PubMed] [Google Scholar]
- Chen G, Saad ZS, Britton JC, Pine DS, Cox RW, 2013. Linear mixed-effects modeling approach to FMRI group analysis. Neuroimage 73, 176–190. [DOI] [PMC free article] [PubMed] [Google Scholar]
- Cox RW, 1996. AFNI: software for analysis and visualization of functional magnetic resonance neuroimages. Comput Biomed Res 29, 162–173. [DOI] [PubMed] [Google Scholar]
- Craddock RC, James GA, Holtzheimer PE 3rd, Hu XP, Mayberg HS, 2012. A whole brain fMRI atlas generated via spatially constrained spectral clustering. Hum Brain Mapp 33, 1914–1928. [DOI] [PMC free article] [PubMed] [Google Scholar]
- Dale AM, 1999. Optimal experimental design for event-related fMRI. Hum Brain Mapp 8, 109–114. [DOI] [PMC free article] [PubMed] [Google Scholar]
- Deubel H, Elsner T, 1986. Threshold perception and saccadic eye movements. Biol Cybern 54, 351–358. [DOI] [PubMed] [Google Scholar]
- Deubel H, Elsner T, Hauske G, 1987. Saccadic eye movements and the detection of fast-moving gratings. Biol Cybern 57, 37–45. [DOI] [PubMed] [Google Scholar]
- Douthwaite WA, Halliwell JA, Lomas AM, Yan Muk WK, Topliss JN, 1985. Critical fusion frequency in the central visual field. Ophthalmic Physiol Opt 5, 15–21. [PubMed] [Google Scholar]
- Dumoulin SO, Harvey BM, Fracasso A, Zuiderbaan W, Luijten PR, Wandell BA, Petridou N, 2017. In vivo evidence of functional and anatomical stripe-based subdivisions in human V2 and V3. Scientific Reports 7. [DOI] [PMC free article] [PubMed] [Google Scholar]
- Engel AK, Fries P, Singer W, 2001. Dynamic predictions: oscillations and synchrony in top-down processing. Nat Rev Neurosci 2, 704–716. [DOI] [PubMed] [Google Scholar]
- Fawcett IP, Barnes GR, Hillebrand A, Singh KD, 2004. The temporal frequency tuning of human visual cortex investigated using synthetic aperture magnetometry. Neuroimage 21, 1542–1553. [DOI] [PubMed] [Google Scholar]
- Fischl B, 2012. FreeSurfer. Neuroimage 62, 774–781. [DOI] [PMC free article] [PubMed] [Google Scholar]
- Fox PT, Raichle ME, 1984. Stimulus Rate Dependence of Regional Cerebral Blood-Flow in Human Striate Cortex, Demonstrated by Positron Emission Tomography. J Neurophysiol 51, 1109–1120. [DOI] [PubMed] [Google Scholar]
- Gegenfurtner KR, Kiper DC, Levitt JB, 1997. Functional properties of neurons in macaque area V3. J Neurophysiol 77, 1906–1923. [DOI] [PubMed] [Google Scholar]
- Gonzalez-Castillo J, Hoy CW, Handwerker DA, Robinson ME, Buchanan LC, Saad ZS, Bandettini PA, 2015. Tracking ongoing cognition in individuals using brief, whole-brain functional connectivity patterns. Proc Natl Acad Sci U S A 112, 8762–8767. [DOI] [PMC free article] [PubMed] [Google Scholar]
- Goutte C, Toft P, Rostrup E, Nielsen F, Hansen LK, 1999. On clustering fMRI time series. Neuroimage 9, 298–310. [DOI] [PubMed] [Google Scholar]
- Hammett ST, Smith AT, Wall MB, Larsson J, 2013. Implicit representations of luminance and the temporal structure of moving stimuli in multiple regions of human visual cortex revealed by multivariate pattern classification analysis. J Neurophysiol 110, 688–699. [DOI] [PMC free article] [PubMed] [Google Scholar]
- Hartmann E, Lachenmayr B, Brettel H, 1979. The peripheral critical flicker frequency. Vision Res 19, 1019–1023. [DOI] [PubMed] [Google Scholar]
- Hawken MJ, Shapley RM, Grosof DH, 1996. Temporal-frequency selectivity in monkey visual cortex. Vis Neurosci 13, 477–492. [DOI] [PubMed] [Google Scholar]
- Himmelberg MM, Wade AR, 2018. Eccentricity-dependent temporal contrast tuning in human visual cortex measured with fMRI. Neuroimage. [DOI] [PMC free article] [PubMed] [Google Scholar]
- Iaccarino HF, Singer AC, Martorell AJ, Rudenko A, Gao F, Gillingham TZ, Mathys H, Seo J, Kritskiy O, Abdurrob F, Adaikkan C, Canter RG, Rueda R, Brown EN, Boyden ES, Tsai LH, 2016. Gamma frequency entrainment attenuates amyloid load and modifies microglia. Nature 540, 230–235. [DOI] [PMC free article] [PubMed] [Google Scholar]
- Lee S, Shioiri S, Yaguchi H, 2007. Stereo channels with different temporal frequency tunings. Vision Res 47, 289–297. [DOI] [PubMed] [Google Scholar]
- Lin AL, Fox PT, Yang Y, Lu H, Tan LH, Gao JH, 2008. Evaluation of MRI models in the measurement of CMRO2 and its relationship with CBF. Magn Reson Med 60, 380–389. [DOI] [PMC free article] [PubMed] [Google Scholar]
- Mirzajani A, Oghabian MA, Riyahi-Alam N, Saberi H, Firuznia K, 2005. Spatial frequency dependence of the human visual cortical response to temporal frequency modulation studied by fMRI. Conf Proc IEEE Eng Med Biol Soc 6, 5802–5803. [DOI] [PubMed] [Google Scholar]
- Moeller S, Yacoub E, Olman CA, Auerbach E, Strupp J, Harel N, Ugurbil K, 2010. Multiband Multislice GE-EPI at 7 Tesla, With 16-Fold Acceleration Using Partial Parallel Imaging With Application to High Spatial and Temporal Whole-Brain FMRI. Magnetic resonance in medicine 63, 1144–1153. [DOI] [PMC free article] [PubMed] [Google Scholar]
- Morrone MC, Di Stefano M, Burr DC, 1986. Spatial and temporal properties of neurons of the lateral suprasylvian cortex of the cat. J Neurophysiol 56, 969–986. [DOI] [PubMed] [Google Scholar]
- Newton AT, Morgan VL, Gore JC, 2007. Task demand modulation of steady-state functional connectivity to primary motor cortex. Hum Brain Mapp 28, 663–672. [DOI] [PMC free article] [PubMed] [Google Scholar]
- Newton AT, Morgan VL, Rogers BP, Gore JC, 2011. Modulation of steady state functional connectivity in the default mode and working memory networks by cognitive load. Hum Brain Mapp 32, 1649–1659. [DOI] [PMC free article] [PubMed] [Google Scholar]
- Orban GA, Kennedy H, Maes H, 1981. Response to movement of neurons in areas 17 and 18 of the cat: velocity sensitivity. J Neurophysiol 45, 1043–1058. [DOI] [PubMed] [Google Scholar]
- Pastor MA, Artieda J, Arbizu J, Valencia M, Masdeu JC, 2003. Human cerebral activation during steady-state visual-evoked responses. J Neurosci 23, 11621–11627. [DOI] [PMC free article] [PubMed] [Google Scholar]
- Pastor MA, Valencia M, Artieda J, Alegre M, Masdeu JC, 2007. Topography of cortical activation differs for fundamental and harmonic frequencies of the steady-state visual-evoked responses. An EEG and PET H215O study. Cereb Cortex 17, 1899–1905. [DOI] [PubMed] [Google Scholar]
- Peirce JW, 2007. PsychoPy--Psychophysics software in Python. J Neurosci Methods 162, 8–13. [DOI] [PMC free article] [PubMed] [Google Scholar]
- Pinheiro JC, Bates DM, 2000. Mixed-effects models in S and S-PLUS. Springer, New York. [Google Scholar]
- Rovamo J, Raninen A, Virsu V, 1985. The Role of Retinal Ganglion Cell Density and Receptive-Field Size In Photopic Perimetry In: Heijl A, Greve EL (Eds.), Sixth International Visual Field Symposium: Santa Margherita Ligure, May 27–31, 1984. Springer; Netherlands, Dordrecht, pp. 125–130. [Google Scholar]
- Shady S, MacLeod DI, Fisher HS, 2004. Adaptation from invisible flicker. Proc Natl Acad Sci U S A 101, 5170–5173. [DOI] [PMC free article] [PubMed] [Google Scholar]
- Singh KD, 2012. Which “neural activity” do you mean? fMRI, MEG, oscillations and neurotransmitters. Neuroimage 62, 1121–1130. [DOI] [PubMed] [Google Scholar]
- Singh KD, Smith AT, Greenlee MW, 2000. Spatiotemporal frequency and direction sensitivities of human visual areas measured using fMRI. Neuroimage 12, 550–564. [DOI] [PubMed] [Google Scholar]
- Singh M, Kim S, Kim TS, 2003. Correlation between BOLD-fMRI and EEG signal changes in response to visual stimulus frequency in humans. Magnetic resonance in medicine 49, 108–114. [DOI] [PubMed] [Google Scholar]
- Srinivasan R, Fornari E, Knyazeva MG, Meuli R, Maeder P, 2007. fMRI responses in medial frontal cortex that depend on the temporal frequency of visual input. Exp Brain Res 180, 677–691. [DOI] [PMC free article] [PubMed] [Google Scholar]
- Stigliani A, Jeska B, Grill-Spector K, 2017. Encoding model of temporal processing in human visual cortex. Proc Natl Acad Sci U S A 114, E11047–E11056. [DOI] [PMC free article] [PubMed] [Google Scholar]
- Sun P, Ueno K, Waggoner RA, Gardner JL, Tanaka K, Cheng K, 2007. A temporal frequency-dependent functional architecture in human V1 revealed by high-resolution fMRI. Nat Neurosci 10, 1404–1406. [DOI] [PubMed] [Google Scholar]
- Van Camp N, Verhoye M, De Zeeuw CI, Van der Linden A, 2006. Light stimulus frequency dependence of activity in the rat visual system as studied with high-resolution BOLD fMRI. J Neurophysiol 95, 3164–3170. [DOI] [PubMed] [Google Scholar]
- Vialatte FB, Maurice M, Dauwels J, Cichocki A, 2010. Steady-state visually evoked potentials: focus on essential paradigms and future perspectives. Prog Neurobiol 90, 418–438. [DOI] [PubMed] [Google Scholar]
- Xia M, Wang J, He Y, 2013. BrainNet Viewer: a network visualization tool for human brain connectomics. PLoS One 8, e68910. [DOI] [PMC free article] [PubMed] [Google Scholar]
- Xu P, Tian C, Zhang Y, Jing W, Wang Z, Liu T, Hu J, Tian Y, Xia Y, Yao D, 2013. Cortical network properties revealed by SSVEP in anesthetized rats. Sci Rep 3, 2496. [DOI] [PMC free article] [PubMed] [Google Scholar]
- Yan Z, Gao X, 2011. Functional connectivity analysis of steady-state visual evoked potentials. Neurosci Lett 499, 199–203. [DOI] [PubMed] [Google Scholar]
- Yen CC, Fukuda M, Kim SG, 2011. BOLD responses to different temporal frequency stimuli in the lateral geniculate nucleus and visual cortex: insights into the neural basis of fMRI. Neuroimage 58, 82–90. [DOI] [PMC free article] [PubMed] [Google Scholar]
Associated Data
This section collects any data citations, data availability statements, or supplementary materials included in this article.


