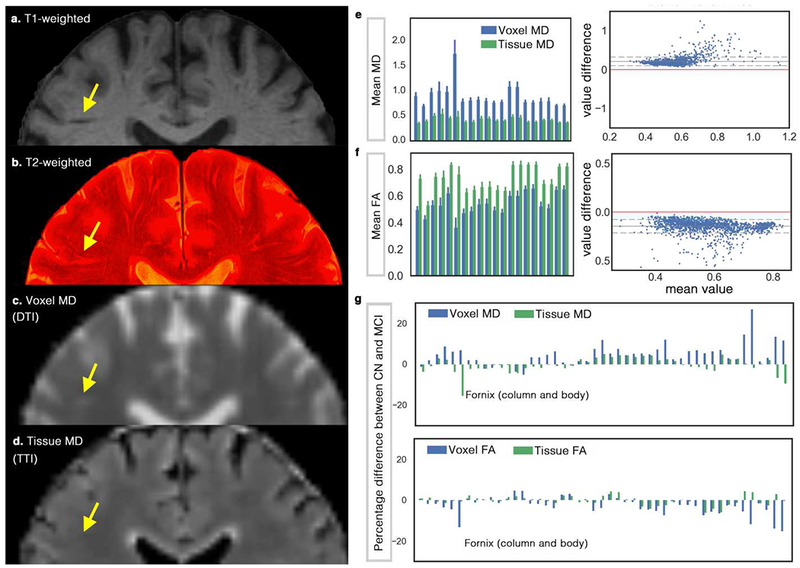
Figure 5. Investigating the effect of perivascular space (PVS) on DTI measures on a cohort of ADNI-3, including 37 cognitively normal (CN) subjects and 24 mild cognitively impaired (MCI) patients.

(a) shows the T1-weighted, in which a portion of the PVS can be seen. By superimposing high-resolution T2-weighted image on the T1-weighted image (b) more PVS are detectable. Mean diffusivity (MD) map from DTI and tissue tensor imaging (TTI) are mapped in (c) and (d), respectively. Note that MD from TTI preserved the expected white matter homogeneity by separating the PVS water from the tissue, yet successfully mapped the white matter hyperintensities. White matter hyperintensities are indistinguishable in the MD map from DTI, given the partial volume effect of the periventricular space. Mean voxel MD and tissue MD of 20 randomly selected (for the sake of space) regions from John Hopkins white matter atlas are shown in (e). Bland-Altman plot was drawn to compare DTI versus TTI, which shows the systematic bias of the DTI measures (note that if two techniques were equal the values would show a standard deviation around the value difference of zero, shown by red). (f) shows a similar analysis for the fractional anisotropy (FA) measures. The complete chart of John Hopkins white matter regions is illustrated in Supplemental Figure 4. (g) compares DTI results with TTI when CN group was compared with MCI. Note that for MD, most regions show increased MD (as reported in the literature), but when TTI was used, the inverse pattern was observed in many cases. Fornix is an extreme case of this example (while a large difference in Fornix was observe, it was not statically significant). Diffusivity values are in μm2/ms. An example group-level analysis was performed on the ADNI-3 data to judge if the findings differ when we incorporate a PVS contribution. When comparing MD values of CN and MCI groups using DTI, twenty-two regions were significantly different after correcting for multiple comparison using Benjamini–Hochberg procedure (Kwee and Kwee, 2007) and with the false discovery rate of 0.1 (age, sex and brain size were included in the regression). These regions and the statistics are reported in Supplemental Note 2. When TTI was used, or when the signal fraction of the PVS was included in the regression, none of those regions were significant.
