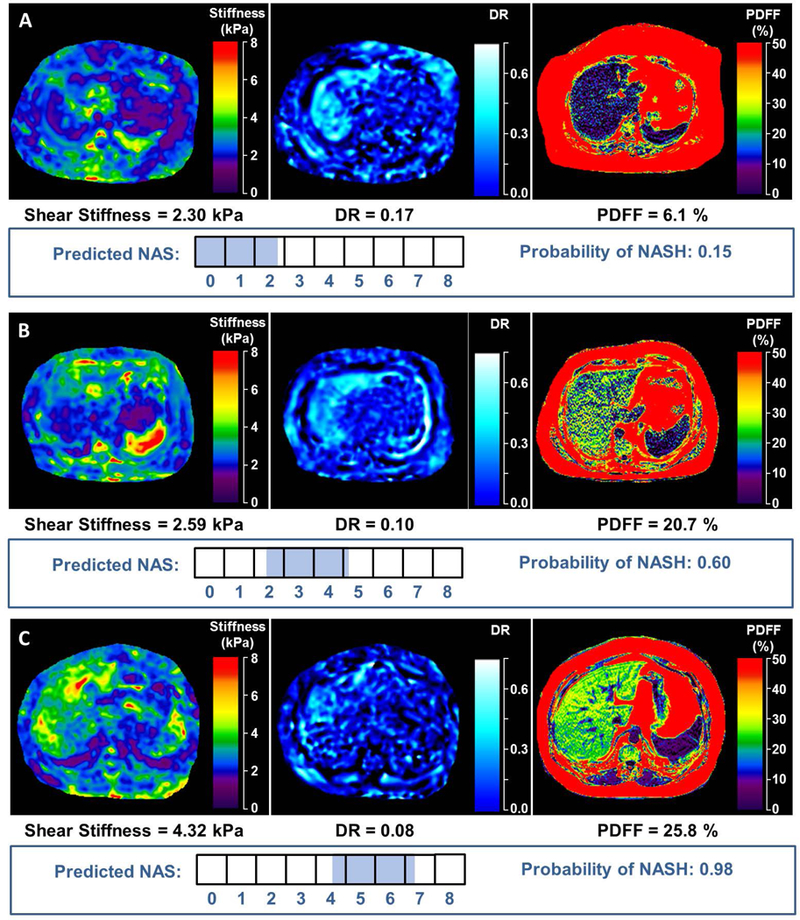
FIGURE 4. Examples of imaging analyses and predicted probabilities of NASH and NAFLD activity score (NAS) from three study patients.

The 3 imaging parameters included in the predictive model are shown: mf3D-MRE depiction of shear stiffness and damping ratio; MRI-PDFF depiction of fat fraction. The horizontal boxes illustrate the NAS values ranging from 0-8. The shaded part of the boxes represents the predicted range of NAS which were derived from the regression model as the highest probabilities within the 68% confidence interval. In patient A, who by histology does not have NASH and whose NAS=0, the logistic regression model using imaging parameters predicted a 15% probability of NASH and a predicted NAS=0-1. Patient B, with histologic NASH and NAS=3, has a predicted probability of 60% for NASH and a predicted NAS=3-4. Lastly, patient C, with histologic NASH and NAS=6, has a 98% predicted probability of NASH and a predicted NAS=5-6.
