Abstract
Background:
Quantitative MRI can detect early changes in cartilage biochemical components, but its routine clinical implementation is challenging.
Purpose:
To introduce a novel technique to measure T1 and T2 along radial sections of the hip for accurate and reproducible multiparametric quantitative cartilage assessment in clinically feasible scan time.
Study Type:
Reproducibility, technical validation.
Subjects/Phantom:
A seven-compartment phantom and three healthy volunteers.
Field Strength/Sequence:
A novel MR pulse sequence that simultaneously measures PD, T1 and T2 at 3 T was developed. Automatic positioning and semi-automatic cartilage segmentation were implemented to improve consistency and simplify workflow.
Assessment:
Intra- and inter-scanner variability of our technique was assessed over multiple scans on three different MR scanners.
Statistical Tests:
For each scan, the median of cartilage T1 and T2 over six radial slices was calculated. Restricted maximum likelihood estimation of variance components was used to estimate intra-subject variances reflecting variation between results from the two scans using the same scanner (intra-scanner variance) and variation among results from the three scanners (inter-scanner variance).
Results:
The estimation error for T1 and T2 with respect to reference standard measurements was less than 3% on average for the phantom. The average inter-scanner coefficient of variation was 1.5% (1.2%–1.9%) and 0.9% (0.0%–3.7%) for T1 and T2, respectively, in the seven compartments of the phantom. Total scan time in vivo was 7:13 minutes to obtain PD, T1 and T2 maps along six radial hip sections at 0.6×0.6×4.0 mm3 voxel resolution. Inter-scanner variability for the in vivo study was 1.99% and 5.46% for T1 and T2, respectively. In vivo intra-scanner variability was 1.15% for T1 and 3.24% for T2.
Data Conclusion:
Our method, which includes slice positioning, model-based parameter estimation and cartilage segmentation, is highly reproducible. It could enable employing quantitative hip cartilage evaluation for longitudinal and multi-center studies.
Keywords: Radial MRI, Quantitative MRI, Hip, Articular Cartilage, T1 mapping, T2 mapping
INTRODUCTION
Hip osteoarthritis (OA) is a disabling degenerative joint disease and the most common indication for total hip arthroplasty (1). MRI is a powerful tool for noninvasive evaluation of joints, but the hip joint poses unique challenges to it. In particular, its shape and anatomic position, including its thin and closely apposed articular cartilage, make hip MRI susceptible to partial-volume averaging utilizing conventional imaging planes (2).
This problem can be overcome by using radial imaging (3), where images are obtained perpendicular to the surfaces of the hip joint, and therefore provide a cross section of the cartilage and labrum. It has been shown that radial imaging of the hip is a reproducible technique that can improve the morphologic assessment of articular cartilage and labrum (4,5). Nevertheless, although morphologic MRI can quantify cartilage volume and thickness in OA progression (6,7), it still does not provide sufficient information to accurately identify the initial stages of cartilage degeneration (8,9).
Alternatively, quantitative MRI, such as longitudinal (T1) and transverse (T2) relaxation time mapping (10,11), can detect early changes in cartilage biochemical components, namely proteoglycans, water and collagen, which occur before morphologic changes. This is critical when the outcome of surgical treatments, which are aimed at delaying or preventing end-stage OA, depends on the preoperative condition of the articular cartilage, for example in femoroacetabular impingement (FAI) (12).
However, scan time limitations, inconsistency between measurements and time-consuming cartilage segmentation for diagnostic interpretation, have prevented extensive clinical validation of quantitative MR techniques, restricting their common use to research settings. The introduction of Magnetic Resonance Fingerprinting (MRF) (13), a novel approach to data acquisition, post-processing and visualization, might enable robust and reliable reconstruction of multiple parameters from a single, fast MR acquisition.
The aim of this work is to introduce a novel technique based on the principles of MRF to measure T1 and T2 along radial sections of the hip for rapid, accurate and reproducible multiparametric cartilage assessment.
MATERIALS AND METHODS
Multiparametric mapping technique
We developed an MRF technique for potentially reproducible T1 and T2 mapping in the hip with clinically acceptable resolution (0.6×0.6 mm2) and total scan time of less than 8 minutes. Since transmit field (B1+) non-uniformity can bias quantitative hip imaging at 3 Tesla (14), our MRF implementation was designed to simultaneously measure B1+, in addition to PD, T1 and T2 (15,16). Similar to a previous design (16), the proposed sequence concatenates two Fast Imaging with Steady-State Precession (FISP) segments, which predominantly encode T1/T2, and two Fast Low-Angle SHot (FLASH) segments, which encode T1 and B1+ (Fig. 1a). Each segment contains 250 radiofrequency (RF) excitations with a Time-Bandwidth product of three. The four segments are preceded by an adiabatic inversion that helps disentangling T1 and T2 dynamics in the MR fingerprint. In addition, a delay equal to 50 TRs is incorporated between segments to enhance T1 encoding and allow partial recovery of the magnetization. The target peak flip-angle was 60º.
Figure 1.
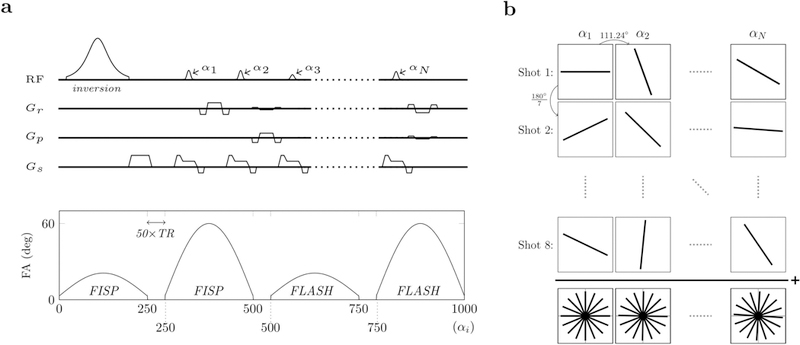
Pulse sequence design and k-space sampling pattern. The RF pulse sequence starts with an adiabatic inversion followed by four segments of 250 excitations each (a). The first two segments (FISP) are gradient spoiled only, while the last two segments (FLASH) are both gradient and RF spoiled. Each RF pulse (i.e., each excitation) is followed by one radial k-space readout. From one excitation (αn) to the next (αn+1), the readout direction is rotated by the golden angle (b). The whole RF train of 1000 excitations constitutes one shot. Eight and four shots per slice were acquired for the in-vivo and phantom validation, respectively. For each slice, shots were uniformly distributed within k-space. Slices were alternated between consecutive shots to allow the spins to return to the equilibrium condition. Parameter maps were reconstructed using an iterative MRF reconstruction framework.
Each excitation is followed by a single radial readout, whose orientation is incremented by the golden angle (17) between excitations (Fig. 1b). The complete train of 1000 excitations constitutes one shot. We acquired eight and four shots per slice, uniformly distributed within k-space (Fig. 1b), for the in vivo and phantom experiments, respectively. Multiparametric maps (PD, T1, T2, B1+) were reconstructed using an iterative approach (18). The dictionary with pre-simulated fingerprints was created using extended phase graphs (19). Simulations included the slice profile. The T1/T2 values ranged from 150–4000 ms/15–400 ms with increments of 5%. B1+ was varied between 30°–90° with 1° increments.
Automatic radial slice positioning
To simplify workflow and enhance reproducibility, an automatic slice positioning system was implemented. The operator only needs to prescribe the plane that shows the acetabular opening (Fig. 2c), using axial (Fig. 2a) and coronal (Fig. 2b) localizers. The pulse sequence then automatically acquires six equally spaced radial slices, orthogonal to such plane.
Figure 2.
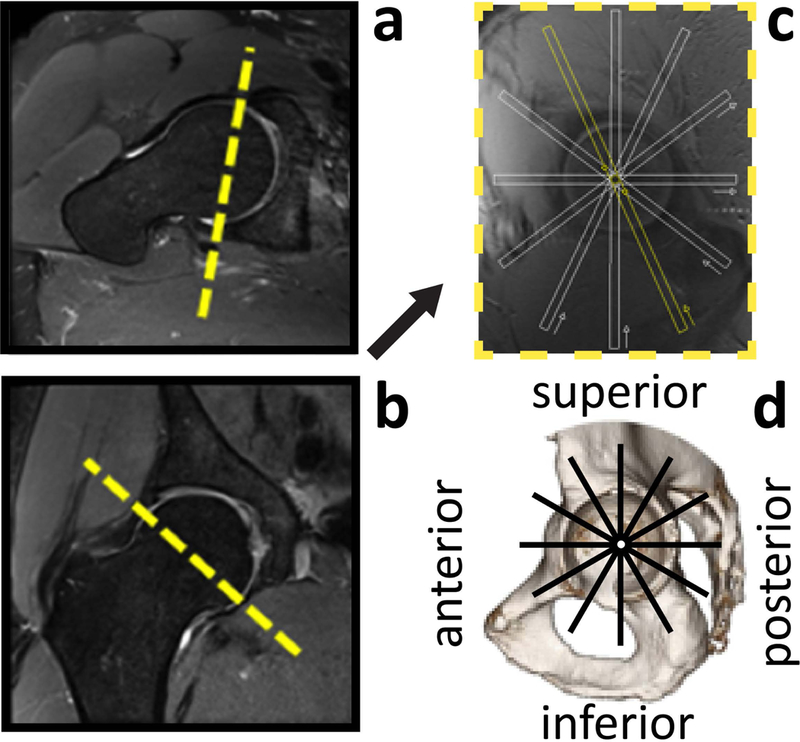
Slice positioning for the six radial imaging sections of the hip. An MR image that shows the acetabular opening (c) is obtained using true axial (a) and coronal (b) views of the hip joint. This plane serves as the localizer to automatically prescribe six radial sections at 1-hour increments (thick white lines) around a theoretical clock face. The radial sections depict six anatomical quadrants of the hip (d) and are acquired orthogonal to the articular cartilage with 4 mm thickness.
Semi-Automatic cartilage segmentation
We employed a multimodal multi-label classification strategy to segment the hip cartilage, exploiting the different contrasts provided by our MRF framework (T1, T2, PD). In particular, we used a random forest supervised learning algorithm, implemented in the ITK-SNAP toolkit (http://www.itksnap.org/). For each hip section, the training data were generated by manually labeling “seeds” in the PD images to identify cartilage, bone and other tissues. After incorporating a relative spatial constraint to account for the articular cartilage being framed between two bony structures, we applied active contour evolution on the manually initialized sources to obtain the final segmentation.
Phantom and in vivo reproducibility studies
To assess the intrinsic reproducibility of our technique, we scanned a multi-compartment phantom on three different clinical 3T MR scanners (Siemens Healthineers, Erlangen, Germany), two Skyra systems and one Prisma system, all running the same software version (VE11C). The phantom scans were conducted on the same day for the two Skyra systems and on a separate day for the Prisma system, using a 20-channel head coil. The cylindrical phantom (16.5 cm diameter, 20.0 cm length) consisted of 7 test tubes (2.5 cm diameter) each filled with distilled water doped with different concentrations of manganese chloride tetrahydrate (Cl2Mn 4H20, Sigma-Aldrich, St Louis, MO, USA). We used our MRF technique (176×176 matrix size, 1.0×1.0 mm2 in-plane, 5.0 mm slice thickness, TE/TR = 3.4/7.5 ms, BW = 650 Hz/pxl) to reconstruct T1 and T2 maps for a central axial section. For each test tube, the average T1 and T2 values within a circular region of interest (ROI) approximately as large as the tube’s cross section were compared among the three experiments.
To assess the in vivo reproducibility of our quantitative hip cartilage evaluation method, we scanned three healthy volunteers (2 males, 1 female, age = 32 ± 4.6). The institutional review board approved the study and informed consent was obtained before each scan. Each subject was scanned six times on the same day, twice on each of the three clinical scanners used for phantom validation. The combination of a spine coil and a flexible torso coil, wrapped around the hip of interest, was used for MR signal acquisition. Subjects were taken out of the scanner and the flexible coil was repositioned between consecutive acquisitions with the same scanner. Six radial sections were prescribed using the auto-positioning system described above and acquired with 0.6×0.6 mm2 in-plane resolution, 4.0 mm slice thickness, 320×320 matrix size, TE/TR = 3.5/7.5 ms, and BW = 490 Hz/pixel.
The articular cartilage was segmented on each section as described above and the median of cartilage T1 and T2 for each scan was calculated after combining voxels from all six slices of the same hip. Restricted maximum likelihood estimation of variance components was used to estimate intra-subject variances reflecting variation between results from the two scans using the same scanner (intra-scanner variance) and variation among results from the three scanners (inter-scanner variance). For the intra-scanner variance, the analysis used a mixed model that included scanner and an anonymized subject ID as fixed and random classification factors, respectively. As a result, the intra-scanner variation represents the variance between results from the two scans of a given subject on a given scanner pooled over subjects and scanners. For the inter-scanner variance, the model included scanner as a random classification factor and subject ID as a fixed blocking factor. As a result, the inter-scanner variance reflects variation among results from different scanners for the same subject pooled over subjects. The intra- and inter-scanner CVs were then computed for each measure (T1, T2) as the square root of the relevant variance component expressed as a percentage of the overall mean for the given measure.
RESULTS
Figure 3 compares parameters estimated with three different MR scanners, for the multi-compartment phantom. The average inter-scanner CV was 1.5% (1.2%–1.9%) and 0.9% (0.0%–3.7%) for T1 and T2, respectively, where the values in parentheses indicate the range of CV’s among the seven phantom compartments. This confirms that our MRF technique is intrinsically reproducible. The accuracy of the phantom T1 and T2 values was estimated separately using gold standard measurements as the reference (Supporting Fig. S1). The estimation error was less than 3% for the range of relaxation times expected for cartilage. Note that a previous work already reported less than 2% intra-scanner variability in a multi-compartment phantom for a similar pulse sequence (16), therefore we chose to assess only inter-scanner variability.
Figure 3.
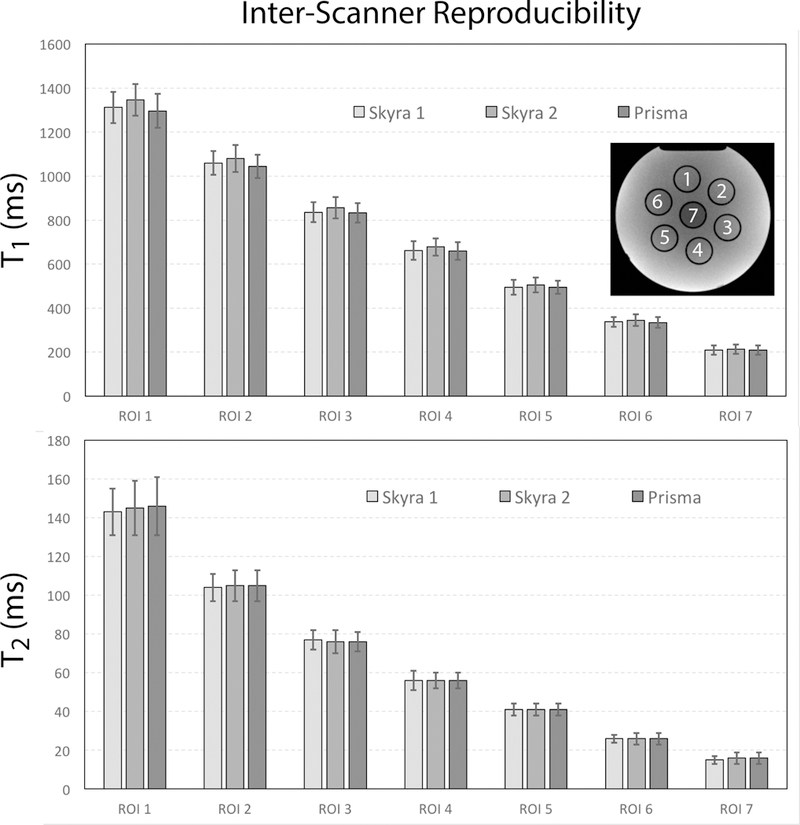
Average T1 and T2 values in seven phantom compartments with decreasing relaxation times. Error bars show the standard deviation within the regions of interest (ROI) for each compartment. Values were calculated for an axial slice through the center of the phantom, which is shown in the upper right corner, together with the different compartments.
Figure 4 shows PD, T1 and T2 maps along the six radial sections (Fig. 2) for a representative hip. Total scan time was 7:13 minutes. Voxels values corrupted by the unavoidable saturation band associated with radial hip imaging (2) were automatically excluded from the cartilage ROI by the segmentation process, as shown in Figure 5. Note that the saturation band affects the fovea region at the center of the joint, where there is no cartilage. Semi-automatic segmentation required on average 12 minutes for six radial hip sections all together.
Figure 4.
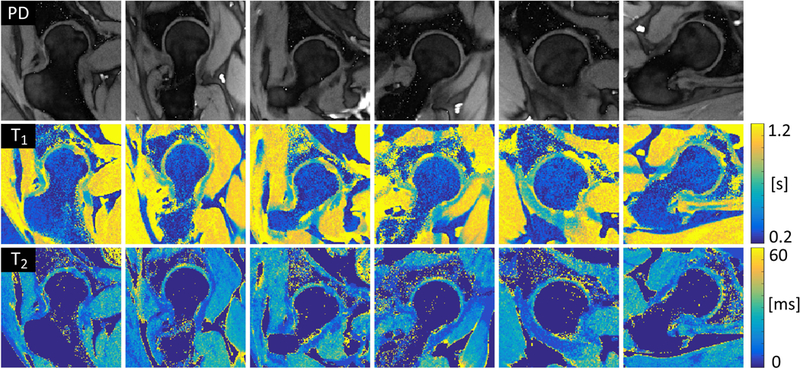
Simultaneous radial PD, T1 and T2 maps for six radial sections of a representative hip. In-plane spatial resolution was 0.6×0.6 mm2 and total scan time was 7 minutes and 13 seconds. Note that the fat contribution was manually masked out in the T2 maps to show more clearly the values in the articular cartilage.
Figure 5.
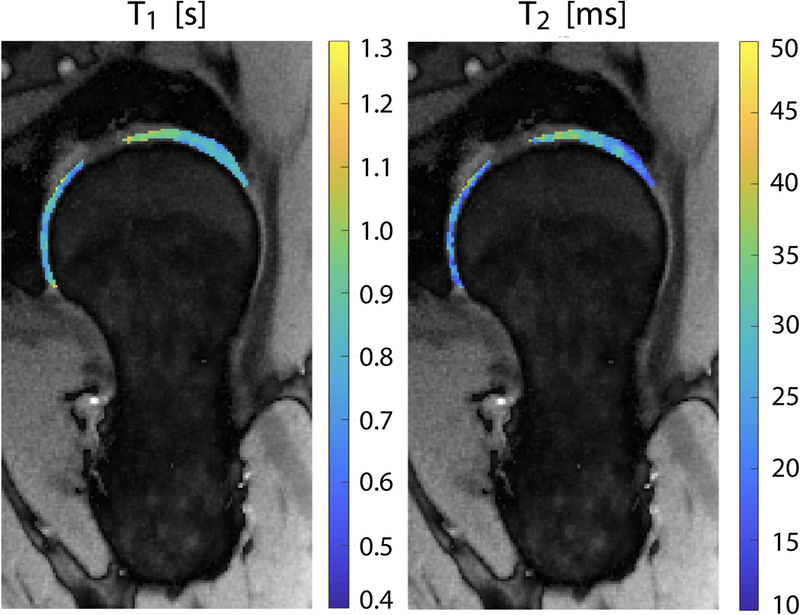
Spatial distribution of cartilage T1 and T2 for a representative radial section of the hip. Articular cartilage was segmented using a semi-automatic procedure and superimposed to the corresponding proton density map.
The median of T1 and T2 within the segmented hip cartilage (all six radial slices combined) was consistent among repeated acquisitions with different scanners for all three volunteers (Table 1). Table 2 shows that intra-scanner variability was approximately 1% and 3% for for T1 and T2, respectively. Inter-scanner variability was 2% for T1 and 5.5% for T2.
Table 1.
Median (InterQuartile Range) of T1 and T2 relaxation times (ms) in the hip articular cartilage of the three healthy subjects for six repeated scans, two on each of three different MR scanners
| T1 | T2 | |||||
|---|---|---|---|---|---|---|
| Subject 1 | Subject 2 | Subject 3 | Subject 1 | Subject 2 | Subject 3 | |
| Skyra 1–1 | 820 (241) | 861 (168) | 949 (226) | 25 (15) | 25 (16) | 26 (17) |
| Skyra 1–2 | 820 (241) | 861 (168) | 949 (226) | 25 (13) | 26 (15) | 28 (16) |
| Prisma 1 | 820 (205) | 904 (216) | 949 (185) | 26 (15) | 24 (15) | 29 (16) |
| Prisma 2 | 820 (196) | 904 (216) | 949 (185) | 24 (15) | 24 (16) | 29 (16) |
| Skyra 2–1 | 820 (241) | 904 (216) | 949 (185) | 24 (15) | 26 (15) | 26 (15) |
| Skyra 2–2 | 820 (196) | 861 (168) | 949 (185) | 24 (13) | 25 (15) | 28 (16) |
Table 2.
Estimated intra-scanner and inter-scanner variability (CV) of T1 and T2 relaxation times in the hip articular cartilage
| Intra-Scanner | Inter-Scanner | ||
|---|---|---|---|
| T1 | 1.15% | 1.99% | |
| T2 | 3.24% | 5.46% | |
DISCUSSION
The aim of this work was to introduce a new technique for clinically feasible quantitative imaging of the hip articular cartilage. Our goal was to rapidly acquire multiple parameter maps along six radial hip sections, as well as standardize data acquisition and analysis via automatic slice positioning and cartilage segmentation.
Our phantom results are consistent with accuracy and inter-scanner variability reported for other MRF techniques (13,16,20). In-vivo reproducibility is affected not only by the intrinsic reproducibility of the technique, but also by subject and slice positioning, and segmentation. A recent in-vivo reproducibility study reported 6% intra-scanner variability for hip cartilage T2 (21), whereas for our technique both intra- and inter-scanner T2 variability were below 6%. Bittersohl et al. repeatedly scanned 15 asymptomatic volunteers and reported 3.7%–6.8% variability for the mean T1 in the hip cartilage (22), whereas we found nearly perfect T1 reproducibility. Note that our results could be biased by as much as 2.5% due to the step size of the dictionary. Although clinically negligible, this potential bias could be reduced by using a finer dictionary, at the expenses of increased file size and computation time.
Our technique simultaneously yields high-resolution PD, T1 and T2 maps for six radial sections of the hip in 7:13 minutes, or 1:12 minutes scan time per slice when used in an interleaved multi-slice protocol. Previous work reported 17:41 minutes to acquire a single coronal T2 map of the hip with 0.3×0.3×4.0mm3 resolution (11), and 11 minutes to acquire a 3D sagittal T2 map of the hip with 0.4×0.4×1.5mm3 resolution (21). Scan time of approximately 9 minutes was reported for 3D T1 mapping of the hip at 1.5T with 0.8mm isotropic resolution (22). However, a variable flip-angle T1 mapping technique was used, which at 3T requires an additional B1 correction pre-scan (23). Other authors introduced a B1-insensitive 2D T1 mapping technique and used it to estimate cartilage T1 along six radial hip sections at 3T, which yielded 1:20 minutes scan time per slice with 0.6×0.6×5.0 mm3 resolution (24). Note that the technique presented in this work is intrinsically immune to B1 inhomogeneity, because the transmit field is modeled in the MRF dictionary.
One limitation of our phantom reproducibility study is that we did not account for temperature differences in the scanner room, which can cause variability in T1 and T2. In vivo, however, eventual temperature changes are usually small enough to be counteracted by thermoregulatory mechanisms of the human body and do not affect relaxation times in the hip joint. Another limitation is that all MR scanners were from the same vendor, due to current availability at our institution. Note, however, that a multi-vendor reproducibility study would pose additional challenges, since it would require access to proprietary information about the operation of scanner components in order to implement exactly the same pulse sequence within the MRF framework. While the automatic slice positioning method helps reproducibility, there is still a margin of variability associated with subject positioning, which we plan to overcome by developing a 3D version of our technique. We also expect that signal-to-noise ratio of the parametric maps could be further improved by optimizing the flip-angle train of the pulse sequence (25) for the range of T1 and T2 values expected in the hip cartilage. Additional limitations of our in vivo validation study are the small number of subjects and the absence of reference values to assess the accuracy of T1 and T2 estimates. Future work includes assessing the usefulness of quantitative cartilage evaluation on a large cohort of patients with hip pathologies.
In conclusion, we introduce a new technique that enables rapid acquisition of accurate PD, T1, and T2 maps for six radial hip sections. We showed that, by combining model-based parameter estimation together with automatic slice positioning and semi-automatic segmentation, quantitative cartilage evaluation appears to be highly reproducible. Our technique could enable to translate quantitative cartilage assessment into routine hip imaging protocols, and to employ it for longitudinal studies and multi-center clinical trials.
Supplementary Material
Acknowledgments
GRANT SUPPORT: NIH R01 AR070297, NIH R21 EB020096, NIH P41 EB017183
UNBLINDED ACKNOWLEDGEMENTS: We would like to thank Dr. Catherine Petchprapa for insightful discussions on radial hip imaging.
REFERENCES
- 1.Katz JN, Losina E, Barrett J, Phillips CB, Mahomed NN, Lew RA, Guadagnoli E, Harris WH, Poss R, Baron JA. Association between hospital and surgeon procedure volume and outcomes of total hip replacement in the United States medicare population. J Bone Joint Surg Am 2001;83-A(11):1622–1629. [DOI] [PubMed] [Google Scholar]
- 2.Petchprapa CN, Dunham KS, Lattanzi R, Recht MP. Demystifying radial imaging of the hip. Radiographics 2013;33(3):E97–E112. doi: 110.1148/rg.333125030. [DOI] [PubMed] [Google Scholar]
- 3.Kubo T, Horii M, Harada Y, Noguchi Y, Yutani Y, Ohashi H, Hachiya Y, Miyaoka H, Naruse S, Hirasawa Y. Radial-sequence magnetic resonance imaging in evaluation of acetabular labrum. J Orthop Sci 1999;4(5):328–332. [DOI] [PubMed] [Google Scholar]
- 4.Plötz GM, Brossmann J, von Knoch M, Muhle C, Heller M, Hassenpflug J. Magnetic resonance arthrography of the acetabular labrum: value of radial reconstructions. Arch Orthop Trauma Surg 2001. September;121(8):450–7. [DOI] [PubMed] [Google Scholar]
- 5.Horii M, Kubo T, Hirasawa Y. Radial MRI of the hip with moderate osteoarthritis. J Bone Joint Surg Br 2000. April;82(3):364–8. [DOI] [PubMed] [Google Scholar]
- 6.Cicuttini F, Wluka A, Wang Y, Stuckey S. The determinants of change in patella cartilage volume in osteoarthritic knees. J Rheumatol 2002;29(12):2615–2619. [PubMed] [Google Scholar]
- 7.Cohen ZA, McCarthy DM, Kwak SD, Legrand P, Fogarasi F, Ciaccio EJ, Ateshian GA. Knee cartilage topography, thickness, and contact areas from MRI: in-vitro calibration and in-vivo measurements. Osteoarthritis Cartilage 1999;7(1):95–109. [DOI] [PubMed] [Google Scholar]
- 8.Schmid MR, Notzli HP, Zanetti M, Wyss TF, Hodler J. Cartilage lesions in the hip: diagnostic effectiveness of MR arthrography. Radiology 2003;226(2):382–386. [DOI] [PubMed] [Google Scholar]
- 9.Keeney JA, Peelle MW, Jackson J, Rubin D, Maloney WJ, Clohisy JC. Magnetic resonance arthrography versus arthroscopy in the evaluation of articular hip pathology. Clin Orthop Relat Res 2004(429):163–169. [DOI] [PubMed]
- 10.Bashir A, Gray ML, Hartke J, Burstein D. Nondestructive imaging of human cartilage glycosaminoglycan concentration by MRI. Magn Reson Med 1999;41(5):857–865. [DOI] [PubMed] [Google Scholar]
- 11.Watanabe A, Boesch C, Siebenrock K, Obata T, Anderson SE. T2 mapping of hip articular cartilage in healthy volunteers at 3T: a study of topographic variation. J Magn Reson Imaging 2007;26(1):165–171. [DOI] [PubMed] [Google Scholar]
- 12.Beck M, Leunig M, Parvizi J, Boutier V, Wyss D, Ganz R. Anterior femoroacetabular impingement: part II. Midterm results of surgical treatment. Clin Orthop Relat Res 2004(418):67–73. [PubMed]
- 13.Ma D, Gulani V, Seiberlich N, Liu K, Sunshine JL, Duerk JL, Griswold MA. Magnetic resonance fingerprinting. Nature 2013. March 14;495(7440):187–92. doi: 10.1038/nature11971. [DOI] [PMC free article] [PubMed] [Google Scholar]
- 14.Lattanzi R, Glaser C, Mikheev AV, Petchprapa C, Mossa DJ, Gyftopoulos S, Rusinek H, Recht M and Kim D, A B1-insensitive high-resolution 2D T1 mapping pulse sequence for dGEMRIC of the hip at 3 Tesla; Magnetic Resonance in Medicine, vol 66(2), 2011, p. 348–355. [DOI] [PMC free article] [PubMed] [Google Scholar]
- 15.Buonincontri G & Sawiak SJ MR fingerprinting with simultaneous B1 estimation. Magn. Reson. Med doi: 10.1002/mrm.26009 (2015). [DOI] [PMC free article] [PubMed]
- 16.Cloos MA, Knoll F, Zhao T, Block KT, Bruno M, Wiggins GC, Sodickson DK. Multiparametric imaging with heterogeneous radiofrequency fields. Nat Commun 2016. August 16;7:12445. doi: 10.1038/ncomms12445. [DOI] [PMC free article] [PubMed] [Google Scholar]
- 17.Winkelmann S, Schaeffter T, Koehler T, Eggers H, Doessel O. An optimal radial profile order based on the Golden Ratio for time‐resolved MRI. IEEE Trans Med Imaging 2007;26:68–76. [DOI] [PubMed] [Google Scholar]
- 18.Assländer J, Cloos MA, Knoll F, Sodickson DK, Hennig J and Lattanzi R, Low rank alternating direction method of multipliers reconstruction for MR-Fingerprinting; Magnetic Resonance in Medicine, vol 79(1), 2018, p. 83–96. [DOI] [PMC free article] [PubMed] [Google Scholar]
- 19.Weigel M Extended phase graphs: dephasing, RF pulses, and echoes - pure and simple. J. Magn. Reson. Imaging 41, 266–295 (2014). [DOI] [PubMed] [Google Scholar]
- 20.Jiang Y, Ma D, Keenan KE, Stupic KF, Gulani V, Griswold MA. Repeatability of magnetic resonance fingerprinting T(1) and T(2) estimates assessed using the ISMRM/NIST MRI system phantom. Magn Reson Med 2017. October;78(4):1452–1457. [DOI] [PMC free article] [PubMed] [Google Scholar]
- 21.Nemeth A, Di Marco L, Boutitie F, Sdika M, Grenier D, Rabilloud M, Beuf O, Pialat JB. Reproducibility of in vivo magnetic resonance imaging T(1) rho and T(2) relaxation time measurements of hip cartilage at 3.0T in healthy volunteers. J Magn Reson Imaging 2018. April;47(4):1022–1033. [DOI] [PubMed] [Google Scholar]
- 22.Bittersohl B, Hosalkar HS, Haamberg T, Kim YJ, Werlen S, Siebenrock KA, Mamisch TC. Reproducibility of dGEMRIC in assessment of hip joint cartilage: a prospective study. J Magn Reson Imaging 2009. July;30(1):224–8. [DOI] [PubMed] [Google Scholar]
- 23.Siversson C, Chan J, Tiderius CJ, Mamisch TC, Jellus V, Svensson J, Kim YJ. Effects of B1 inhomogeneity correction for three-dimensional variable flip angle T1 measurements in hip dGEMRIC at 3 T and 1.5 T. Magn Reson Med 2012. June;67(6):1776–81. [DOI] [PubMed] [Google Scholar]
- 24.Lattanzi R, Glaser C, Mikheev AV, Petchprapa C, Mossa DJ, Gyftopoulos S, Rusinek H, Recht M, Kim D. A B1-insensitive high resolution 2D T1 mapping pulse sequence for dGEMRIC of the HIP at 3 Tesla. Magn Reson Med 2011. August;66(2):348–55. [DOI] [PMC free article] [PubMed] [Google Scholar]
- 25.Asslaender J, Novikov DS, Lattanzi R, Sodickson DK and Cloos M. Hybrid-State Free Precession in Nuclear Magnetic Resonance. arXiv:1807.03424 [physics.med-ph] [DOI] [PMC free article] [PubMed]
Associated Data
This section collects any data citations, data availability statements, or supplementary materials included in this article.


