

Abstract
Aims:
Physical exercise is recommended to individuals with type 1 diabetes (T1D) yet the effects of exercise on glycemic control have not been well-established. We evaluated the impact of different modes of exercise on glycemic control in people with T1D.
Methods:
In a 3-week randomized crossover trial, 10 adults with T1D (4 M, 6 F; age 33 ± 6 yrs, duration of diabetes 18 ± 10 yrs, A1C 7.4 ± 1%) were assigned to three weeks of intervention: aerobic (treadmill at 60% of VO2max), resistance (8-12 repetitions of 5 upper and lower body exercises at 6080% of 1-RM), or no exercise (control). During each exercise week, participants completed two monitored 45-minute exercise sessions. For each week of the study we analyzed participant’s insulin pump data, sensor glucose data and meal intake using a custom smart-phone app. The primary outcome was percentage of time in range (glucose >3.9 mmol/L and <=10 mmol/L) for the 24 hours after each bout of exercise or rest during the control week. The study was registered on ClinicalTrials.gov (NCT:02687893).
Results:
Aerobic exercise caused a mean glucose reduction during exercise of 3.94 ± 2.67 mmol/L while the reduction during resistance was 1.33 ± 1.78 mmol/L (p=0.007). Mean percentage time in range for the 24 hours following resistance was significantly greater than during the control period (70% vs. 56%, p=0.013) but not following aerobic (60%).
Conclusions:
Results from this pilot study indicate that while considering various confounders, resistance training could have improvements on glycemic control in this population.
Keywords: type 1 diabetes, exercise, glycemic control, meal intake, energy expenditure
Introduction
In the coming decades the number of patients with type 1 diabetes (T1D) is expected to triple [1]. Less than a third of the adults with T1D achieve the target glycated hemoglobin (A1C) level of lower than 7.0% [2] and a majority are overweight or obese [3,4]. Bohn et al, have recently shown that less than a fifth of adults with T1D manage to meet physical activity recommendations [5]. Overweight and obese weight status in individuals with T1D is higher than the general population and prevalence is rising; this appears to be unrelated to aging and instead related to lack of physical activity and other clinical factors [6]. Currently, adults living with T1D are recommended to perform 150 minutes of moderate aerobic, 75 minutes of vigorous aerobic, or a combination thereof, along with resistance training on two days each week with no more than two consecutive days of no activity [7]. Regular physical activity in individuals with T1D provides many physiological and psychological benefits including improving body composition, increased cardiorespiratory fitness, improved endothelial function, and improved blood lipid profile [8–10]. In addition, exercise also reduces total daily insulin requirements, stress and depression while improving the overall sense of well-being and quality of life [11–14].
Physical activity has long been associated with improvements in glycemic control in adults with type 2 diabetes (T2D) [15]. These improvements have been shown to be modest when the physical activity was either aerobic or resistance training, but a combination of both modalities has demonstrated the greatest improvements to glycemic control in adults with T2D [16]. However, in individuals with T1D, the effects of physical activity on glycemic control are not clear [11,12,17]. Individuals with T1D routinely experience rapid changes in glucose levels during and immediately after physical activity, leading to loss of control and fear of hypoglycemia [12, 14,17,18].
Without advanced planning, these glucose changes are rather challenging to manage. Nocturnal hypoglycemia is common on nights after engaging in physical activity [19]. Optimizing insulin dosage prior to exercise is challenging for many people with T1D engaging in physical activity. Insulin dosage changes have to be made up to 90 min before the start of the exercise [14, 20] and depending on the modality (aerobic/resistance training) and intensity of exercise (level of exertion), altering insulin dosing may not result in achieving appropriate glycemic control [14, 20]. Another strategy adopted by many individuals to prevent hypoglycemia, is to maintain blood glucose levels higher during and after exercise by increasing the consumption of carbohydrates [21,22]. While many groups have highlighted the acute challenges faced by people with T1D during various types of exercise, there has not yet been a study showing how exercise impacts glycemic control during longer periods after exercise is performed [23–25]. In this paper we examine the impact of aerobic exercise and resistance training and related energy expenditure on glycemic control. We further examine how exercise impacts both insulin dosing requirements along with the amount of dietary intake in a period of 24 hours after a bout of exercise. We hypothesized that glycemic control during a period of 24 hours post-exercise would be improved.
Methods
Study participants
Ten adults (6 Females / 4 Males) with T1D, who were sufficiently active and physically fit were recruited (mean ± SD: age 33 ± 6 years, BMI 24.4 ±2.1 kg/m2, duration of diabetes 18 ± 10 years, A1C 7.4 ± 1 % ,VO2max 46.8 ± 11.55 mL/kg/min, fat mass 30 ± 7%) to participate in this randomized, three treatment, open, single-center crossover study. The inclusion criteria for this study were: adults with T1D (diagnosis of condition >1 year); age 21–45 years: this age group was chosen to limit exposure to unknown cardiovascular risk during exercise as is recommended in [26]; body mass index <30 kg/m2; physically active; currently on an insulin pump. Sufficiently active was defined as participating in at least 150 min of aerobic activity at moderate intensity per week for the last six months based on the guideline by ACSM [27]. Participants in this study were active at moderate intensity for 7.3± 4 hr/week. The exclusion criteria included the following: cardiovascular disease, renal dysfunction or any condition that would preclude exercise.
The Institutional Review Board at the Oregon Health and Science University (OHSU) approved the study protocol and consent form. This current paper is a secondary analysis using the data collected during the study to examine the effect of exercise on sleep in adults with type 1 diabetes [19]. The study was registered on ClinicalTrials.gov (NCT:02687893). Informed consent was obtained from every individual.
Study design
In this pilot study, we performed a secondary analysis on data that was previously published in Reddy et al. [19], a study which found that exercise impacted sleep on nights following exercise. A paired means power analysis was used to carry out sample size power analysis. A total sample size of 10 achieved 90% power to detect a mean of paired differences of 30 minutes in sleep loss. This is with an estimated standard deviation of differences of 25 and with a significance level (alpha) of .05 using a 2sided paired t-test comparing sleep loss during the weeks of exercise interventions with the week without any explicit exercise. In the current analysis, we hypothesized that glycemic control during a period of 24 hours post-exercise would be improved. The primary outcome was the percent time in a target glucose range of between 3.9 and 10 mmol/L during the 24 hours after exercise. Participants’ glucose levels, physical activity, insulin dosage, food intake and sleep were continuously measured over the course of four consecutive weeks. Glucose levels were tracked using a continuous glucose monitor (CGM; Dexcom G4 or G4 Share, Dexcom, San Diego, CA, USA). Participants were blinded to the sensor glucose readings. Physical activity and sleep were monitored using an activity monitor (ActiGraph wGT3X-BT; ActiGraph, Pensacola, FU, USA). Participants managed their own insulin dosage using their personal insulin pump and a capillary blood glucose meter (CBG meter, Contour Next glucose meter; Ascensia Diabetes Care, NJ, USA). Food intake was measured using a custom built food-tracking Android smartphone app. A smart-phone (Galaxy S4; Samsung, CA, USA) loaded with this app was distributed to the participants. The first week of the study was a run-in week where participants became accustomed to the wearable sensors. After the run-in, participants performed in-clinic aerobic exercise twice weekly for one week, in-clinic resistance training twice weekly for one week, and no structured exercise for one control week. The order of the aerobic, resistance, and control weeks were randomized for each subject. Block randomization (size of six) with a 1:1:1 ratio was computer generated for the sequence of the interventions. One of the study coordinators carried out the randomization and the allocations were revealed at the start of the admission visit.
Study Protocol
All participants completed a screening visit, training visit, and four structured exercise sessions. During the screening visit, baseline examinations included assessment of anthropometric data, physical status and a VO2max test according to the Bruce Protocol on a Medtrack ST 55 treadmill (Quinton, WA, USA). Oxygen consumption was measured during the VO2max test. The participants wore an air-tight mask (Hans Rudolph Inc., MO, USA), which had a gas sensor (Cosmed, Rome, Italy) attached to it, while heart rate was monitored using a Polar Electro T61 chest heart rate monitor (Polar Inc., Lake Success, NY, USA). Bruce protocol was used to determine VO2max. Body composition was estimated by a dual X-ray absorptiometry (DEXA) scan using a Hologic Discovery wi (Hologic, Bedford, USA, Apex 4.0 software).
Participants returned on a separate day for the training visit, to learn how to use the CGM, how to use the activity monitor and how to accurately record the food intake. Participants performed a one-repetition maximum (1-RM) test for bench press, leg press and seated row during this visit. This was performed to set the exercise intensity (i.e. weight lifted) for resistance training sessions. We chose not to conduct 1RM tests on leg extension and flexion exercises because they are single joint movements and according to recommended guidelines should be avoided in favor of multi-joint movements to minimize injury risk during maximal testing. Rather we estimated training loads for single joint exercises using the multiple RM approach to determine each participant’s 8RM workload [28]. Participants replaced the CGM each week (at least a day before the exercise visit) and calibrated the sensor at least twice daily using the CBG meter. Although participants were blinded to CGM values, for safety, glucose alerts were set at 3.1 mmol/L and 16.67 mmol/L.
In-clinic exercise sessions
Each participant did 2 sessions of monitored aerobic exercise (AE) during the aerobic exercise week and 2 sessions of monitored resistance training (RT) during the resistance week. Participants arrived at the laboratory at 4:00 pm for each of the exercise sessions. For both the aerobic and resistance exercise weeks, the same exercises were performed on two separate days with one day in between during which participants were instructed not to exercise (e.g. RT sessions on Tuesday and Thursday). There were at least 48 hours between the exercise visits. Participants were instructed to refrain from formal exercise 24 hours prior to and 24 hours after their scheduled exercise. Actigraph data collected during this time was used to confirm that participants complied with this instruction. A study coordinator also contacted participants on the day following the in-clinic exercise session and asked questions about compliance during this phone call. The days of the week on which exercise sessions were conducted were identical for each participant across weeks. Between each intervention week there was at least 4 days. All exercise sessions were conducted on weekdays excluding Friday. During each exercise session, participants were outfitted with a Zephyr Biopatch (Zephyr Technology, Annapolis, VA, USA) that included a 2 lead ECG based heart rate monitor to continuously monitor heart rate. Resistance exercise sessions, following a brief warm up period, included three sets of 8–12 repetitions at 60-80% of 1-RM of five different exercises (leg press, bench press, leg extension, leg flexion and seated row) with a 90 second rest period between exercises and sets (total duration of 45min). The exercises were chosen to recruit similar volumes of upper and lower body muscle mass, using machine based exercises to control movement and for safety, rather than equal numbers of exercises per group. While we allowed participants some flexibility in doing 8 to 12 reps to enable a tolerable workout, participants generally did not change their weight load or number of reps during a session. The Borg perceived exertion scale was used to estimate fatigue and to maintain a moderate intensity rating of 12-14 for each exercise performed. The duration of each set of exercise and the duration of the rest was closely tracked using an electronic data capture tool: Research Electronic Data Capture (REDCap), a secure web-based data capture application hosted at OHSU [29]. AE consisted of 45 min of treadmill exercise. Based on the VO2max value obtained during the first visit, the heart rate value at the 60% VO2max value was calculated and used during the aerobic training visits. During each exercise training visit, the heart rate was closely monitored and treadmill speed and grade were adjusted to keep the participants workrate at 60% VO2max. The duration of the exercise intervention was kept consistent between both types of exercise; but the energy expenditure between these two types of exercises was not controlled for in this study. Capillary glucose was checked before the start of the exercise period and immediately after exercise or if the subject experienced any symptoms of hypoglycemia. Each exercise session was followed by 60 minutes of monitored recovery. Participants were provided with a pre-selected standardized meal of 540 calories (23 % protein, 47 % carbohydrate, and 30 % fat) to eat during the recovery period, the identical meal was provided during all in-clinic exercise sessions
Exercise energy expenditure
Energy expenditure (EE) during the exercise period was estimated to understand the differences between the two types of exercise interventions. Using the data collected during the VO2max test, a relationship (ordinary least squares linear regression) between the oxygen uptake and the heart rate data was created. We used this equation to estimate the amount of oxygen uptake based on the heart rate data measured during each in-clinic session. EE during the continuous aerobic exercise was estimated by the cumulative oxygen uptake during the exercise period and converting the oxygen uptake to kcal using the standard 1L of O2 to 5.0 kcal [30,31]. To estimate EE during the resistance training, we used the nonsteady state model proposed by Reis and Scott [32] and Vezina et al.[33] by considering the oxygen uptake not only during each bout of exercise(~30 secs) but also during the recovery periods (~90 secs) in between each bout of resistance training. Both the recorded exercise EE and recovery EE were converted to kcal. The EE values during exercise were calculated using the standard conversion of 1L of O2 to 5.0 kcal, whereas the EE values during recovery were calculated using the non-steady state conversion of 1L of O2 to 4.7 kcal.
Nutritional Assessment
All participants were verified to be experienced at carbohydrate counting prior to this study, by asking if they used carbohydrate counting techniques and had recently been educated about it. Each participant was provided with an Android study phone preloaded with a custom food meal photography application. All participants were trained on the usage of the application and were instructed to take pictures of all of the meals consumed during the study. Participants were provided with a ruler to be included in the photograph to provide an approximate size measure for the meal. The custom app provided the ability for the participant to enter the estimated carbohydrate amount, their CBG value at the time of the meal, the type of meal (breakfast, lunch, dinner, snack or hypoglycemic treatment) and an optional text description of the meal. Each entry was uploaded to the study database with the date and time recorded. A trained dietitian analyzed all the meals for each subject on the day of the in-clinic exercise visit and the day after the exercise visits to estimate the meal contents and quantity of each meal. The dietitian also analyzed meal data during matched days of the control week. Energy and macronutrient composition of meals was analyzed with ESHA Food Processor SQL Software (ESHA Research, Salem, OR, USA [34].
Statistical Analysis
Meal intake, exogenous insulin delivery and glycemic control metrics were calculated over the 24 hr. period from the end of the exercise to the same time next day. One subject failed to report any meal intake on multiple study days and as such, dietary records were only analyzed for 9 subjects and they were included in all of the food analyses. We performed the Shapiro-Wilk test to evaluate the assumption of normality and for the normally distributed values, we analyzed the relationship between each outcome and the intervention using a randomized mixed effects regression model with a random intercept to account for correlation between observations on the same participant, since two interventions were compared against a single control, significance was adjusted to 0.025. We included an effect for the day to control for possible carryover effects. The Wilcoxon rank-sum test was used to assess differences in the non-normally distributed duration of hypoglycemia. Data are presented as mean ± SD or mean (95% CI) or for data that are non-normally distributed median and interquartile range (IQR). All statistical analyses were conducted in R (version 3.4.2) [35]
Results
Results below are described in two sections with regards to two endpoints: first during the in-clinic exercise period and second for the 24 hr. post exercise period.
Ten adults (6 Females / 4 Males) with T1D had the following baseline characteristics, data is represented as mean ± SD: age 33 ± 6 years, BMI 24.4 ± 2.1 kg/m2, duration of diabetes 18 ± 10 years, A1C 7.4 ± 1 % , VO2max 46.8 ± 11.55 mL/kg/min, Fat 30 ± 7%, total daily insulin dose 40.99 ±7.26 units, resting heart rate 62.8 ± 7 beats/min, daily time in moderate to vigorous physical activity 1.1 ± 0.7 hours/day.
In-clinic exercise visits
At the start of the exercise bouts there was no difference between the glucose levels (aerobic exercise (AE): 8.78 ± 3.22 mmol/L vs resistance training (RT) 8.72 ± 3.5 mmol/L) but the decrease in glucose levels during exercise was significantly different between the two exercise types. AE caused a precipitous reduction in sensor glucose value over the exercise period with mean glucose reduction of 3.94 ± 2.67 mmol/L while the reduction in sensor glucose was smaller during RT with the mean glucose reduction of 1.33 ± 1.78 mmol/L (p=0.007). By the end of the recovery period (60 min post exercise), the sensor glucose levels were not statistically different. CGM glucose values during the exercise and recovery periods are shown in Figure 1A. The mean heart rate during the AE bout was 144.6 ± 8 beats/min and the mean heart rate during the RT bouts was 112.3 ± 11 beats/min. Additional RT information is provided in Supplementary Table 1. The EE during the AE visits was significantly higher than during the RT visits, with the EE during the AE visits being 429 ±111 kcal and the EE during the RT visits being 252 ± 65 kcal (p<0.001). The EE values during the in-clinic visits are shown in Figure 1B. On average the participants had similar glucose and insulin on board at the start of the exercise interventions. The average insulin on board at the start of the aerobic exercise intervention was 4.56 ± 1 U and the average insulin on board at the start of the resistance training bout was 4.68 ± 1 U.
Figure 1:
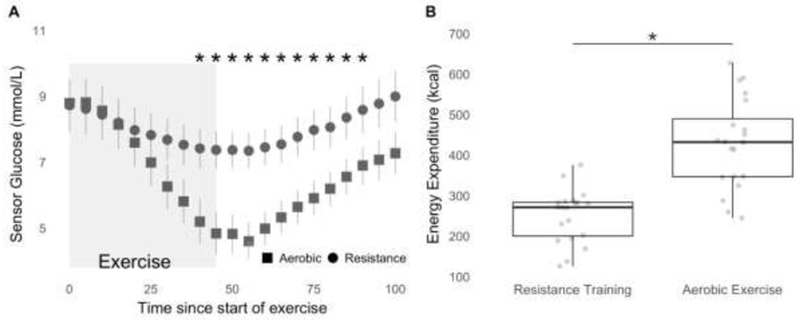
A: Glycemic response during the in-clinic exercise visits. Sensor glucose data is represented as Mean ± SE during the exercise (represented by box) and 60 min of recovery: ■ resistance training, •, aerobic exercise. * indicate the statistically significant difference between the two interventions based on the paired sample t-tests (p < 0.05).
B: Box plots with individual points indicating the estimated energy expenditure in kcal during the inclinic exercise sessions. EE between the visits was significantly different between the interventions. * indicates the statistically significant difference between the energy expenditure during the two types of interventions based on the paired sample t-test (p < 0.05)
24 hr. post exercise in home glycemic control
Mean glucose value for the 24 hr. period was the lowest after RT visits (8.01 ± 1.94 mmol/L) as compared with AE visits (8.80 ± 2.17 mmol/L) and during the control week was 9.5 ± 2.7 mmol/L. Mean glucose for the 24 hr. post RT visit was 1.39 mmol/L lower than the mean glucose for the 24 hours matched control week (95% CI −2.25 -- −0.55, p = 0.002, Z = −3.29). However, the mean glucose for the 24 hr. post AE visits was only 0.66 mmol/L lower than the 24 hour matched control week and the difference was not significant (95% CI −1.51 -- −0.19, p = 0.134, Z = −1.53). Adjusting for the total insulin dosage within the random-effects model, we observed a mean glucose during the 24 hr. period post RT exercise that was 1.03 mmol/L lower compared with the control week (95% CI −1.90 -- −0.17, p = 0.024). But making the same adjustment for total insulin dosage, the mean glucose during the 24 hr. period post AE visits was lower than the control week by only 0.40 mmol/L, and the difference was again not significant (95% CI −1.24 −-0.45, p = 0.39). When controlling for food intake, the mean glucose was still lower during the 24 hr. post RT period compared with the control week by 0.96 mmol/L (95% CI −1.82 --0.10, p = 0.036). When controlling for food intake, the drop in mean glucose following AE was smaller at 0.06 mmol/L and not significantly different than the control week (95% CI −0.98 −-0.86, p = 0.903). After adjusting for either insulin dosage or meal intake, the mean glucose was significantly lower after RT but there was no difference from control after AE visits.
Time in range (% of time with sensor glucose between 3.9 mmol/L and 10 mmol/L) over the 24hr. period after the RT visits was 70.3 ± 15% while the time in range over the 24 hr. period after the AE visits was 60.5 ± 22%. During the control week, the time in range was 55.7 ± 27%. We observed a statistically significant improvement in time in range of 14.61% (95% CI 3.50-25.71, p = 0.013, Z = 2.6) for the RT visit compared with the control week, while the increased time in range after the AE visits was only 4.72% compared with the control week and the change was not significant (95% CI −6.38-15.83, p = 0.41, Z = 0.8).
During the 24 hr. period after the RT visits the time in hyperglycemia (% of time with sensor glucose >10 mmol/L) was 23.1 ± 17% and after the AE visits was 32.9 ± 25%. Participants spent 39.1 ± 28% in hyperglycemia during the same period in the control week of the study. We observed significant reduction in the time in hyperglycemia by −16% (95% CI −26.69 —5.32, p = 0.005, Z = −2.94) for the 24 hr. period following RT visits compared with the control week. The reduced time in hyperglycemia after the AE visits was only −6.25% (95% CI −16.94 -- 4.43, p = 0.258, Z = −1.15) compared with the control week.
The median time in hypoglycemia (% of time with sensor glucose =<3.9 mmol/L) [IQR] over the 24 hr. period after the AE visits was 3.72[9.83] % and was 3.63[6.07] % after the RT visits, while during the control week this duration was 1.86[7.15] %. Subjects did not experience statistically significant differences in time in hypoglycemia after either AE or RT visits as compared with the control week of the study.
Table 1, shows the summary measures of the 24 hr. glycemic data. Individual markers of 24 hr. glycemic control are shown in Figure 2.
Table 1:
Summary of the average glycemic control, insulin dosage and energy intake for the 24 hr. period after the exercise visit. Randomized mixed effects regression model with a random intercept to account for correlation between observations on the same participant was used to determine the significance of each outcome relative to the intervention. Since two interventions were compared against a single control, significance was adjusted to 0.025. (*p<0.025). Time in hypoglycemia is shown as median [IQR]
| Control | Aerobic Exercise | Resistance Training | |
|---|---|---|---|
| Time in range (%) | 55.7 ± 25 | 60.5 ± 22 | 70.3 ± 15* |
| Time in hypoglycemia (%) | 1.86[7.15] | 3.71[9.83] | 3.63[6.07] |
| Time in hyperglycemia (%) | 39.1 ± 28 | 32.9 ± 25 | 23.1± 17* |
| Glucose Mean (mmol/L) | 9.5 ± 2.7 | 8.80 ± 2.17 | 8.01 ± 1.94 * |
| Energy Intake (kcal/day) | 1347 ± 606 | 1970 ± 630* | 1816 ± 362* |
| 24 hr. Insulin dosage (U) | 43.6 ± 9 | 40.8 ± 9 | 39.8 ± 9* |
| 24 hr. Bolus Insulin dosage (U) | 19.2 ± 10 | 18.3 ± 8 | 15.7 ± 8* |
| 24 hr. Basal Insulin dosage (U) | 24.4 ± 6 | 22.5 ± 5* | 24.1 ± 5 |
Figure 2:

Improvements in glycemic outcomes for each study participant are shown in this figure. In the 24 hr. period following RT, all subjects experience positive reductions in mean glucose value and all but one subject experienced reductions in time in hyperglycemia and improvement in time in range compared with the control week. But the same outcomes after AE are not as consistent. In each panel data for each individual subject is shown with ■ indicating resistance training and • indicating aerobic exercise. Inset in each panel is the numerical difference in the outcome measured for the intervention represented in the panel.
Energy and carbohydrate intake
A total of 112 week days of meal data were analyzed for this study. Participant recorded meal data was corroborated with both the insulin pump bolus data and the corresponding glucose sensor data. To account for missing meal data we removed that day’s data from the analysis if either the participant had not reported more than one main meal for the day or if the total daily estimated consumption was less than 1000 kcals. Nine underreported days from 4 different subjects met the criteria to be deleted from the analysis leaving 103 days of nutrient intake. Participants had a significantly higher amount of energy intake during the 24 hr. after both types of in clinic exercise visits relative to the control days. The average energy intake was higher after the AE visits and RT visits compared with the control days by 623 ± 158 kcal (p< 0.001) and 468 ± 145 kcal (p=0.003), respectively. Controlling for meal intake when looking at mean glucose during the 24-hour period after the RT visits, we observed a lower mean glucose during the 24 hr. period post RT that was less than during the control week by 0.96 mmol/L (95% Cl 1.82 — −0.10, p = 0.036). Time in range was also higher following RT compared with the control week when controlling for meal intake by 11.74% (p=0.051). When comparing mean glucose following AE versus the control week while making the same adjustment for meal intake, we found that the mean glucose was slightly lower during the 24 hr. period post AE, but the 0.06 mmol/L was smaller and not significant (95% CI −0.98 --0.86, p = 0.903). After controlling for meals, time in range following AE was only slightly higher compared with the control week at 0.77% and was not significant (p=0.9).
There was a higher need for hypoglycemic treatments during the 24 hr. period after the AE and RT visits compared with control days whereby the total carbohydrate intake was higher than the control week by 77± 17 g (p< 0.001) for AE and 42 ± 19g (p=0.02) for RT. Figure 3A shows the differences in the energy intake during the different weeks of the study.
Figure 3:

A: Box plots with individual data points indicating the nutritionist estimated energy intake from the meal pictures collected during the 24 hr. period after the in-clinic exercise visit during each intervention week. The energy intake was significantly higher during the 24 hr. after the aerobic and resistance training in-clinic sessions, as indicated by the * based on the randomized mixed effects regression model with a random intercept to account for correlation between observations on the same participant (p<0.025)
B: Box plots with individual data points indicating the insulin dosage downloaded from the insulin pump during the 24 hr. period after the in-clinic exercise visit during each intervention week. The total insulin dosage was significantly lower during the 24 hr. after the resistance training in-clinic sessions, as indicated by the * based on the randomized mixed effects regression model with a random intercept to account for correlation between observations on the same participant (p<0.025).
Twenty-four hour post exercise activity levels
Participants were instructed to refrain from any structured and formal activity during the 24 hr. prior to and 24 hr. after their scheduled exercise or control period. There were no significant differences in time spent in the moderate to vigorous physical activity (MVPA) between the three periods. Participants spent 302 ± 118 minutes in MVPA during the control period, 305 ± 92 minutes in MVPA during the 24 hr. period after AE and 275 ± 96 minutes in MVPA after RT (p=NS).
Insulin administration
Insulin dosage data is shown in Table 1. Despite an increase in both energy and carbohydrate intake, the total insulin dosage during the 24 hr. period, was not significantly higher for days following either types of exercise visits as compared with the control days. Rather, basal insulin dosage was significantly lower by 2 ± 0.4U of insulin after the AE visits (p < 0.001) as compared with control days. Insulin usage was lowered by only 0.4 ± 0.5U of insulin after RT visits compared with the control week (p=0.3). Participants injected significantly less bolus insulin after the RT visits, a reduction of 3.5 ± 1.5U of insulin (p=0.01) as compared with control days as opposed to a reduction of only 0.9 ± 2.7U of insulin (p=0.5) after the AE visits. Figure 3B shows the differences in the total insulin dosage during the different weeks of the study.
Discussion
Physical exercise is a cornerstone of diabetes management, but recent reviews have shown no clear evidence of glycemic benefit due to physical activity in adults with type 1 diabetes [11, 14, 16, 36]. However, exercise could provide a potential improvement in A1C in children and adolescents [8]. The present study highlights that RT is a promising strategy that can lead to improved glycemic control, but for AE the results are not as significant. In this study we demonstrate that during the 24 hr. period after either intervention, subjects increased meal intake both to manage hypoglycemic episodes and increased consumption of post dinner snacks to prevent nocturnal hypoglycemia as was speculated in Kennedy et al [11]. We also show that the participants used less insulin following both AE and RT exercise interventions, with significantly less bolus insulin after the RT visits and significant reduction in basal insulin after the AE visits. The decrease in bolus after RT could be due to either less correction boluses or reduced meal related insulin boluses. We also showed that the decrease in glucose during RT is less compared with AE, which confirms prior reports [24]. But we also found that the time spent in hypoglycemia during the 24 hr. period after either bout of exercise was no different as compared with the control week. Another insight generated by this study was that EE during AE and RT are significantly different, with participants during the RT bout expending less energy compared with AE and then subsequently consuming less food after the exercise compared with AE.
People with T1D find it challenging to dose insulin appropriately for meals and this becomes more challenging when exercise must also be considered as exercise is known to affect insulin sensitivity for many hours after exercise [36]. This study further expands on the published literature by investigating the effects of physical activity (RT and AE) on glycemic control during the 24 hr. period after the intervention while controlling for total insulin dosed and/or meal intake. These data highlight that individualized physical activity regimes could augment current insulin therapies to achieve optimal glycemic control. The responses to exercise are heterogonous in our subjects but most improvement in time in range was experienced by individuals who spent higher duration of time in the hyperglycemic range during the control weeks. Engaging in specific strategies to adjust insulin doses and minimize excessive carbohydrate consumption before, during and after exercise could help improve glycemic control and prevent dysglycemia.
Three prior studies on people with T1D have demonstrated that RT could provide improvements in A1C [37–39]. But a recent non-randomized long term study conducted in 8 adults with T1D who participated in unsupervised recreational training comprised of both AE and RT showed no improvement in A1C [40]. This inconsistency may have been due to the fact that both AE and RT exercises were performed during this study. As we show in the current study, RT showed significant improvement in glycemic outcomes while AE did not. The inconsistencies may also be explained by the fact that these studies have not accounted for varying meal and insulin intake during the monitoring period, and that metrics beyond A1C are important to consider [41,42]. A regular exercise regime of RT has been demonstrated to elicit beneficial metabolic responses (reductions in A1C and increased insulin sensitivity) in individuals with T2D due to gains in muscle mass and improved mitochondrial oxidative capacity [43,44].
Limited stores of muscle and liver glycogen stores are used as energy substrates during aerobic and resistance exercise, with the source and relative rate of glycogen depletion dependent upon the type and intensity of training [45]. The effects of either type of modality on glycemic levels can often last for several hours after exercise completion. As observed in this study, increased energy consumption after both exercise modalities, could be a result of needing to replenish glycogen stores. Other studies have shown that glucose uptake by the exercising muscles may be enhanced for many hours and often overnight [25]. While we strove to have participants performing both aerobic and resistance training at moderate intensities, it is possible that the relative rates of glycogen depletion and other sources of depletion (e.g., liver vs. muscle) differed between the two modalities and could account for some of the variation in glucose dynamics between AE and RT.
This pilot study had a few limitations including a small sample size. We have plans to replicate this study in a larger number of subjects. Another limitation is that we did not test other exercise modalities such as intermittent high-intensity interval training or a combination of both AE and RT, thus our findings here should be interpreted accordingly. We plan to investigate alternative exercise modalities in future projects to continue to understand how exercise impacts glycemic control. Another limitation of the current study is that while we controlled for the duration and intensity of exercise, we did not control for the energy expenditure between the two exercise modalities. It is not possible to simultaneously control for duration, intensity, and energy expenditure, and we chose in this study to control for the first two. In the future, it would be important to study whether these results hold when energy expenditure is maintained constant between the exercise modalities. A further limitation was that while more than half of the participants were female, we did not collect information on the female participants’ menstrual cycle, which is known to impact glucose levels.
Conclusions
Resistance training may improve glycemic control in adults with T1D, even when adjusting for changes in meal intake and changes in insulin dosage after the exercise event. The benefit of aerobic exercise on glycemic control may be tempered by increased amounts of food consumed during the day following exercise to balance increased energy expenditure.
Supplementary Material
Key Messages:
Resistance training may improve glycemic control in adults with type 1 diabetes.
Glucose levels tend to decline less during resistance exercise compared with during aerobic exercise. Resistance exercise may result in a decreased mean glucose and increased time in range during the 24hours after exercising.
Acknowledgements
RR and PGJ developed the protocol for the study, performed the data analysis and wrote the manuscript. RR and AW contributed to the meal intake data analysis. RR, AW, JEY, KWS, JRC and MG contributed to the data collection and to the manuscript writing. JRC and PGJ have a financial interest in Pacific Diabetes Technologies Inc., a company that may have a commercial interest in the results of this research and technology. The guarantor of this research is Peter Jacobs who takes responsibility for the contents of this article.
Funding Sources:
This work was supported by the National Institutes of Health [grant 1DP3DK101044], National Center for Advancing Translational Sciences of the National Institutes of Health under award number UL1TR0002369 and The M.J. Murdock Charitable Trust.
Abbreviations:
- T1D
type 1 diabetes
- A1C
glycated hemoglobin
- T2D
type 2 diabetes
- CGM
continuous glucose monitor
- CBG
capillary blood glucose
- 1-RM
one-repetition maximum
- AE
aerobic exercise
- RT
resistance training
- EE
energy expenditure
- OHSU
Oregon Health and Science University
- DEXA
Dual X-ray absorptiometry
Footnotes
Publisher's Disclaimer: This is a PDF file of an unedited manuscript that has been accepted for publication. As a service to our customers we are providing this early version of the manuscript. The manuscript will undergo copyediting, typesetting, and review of the resulting proof before it is published in its final citable form. Please note that during the production process errors may be discovered which could affect the content, and all legal disclaimers that apply to the journal pertain.
Conflicts of Interest
RR, AW, JEY, KWS and MG have no conflicts of interest with this study. JRC and PGJ have a financial interest in Pacific Diabetes Technologies Inc., a company that may have a commercial interest in the results of this research and technology.
References:
- [1].Imperatore G, Boyle JP, Thompson TJ, Case D, Dabelea D, Hamman RF, et al. Projections of type 1 and type 2 diabetes burden in the US population aged< 20 years through 2050. Diabetes Care 2012;35:2515–20. [DOI] [PMC free article] [PubMed] [Google Scholar]
- [2].Miller KM, Foster NC, Beck RW, Bergenstal RM, DuBose SN, DiMeglio LA, et al. Current state of type 1 diabetes treatment in the U.S.: updated data from the T1D Exchange clinic registry. Diabetes Care 2015;38:971–8. doi: 10.2337/dcl5-0078. [DOI] [PubMed] [Google Scholar]
- [3].Weinstock RS, Schutz-Fuhrmann I, Connor CG, Hermann JM, Maahs DM, Schiitt M, et al. Type 1 diabetes in older adults: Comparing treatments and chronic complications in the United States T1D Exchange and the German/Austrian DPV registries. Diabetes Res Clin Pract 2016;122:28–37. doi: 10.1016/j.diabres.2016.09.024. [DOI] [PubMed] [Google Scholar]
- [4].McKnight JA, Wild SH, Lamb MJE, Cooper MN, Jones TW, Davis EA, et al. Glycaemic control of Type 1 diabetes in clinical practice early in the 21st century: an international comparison. Diabet Med 2015;32:1036–50. doi: 10.1111/dme.12676. [DOI] [PubMed] [Google Scholar]
- [5].Bohn B, Herbst A, Pfeifer M, Krakow D, Zimny S, Kopp F, et al. Impact of Physical Activity on Glycemic Control and Prevalence of Cardiovascular Risk Factors in Adults With Type 1 Diabetes: A Cross-sectional Multicenter Study of 18,028 Patients. Diabetes Care 2015;38:1536–43. doi: 10.2337/dcl50030. [DOI] [PubMed] [Google Scholar]
- [6].Conway B, Miller RG, Costacou T, Fried L, Kelsey S, Evans RW, et al. Temporal patterns in overweight and obesity in Type 1 diabetes. Diabet Med 2010;27:398–404. doi: 10.1111/j.1464-5491.2010.02956.x. [DOI] [PMC free article] [PubMed] [Google Scholar]
- [7].Colberg SR, Sigal RJ, Yardley JE, Riddell MC, Dunstan DW, Dempsey PC, et al. Physical Activity/Exercise and Diabetes: A Position Statement of the American Diabetes Association. Diabetes Care 2016;39:2065–79. doi: 10.2337/dcl6-1728. [DOI] [PMC free article] [PubMed] [Google Scholar]
- [8].Quirk H, Blake H, Tennyson R, Randell TL, Glazebrook C. Physical activity interventions in children and young people with Type 1 diabetes mellitus: a systematic review with meta-analysis. Diabet Med 2014;31:1163–73. doi: 10.1111/dme.12531. [DOI] [PMC free article] [PubMed] [Google Scholar]
- [9].Miller RG, Mahajan HD, Costacou T, Sekikawa A, Anderson SJ, Orchard TJ. A Contemporary Estimate of Total Mortality and Cardiovascular Disease Risk in Young Adults With Type 1 Diabetes: The Pittsburgh Epidemiology of Diabetes Complications Study. Diabetes Care 2016;39:2296–303. doi: 10.2337/dcl6-1162. [DOI] [PMC free article] [PubMed] [Google Scholar]
- [10].Katz M, Giani E, Laffel L. Challenges and Opportunities in the Management of Cardiovascular Risk Factors in Youth With Type 1 Diabetes: Lifestyle and Beyond. Curr Diab Rep 2015; 15:119. doi: 10.1007/s11892-015-0692-4. [DOI] [PMC free article] [PubMed] [Google Scholar]
- [11].Kennedy A, Nirantharakumar K, Chimen M, Pang TT, Hemming K, Andrews RC, et al. Does exercise improve glycaemic control in type 1 diabetes? A systematic review and meta-analysis. PLoS One 2013;8:e58861. doi: 10.1371/journal.pone.0058861. [DOI] [PMC free article] [PubMed] [Google Scholar]
- [12].Chimen M, Kennedy A, Nirantharakumar K, Pang TT, Andrews R, Narendran P. What are the health benefits of physical activity in type 1 diabetes mellitus? A literature review. Diabetologia 2012;55:542–51. doi: 10.1007/s00125-011-2403-2. [DOI] [PubMed] [Google Scholar]
- [13].Zoppini G, Carlini M, Muggeo M. Self-reported exercise and quality of life in young type 1 diabetic subjects. Diabetes Nutr Metab 2003;16:77–80. [PubMed] [Google Scholar]
- [14].Riddell MC, Gallen IW, Smart CE, Taplin CE, Adolfsson P, Lumb AN, et al. Exercise management in type 1 diabetes: a consensus statement. Lancet Diabetes Endocrinol 2017;5:377–90. doi: 10.1016/S22138587(17)30014-1. [DOI] [PubMed] [Google Scholar]
- [15].Umpierre D, Ribeiro PAB, Kramer CK, Leitao CB, Zucatti ATN, Azevedo MJ, et al. Physical activity advice only or structured exercise training and association with HbAlc levels in type 2 diabetes: a systematic review and meta-analysis. JAMA 2011;305:1790–9. doi: 10.1001/jama.2011.576. [DOI] [PubMed] [Google Scholar]
- [16].Sigal RJ, Kenny GP, Boule NG, Wells GA, Prud’homme D, Fortier M, et al. Effects of aerobic training, resistance training, or both on glycemic control in type 2 diabetes: a randomized trial. Ann Intern Med 2007;147:357–69. [DOI] [PubMed] [Google Scholar]
- [17].Yardley JE, Hay J, Abou-Setta AM, Marks SD, McGavock J. A systematic review and meta-analysis of exercise interventions in adults with type 1 diabetes. Diabetes Res Clin Pract 2014;106:393–400. doi: 10.1016/j.diabres.2014.09.038. [DOI] [PubMed] [Google Scholar]
- [18].Jacobs PG, El Youssef J, Reddy R, Resalat N, Branigan D, Condon J, et al. Randomized trial of a dualhormone artificial pancreas with dosing adjustment during exercise compared with no adjustment and sensor-augmented pump therapy. Diabetes Obes Metab 2016;18:1110–9. doi: 10.1111/dom.12707. [DOI] [PMC free article] [PubMed] [Google Scholar]
- [19].Reddy R, El Youssef J, Winters-Stone K, Branigan D, Leitschuh J, Castle J, et al. The effect of exercise on sleep in adults with type 1 diabetes. Diabetes Obes Metab 2018;20:443–7. doi: 10.1111/dom.13065. [DOI] [PMC free article] [PubMed] [Google Scholar]
- [20].Zaharieva DP, Riddell MC. Insulin Management Strategies for Exercise in Diabetes. Can J Diabetes 2017;41:507–16. doi: 10.1016/j.jcjd.2017.07.004. [DOI] [PubMed] [Google Scholar]
- [21].Francescato MP, Stel G, Stenner E, Geat M. Prolonged exercise in type 1 diabetes: performance of a customizable algorithm to estimate the carbohydrate supplements to minimize glycemic imbalances. PLoS One 2015;10:e0125220. doi: 10.1371/joumal.pone.0125220. [DOI] [PMC free article] [PubMed] [Google Scholar]
- [22].Ryninks K, Sutton E, Thomas E, Jago R, Shield JPH, Burren CP. Attitudes to Exercise and Diabetes in Young People with Type 1 Diabetes Mellitus: A Qualitative Analysis. PLoS One 2015;10:e0137562. doi: 10.1371/journal.pone.0137562. [DOI] [PMC free article] [PubMed] [Google Scholar]
- [23].Yardley JE, Kenny GP, Perkins BA, Riddell MC, Malcolm J, Boulay P, et al. Effects of performing resistance exercise before versus after aerobic exercise on glycemia in type 1 diabetes. Diabetes Care 2012;35:669–75. doi: 10.2337/dcl1-1844. [DOI] [PMC free article] [PubMed] [Google Scholar]
- [24].Yardley JE, Kenny GP, Perkins BA, Riddell MC, Balaa N, Malcolm J, et al. Resistance versus aerobic exercise: acute effects on glycemia in type 1 diabetes. Diabetes Care 2013;36:537–42. doi: 10.2337/dcl20963. [DOI] [PMC free article] [PubMed] [Google Scholar]
- [25].Iscoe KE, Riddell MC. Continuous moderate-intensity exercise with or without intermittent high-intensity work: effects on acute and late glycaemia in athletes with Type 1 diabetes mellitus. Diabet Med 2011;28:824–32. doi: 10.1111/j.1464-5491.2011.03274.x. [DOI] [PubMed] [Google Scholar]
- [26].Mozaffarian D, Benjamin EJ, Go AS, Arnett DK, Blaha MJ, Cushman M, et al. Heart disease and stroke statistics—2015 update: a report from the American Heart Association. Circulation 2015;131:e29–322. doi: 10.1161/CIR.0000000000000152. [DOI] [PubMed] [Google Scholar]
- [27].American College of Sports Medicine. ACSM’s Guidelines for Exercise Testing and Prescription. Lippincott Williams & Wilkins; 2013. [DOI] [PubMed] [Google Scholar]
- [28].Hafif GG, Triplett NT. Essentials of Strength Training and Conditioning 4th Edition Human Kinetics; 2015. [Google Scholar]
- [29].Harris PA, Taylor R, Thielke R, Payne J, Gonzalez N, Conde JG. Research electronic data capture (REDCap)—a metadata-driven methodology and workflow process for providing translational research informatics support. J Biomed Inform 2009;42:377–81. doi: 10.1016/j.jbi.2008.08.010. [DOI] [PMC free article] [PubMed] [Google Scholar]
- [30].di Prampero PE, Ferretti G. The energetics of anaerobic muscle metabolism: a reappraisal of older and recent concepts. Respir Physiol 1999;118:103–15. [DOI] [PubMed] [Google Scholar]
- [31].Vianna JM, Wemeck FZ, Coelho EF, Damasceno VO, Reis VM. Oxygen uptake and heart rate kinetics after different types of resistance exercise. J Hum Kinet 2014;42:235–44. doi: 10.2478/hukin-2014-0077. [DOI] [PMC free article] [PubMed] [Google Scholar]
- [32].Reis VM, Scott CB. Modeling the Total Energy Costs of Resistance Exercise: a Work in Progress. Central European Journal of Sport Sciences and Medicine 2016;14:5–12. doi: 10.18276/cej.2016.2-01. [DOI] [Google Scholar]
- [33].Vezina JW, Der Ananian CA, Campbell KD, Meckes N, Ainsworth BE. An examination of the differences between two methods of estimating energy expenditure in resistance training activities. J Strength Cond Res 2014;28:1026–31. doi: 10.1519/JSC.0000000000000375. [DOI] [PubMed] [Google Scholar]
- [34].Ahuja JKC, Moshfegh AJ, Holden JM, Harris E. USDA food and nutrient databases provide the infrastructure for food and nutrition research, policy, and practice. J Nutr 2013;143:241S–9S. doi: 10.3945/jn.112.170043. [DOI] [PubMed] [Google Scholar]
- [35].R Core Team. R: A Language and Environment for Statistical Computing 2017. [Google Scholar]
- [36].Ostman C, Jewiss D, King N, Smart NA. Clinical outcomes to exercise training in type 1 diabetes: A systematic review and meta-analysis. Diabetes Res Clin Pract 2017. doi: 10.1016/j.diabres.2017.11.036. [DOI] [PubMed] [Google Scholar]
- [37].Durak EP, Jovanovic-Peterson L, Peterson CM. Randomized crossover study of effect of resistance training on glycemic control, muscular strength, and cholesterol in type I diabetic men. Diabetes Care 1990;13:1039–43. doi: 10.2337/diacare.13.10.1039. [DOI] [PubMed] [Google Scholar]
- [38].Mosher PE, Nash MS, Perry AC, LaPerriere AR, Goldberg RB. Aerobic circuit exercise training: effect on adolescents with well-controlled insulin-dependent diabetes mellitus. Arch Phys Med Rehabil 1998;79:652–7. [DOI] [PubMed] [Google Scholar]
- [39].Ramalho AC, de Lourdes Lima M, Nunes F, Cambui Z, Barbosa C, Andrade A, et al. The effect of resistance versus aerobic training on metabolic control in patients with type-1 diabetes mellitus. Diabetes Res Clin Pract 2006;72:271–6. doi: 10.1016/j.diabres.2005.11.011. [DOI] [PubMed] [Google Scholar]
- [40].Rissanen A- PE, Tikkanen HO, Koponen AS, Aho JM, Peltonen JE. One-year unsupervised individualized exercise training intervention enhances cardiorespiratory fitness but not muscle deoxygenation or glycemic control in adults with type 1 diabetes. Appl Physiol Nutr Metab 2018;43:387–96. doi: 10.1139/apnm-2017-0222. [DOI] [PubMed] [Google Scholar]
- [41].Wright LA- C, Hirsch IB. Metrics Beyond Hemoglobin A1C in Diabetes Management: Time in Range, Hypoglycemia, and Other Parameters. Diabetes Technol Ther 2017;19:S16–26. doi: 10.1089/dia.2017.0029. [DOI] [PMC free article] [PubMed] [Google Scholar]
- [42].Agiostratidou G, Anhalt H, Ball D, Blonde L, Gourgari E, Harriman KN, et al. Standardizing Clinically Meaningful Outcome Measures Beyond HbAlc for Type 1 Diabetes: A Consensus Report of the American Association of Clinical Endocrinologists, the American Association of Diabetes Educators, the American Diabetes Association, the Endocrine Society, JDRF International, The Leona M. and Harry B. Helmsley Charitable Trust, the Pediatric Endocrine Society, and the T1D Exchange. Diabetes Care 2017;40:1622–30. doi: 10.2337/dcl7-1624. [DOI] [PMC free article] [PubMed] [Google Scholar]
- [43].Pesta DH, Goncalves RLS, Madiraju AK, Strasser B, Sparks LM. Resistance training to improve type 2 diabetes: working toward a prescription for the future. Nutr Metab 2017;14:24. doi: 10.1186/s12986-0170173-7. [DOI] [PMC free article] [PubMed] [Google Scholar]
- [44].Mann S, Beedie C, Balducci S, Zanuso S, Allgrove J, Bertiato F, et al. Changes in insulin sensitivity in response to different modalities of exercise: a review of the evidence. Diabetes Metab Res Rev 2014;30:257–68. doi: 10.1002/dmrr.2488. [DOI] [PubMed] [Google Scholar]
- [45].Egan B, Zierath JR. Exercise metabolism and the molecular regulation of skeletal muscle adaptation. Cell Metab 2013;17:162–84. doi: 10.1016/j.cmet.2012.12.012. [DOI] [PubMed] [Google Scholar]
Associated Data
This section collects any data citations, data availability statements, or supplementary materials included in this article.