Abstract
Abnormal expression of microRNAs (miRNAs) contributes to glioma initiation. However, the expression of miRNAs in tumour tissue or blood of spinal cord glioma (SCG) patients, particularly in high-grade spinal gliomas (Grade IV) known as glioblastoma (GBM), remains largely unknown. In this study we aimed to determine differentially expressed miRNAs (DEmiRNAs) in the tissue and blood between spinal cord glioblastoma (SC-GBM) patients and low grade SCG (L-SCG) patients. Additionally, we predicted key miRNA targets and pathways that may be critical in glioma development using pathway and gene ontology analysis. A total of 74 miRNAs were determined to be differentially expressed (25 upregulated and 49 downregulated) in blood, while 207 miRNAs (20 up-regulated and 187 down-regulated) were identified in tissue samples. Gene ontology analysis revealed multicellular organism development and positive regulation of macromolecule metabolic process to be primarily involved. Pathway analysis revealed “Glioma”, “Signalling pathways regulating pluripotency of stem cells” to be the most relevant pathways. miRNA-mRNA analysis revealed that hsa-miRNA3196, hsa-miR-27a-3p, and hsa-miR-3664-3p and their target genes are involved in cancer progression. Our study provides a molecular basis for SCG pathological grading based on differential miRNA expression.
Subject terms: Cancer genomics, Prognostic markers, Tumour biomarkers
Introduction
Glioma is one of the most common and aggressive primary malignant tumours, whether in the spinal cord or in the brain, of which Spinal cord gliomas (SCG) account for more than 80% of spinal cord tumours1. Spinal cord glioma is difficult to be totally resected; postoperative radiotherapy and chemotherapy are both uncertain; comprehensive treatment is a clinical problem2. Even after surgical resection of these spinal cord gliomas, low grade spinal cord gliomas (WHO I and II) with a poor response to postoperative radiotherapy and chemotherapy, commonly reappeared after several months or several years. Given the highly variable and evolving nature of SCG, it is necessary to identify novel biomarkers that are specific for SCG and would help to improve the prediction of SCG3.
MicroRNAs (miRNAs) are small non-coding RNA molecules that bind to the 3′ untranslated region of a target mRNA4. miRNAs can either act as tumour suppressors or as oncogenes depending on their target gene5–7. By regulating the expression of the target genes, miRNAs play important roles in the development of cancers8. In addition, studies have shown that a single miRNA can affect the expression of multiple target genes9,10. miRNAs can be used as tumour biomarkers for prediction, diagnosis and prognosis11. For example, dysregulated miRNAs play an important role in the development and progression of gliomas12,13. However, the expression patterns and mechanisms of miRNAs in the SCG remain largely unknown.
Therefore, comprehensive analysis of the differentially expressed profiles of miRNAs and mRNAs in tumour tissue and circulating blood of patients with low or high grade SCG will help reveal the role of differential expression miRNAs and their target genes involved in SCG, and contribute to the elucidation of the pathogenesis of SCG and further benefit the diagnosis and staging treatment of patients.
Results
Spinal cord gliomas (SCG) Patients characteristic
We selected 10 patients with SCG who went through surgical treatment without preoperative chemotherapy or radiotherapy. According to WHO (2016) on the classification of neurological tumours14 and pathological section analysis of patient tumor tissue, the tissues and blood of 10 SCG patients were divided into high-grade (WHO IV) and low-grade (WHO II and WHO I), respectively. All the available clinical and follow-up data are included in Table 1 and Fig. 1.
Table 1.
Clinical features of SC-GBM and L-SCG patients.
| Patient ID | Age | Gender | Tumor pathology classification | Tumor grade | Tumor location | survival months |
|---|---|---|---|---|---|---|
| 25343 | 28 | Female | Glioblastoma | IV | T10-L1 | Paraplegia* |
| 26600 | 15 | male | Glioblastoma | IV | C5-7 | 5 |
| 260002 | 37 | male | Glioblastoma | IV | T1-5 | 3 |
| 28553 | 14 | Female | Glioblastoma | IV | T1-8 | Relapsed* |
| 28378 | 11 | male | Glioblastoma | IV | T9-12 | Relapsed* |
| 26051 | 48 | male | Astrocytoma | II | C1-3 | * |
| 506353 | 27 | Female | Astrocytoma | II | T5-7 | >6 |
| 511691 | 45 | Female | Astrocytoma | II | C6-T1 | >8 |
| 27110 | 17 | male | Pilocytic astrocytoma | I | T1-2 | >12 |
| 503550 | 13 | male | Pilocytic astrocytoma | I | T1-4 | >15 |
SC-GBM = spinal cord glioblastoma, L-SCG = Low-grad Spinal cord gliomas, Patient ID = patient identification number, C = Cervical, L = Lumbar, T = Thoracic. *losing contact.
Figure 1.
HE staining of tissue of patients with different grades of SCG. I The bipolar cells are partially arranged around the blood vessels and the Rosenthal’s fibers are visible. II Tumor cells are heteromorphic with deep nuclear staining, and tumor cell density is moderately low. IV The nuclear division of the cell is active, with obvious microvascular proliferation and obvious cell atypia.
DEmiRNAs (Differentially expressed miRNAs) in blood and tissue between SC-GBM and L-SCG
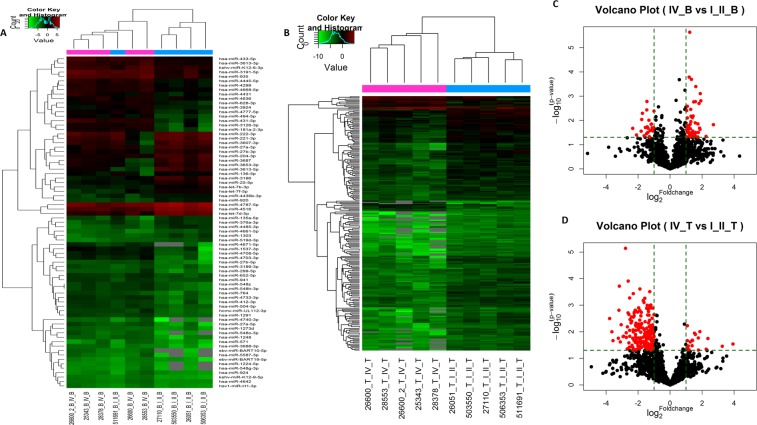
A total of 74 miRNAs were identified as DEmiRNAs between SC-GBM and low-grade spinal cord glioma (L-SCG) patient peripheral blood cells. Compared to the low-grade group, there were 49 up-regulated and 25 down-regulated miRNAs in the SC-GBM group (P < 0.05, fold change >2). Simultaneously, 207 DEmiRNAs were detected between SC-GBM and L-SCG patient tissue, of which 20 were upregulated and 187 were downregulated in SC-GBM group (P < 0.05, fold change >2). The microarray results clearly revealed the number of DEmiRNAs in tissue samples to be significantly higher than that in blood samples. Here, we list the first 10 differentially expressed (either upregulated or downregulated) miRNAs, respectively (Tables 2–5). A hierarchical clustering analysis and volcano plot were used for visualizing DEmiRNAs between the two groups based on their expression levels between samples. As shown in Fig. 2, these miRNAs displayed a general difference between SC-GBM and L-SCG patients.
Table 3.
The top 20 down-regulated miRNAs in blood between SC-GBM and L-SCG.
| Name | Fold change | P-value |
|---|---|---|
| hsa-miR-3196 | 0.198090894 | 0.021246601 |
| hsa-miR-3613-5p | 0.234047001 | 0.039956559 |
| hsa-let-7d-5p | 0.285012754 | 0.027815875 |
| hsa-miR-4485-3p | 0.293230214 | 0.009221795 |
| hsa-miR-221-3p | 0.302537514 | 0.005134891 |
| hsa-miR-3687 | 0.324575439 | 0.043570637 |
| hsa-miR-4516 | 0.342281362 | 0.01976555 |
| hsa-miR-3653-3p | 0.360303476 | 0.035669733 |
| hsa-miR-376a-3p | 0.364991188 | 0.00372444 |
| hsa-miR-920 | 0.365749338 | 0.001653505 |
| hsa-miR-1303 | 0.371727406 | 0.019028421 |
| hsa-miR-3607-3p | 0.371804803 | 0.018395651 |
| hsa-miR-25-5p | 0.381840394 | 0.02072343 |
| hsa-let-7f-5p | 0.382337557 | 0.030940673 |
| hsa-miR-135a-5p | 0.39990696 | 0.009806781 |
| hsa-miR-204-3p | 0.40780491 | 0.0470677 |
| hsa-miR-4787-5p | 0.415170289 | 0.048932902 |
| hsa-miR-27a-3p | 0.422492902 | 0.026147403 |
| hsa-let-7b-3p | 0.440087254 | 0.014552425 |
| hsa-miR-222-3p | 0.444593232 | 0.026170249 |
Table 4.
Up-regulated miRNAs in tissues between SC-GBM and L-SCG.
| Name | Fold change | P-value |
|---|---|---|
| hsa-miR-196b-5p | 15.24663025 | 0.028931546 |
| hsa-miR-301b-3p | 9.562320427 | 0.034866815 |
| hsa-miRPlus-A1083 | 5.134128878 | 0.017853778 |
| hsa-miR-542-5p | 4.78668274 | 0.045083866 |
| hsa-miR-99a-5p | 3.621954438 | 0.009847628 |
| hsv2-miR-H10 | 3.412037878 | 0.048603892 |
| hsa-miR-1469 | 3.397564668 | 0.017093603 |
| hsa-miR-25-3p | 2.985610133 | 0.012606392 |
| hsa-miR-3940-5p | 2.87457823 | 0.011321879 |
| hsa-miR-1273f | 2.642233043 | 0.021242596 |
| hsa-miR-148a-3p | 2.617968064 | 0.020746879 |
| hsa-miR-199b-5p | 2.597233508 | 0.033250216 |
| hsa-miR-3195 | 2.401192179 | 0.024099904 |
| hsa-miR-4708-3p | 2.265626477 | 0.047564702 |
| hsa-let-7c-5p | 2.203631519 | 0.034172973 |
| hsa-miR-92a-3p | 2.18672811 | 0.033922439 |
| hsa-miR-320b | 2.12743175 | 0.041105671 |
| hsa-miR-1268b | 2.112420964 | 0.005909261 |
| hsa-miR-4787-3p | 2.109458023 | 0.021351637 |
| hsa-miR-4739 | 2.069906337 | 0.04422456 |
Table 2.
The top 20 up-regulated miRNAs in blood between SC-GBM and L-SCG.
| Name | Fold change | P-value |
|---|---|---|
| hsa-miR-4740-3p | 6.525656392 | 0.015113332 |
| hsa-miR-5587-3p | 4.736648534 | 0.045813524 |
| hsa-miR-27a-5p | 3.782315977 | 0.001552331 |
| hsa-miR-3688-3p | 3.68823972 | 0.00078339 |
| hsa-miR-4703-3p | 3.65325004 | 0.023568124 |
| hsa-miR-431-5p | 3.581687066 | 0.02074083 |
| hsa-miR-3126-3p | 3.508016612 | 0.00199045 |
| hsa-miR-571 | 3.394631406 | 0.031366111 |
| hsa-miR-181a-2-3p | 3.335763967 | 0.013981023 |
| ebv-miR-BART10-5p | 3.311469302 | 0.048013163 |
| hsa-miR-548o-3p | 3.247652077 | 0.04832375 |
| kshv-miR-K12-9-5p | 3.036833321 | 0.000402608 |
| hsa-miR-4671-5p | 3.008413118 | 0.031651186 |
| hsa-miR-4431 | 3.00071241 | 0.032710473 |
| hsa-miR-4733-3p | 2.992158897 | 0.001673458 |
| hsa-miR-4708-5p | 2.963448331 | 0.01269584 |
| hsa-miR-299-5p | 2.936149543 | 0.042478936 |
| hsa-miR-412-3p | 2.779311988 | 0.001726679 |
| hsa-miR-1537-3p | 2.767530197 | 0.033309459 |
| ebv-miR-BART19-5p | 2.709788765 | 0.006542985 |
Table 5.
The top 20 down-regulated miRNAs in tissues between SC-GBM and L-SCG.
| Name | Fold change | P-value |
|---|---|---|
| hsa-miR-302f | 0.072919762 | 0.003163643 |
| hsa-miR-4752 | 0.080358253 | 0.009939258 |
| hsa-miR-196b-3p | 0.084478269 | 0.021473288 |
| hsa-miR-520g-3p | 0.106302596 | 0.017467378 |
| hsa-miR-212-5p | 0.10874807 | 0.001550933 |
| hsa-miR-4680-3p | 0.111068791 | 0.00019238 |
| hsa-miR-4724-3p | 0.115814196 | 0.023906092 |
| hsa-miR-658 | 0.119940191 | 0.005442459 |
| hsa-miR-4477b | 0.130600471 | 0.015040548 |
| hsa-miR-1279 | 0.133656385 | 0.014645975 |
| hsa-miR-4490 | 0.14550809 | 7.26109E-06 |
| hsa-miR-4477a | 0.149854027 | 0.010815332 |
| hsa-miR-3144-5p | 0.15021497 | 0.01620099 |
| hsa-miR-5009-3p | 0.156463316 | 0.043853059 |
| hsa-miR-5009-5p | 0.157194486 | 0.006468425 |
| hsa-miR-3145-3p | 0.161776923 | 0.001953459 |
| hsa-miR-325 | 0.162684967 | 0.000123545 |
| hsa-miR-506-3p | 0.167906835 | 0.026082657 |
| hsa-miR-3119 | 0.167976858 | 0.002214012 |
| hsa-miR-3664-3p | 0.171376881 | 0.038077497 |
Figure 2.
Differential expression of miRNAs in tissues and arterial blood between SC-GBM and L-SCG. Hierarchical clustering analysis the DEmiRNAs between SC-GBM and L-SCG blood (A) tissues (C) (fold change >2; P < 0.05; N = 5). Volcano plots. The vertical lines correspond to 2.0-fold up- and down-regulation between SC-GBM and L-SCG blood (B) and tissues (D), and the horizontal line represents a P-value. The red point represents the DEmiRNAs with statistical significance.
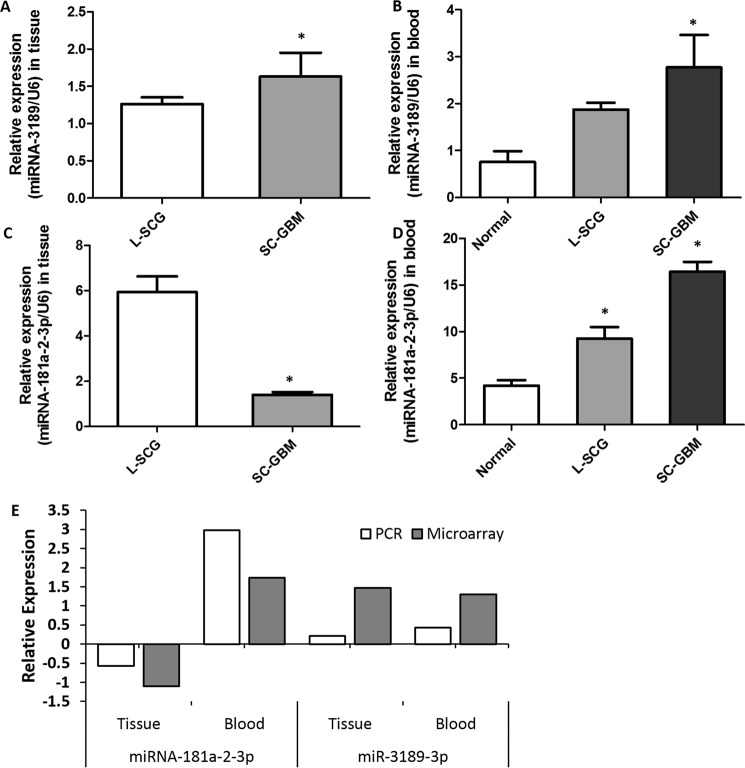
To validate the results of the microarray, we randomly selected two differentially expressed miRNAs for qRT-PCR, miR-3189-3p were up-regulated both in tissue and blood in SC-GBM, and miR-181a-2-3p was down-regulated in tissue while being up-regulated in blood. The results of qRT-PCR were consistent with the microarray data and difference in RNA expression was statistically significant (P < 0.05) (Fig. 3). All data for the DEmiRNAs are provided in Supplementary Data 1.
Figure 3.
Validation of microarray data by qRT-PCR. Comparison of miR-181a-2-3p qRT-PCR data between groups in tissue (A) and blood (B). Comparison of miR-3189-3p qRT-PCR data between groups in tissue (C) and blood (D). (E) Comparison of the results of qRT-PCR and microarray for miR-181a-2-3p and miR-3189-3p. Results obtained with these two methods were consistent with each other. *P < 0.05 vs. L-SCG or Normal, n = 6.
Prognostic indicators for disease relapse
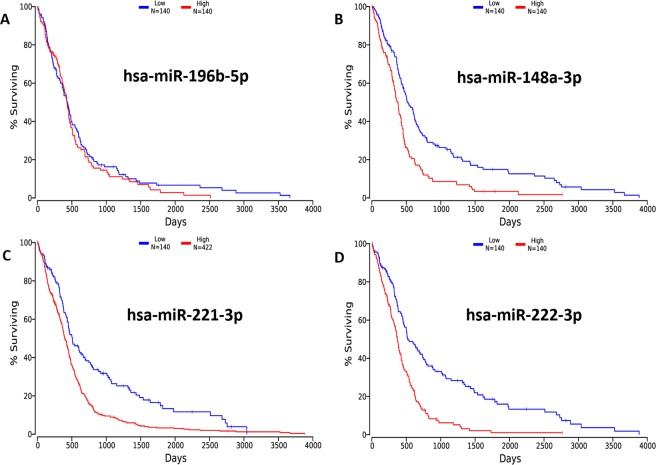
To further investigate the role of the miRNA profile, we evaluated the GBM-related data available in the TCGA database using OncoLnc. Four differentially expressed DEmiRNAs (has-miR-196b-5p, has-miR-148a-3p, has-miR-221-3p, and has-miR-222-3p) in our study were identified in the TCGA database. We then performed an analysis to determine whether these four dysfunctional miRNAs are associated with cancer recurrence. We used the OncoLnc tool to link TCGA survival data to miRNAs. All patients included in the study were diagnosed with GBM. We observed that patients with lower expression of has-miR-196b-5p had longer survival (Fig. 4A), which confirmed our above microarray results that has-miR-196b-5p has a higher expression in high-grade glioma patients compared to patients with low-grade gliomas. Similarly, our microarray results revealed that has-miR-148a-3p was up-regulated in the high-level group compared to the low-level group, which was consistent to the survival analysis results that patients with low expression of has-miR-148a-3p had a longer lifespan (Fig. 4B). In addition, similar results were observed upon independent validation of has-miR-221-3p and has-miR-222-3p levels (Fig. 4C,D). These data further demonstrate differential expression of has-miR-196b-5p, has-miR-148a-3p, and has-miR-221-3p, and their expression pattern may be prognostic biomarkers for GBM patients.
Figure 4.
A Kaplan–Meier curve estimates the association of miRNAs and the survival of patients with GBM. (A) Association between the expression of has-miR-196b-5p and survival days in GBM patient tissue samples. (B) Association between the expression of has-miR-148a-3p and survival days in GBM patient tissue samples. (C) Association between the expression of has-miR-221-3p and survival days in GBM patient blood samples. (D) Association between the expression of has-miR-222-3p and survival days in both GBM patient blood and tissue samples.
DEmiRNAs target prediction in SCG blood and tissue samples
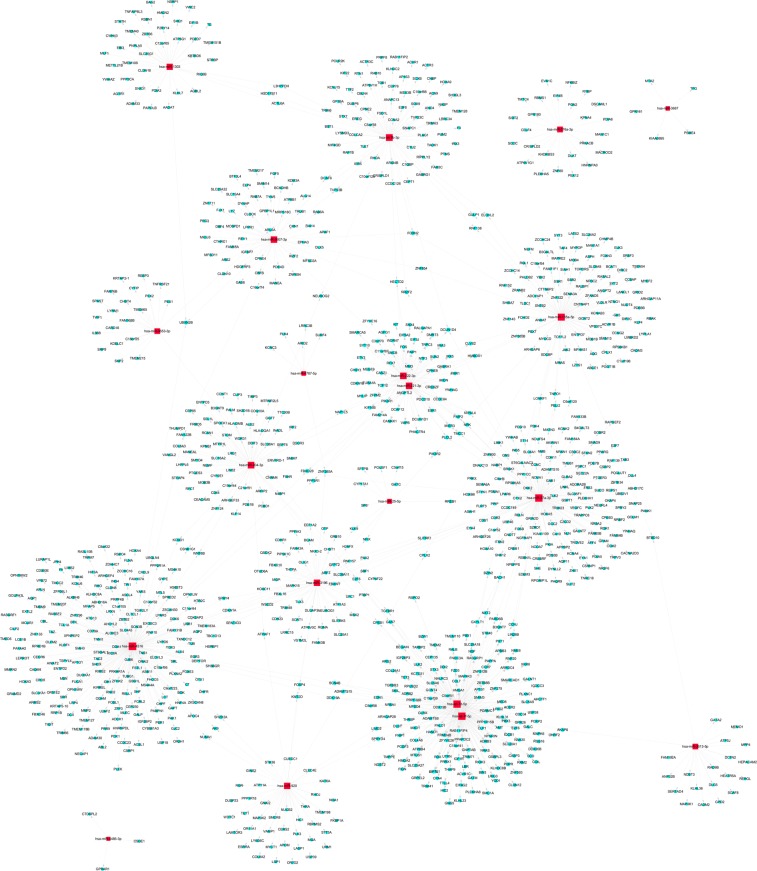
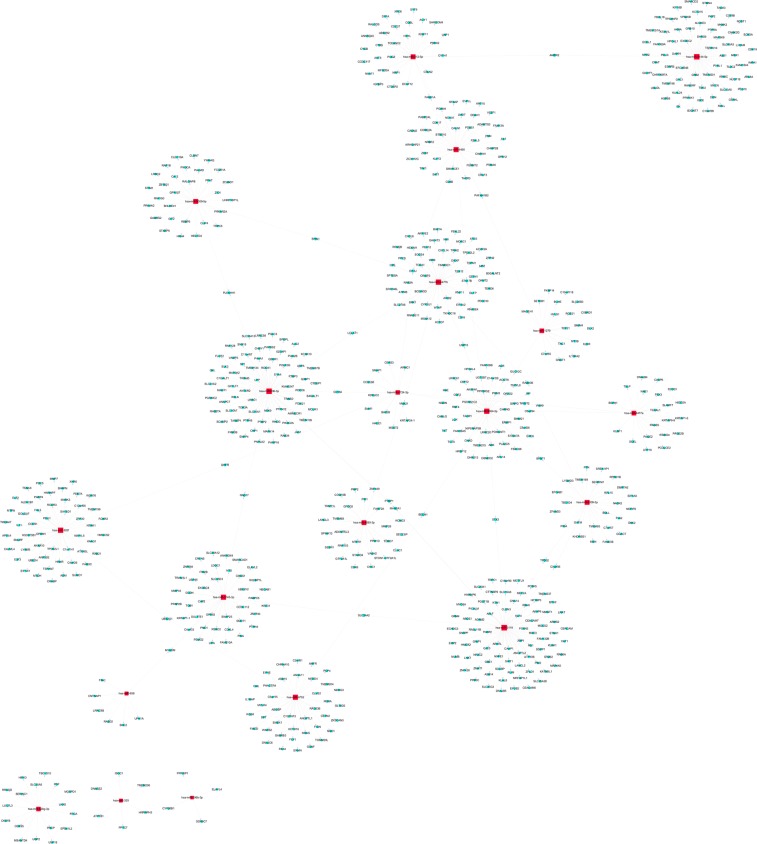
In order to explore the potential regulatory effect of DEmiRNA on mRNAs, we also predicted target genes for DEmiRNAs. We selected the top 20 miRNAs to predict their target genes based on the fold change value of DEmiRNAs. By software-based prediction, there were 1468 and 728 target genes for upregulated and downregulated miRNAs in the tissue samples, respectively. In addition, 388 and 1378 target genes were found in blood samples of upregulated and downregulated miRNAs. Here we list the network diagram of downregulated miRNAs and their target genes in tissue and blood, respectively (Figs 5 and 6).
Figure 5.
Network of differentially expressed MiRNA-mRNA in blood. Red-square nodes and Blue-round nodes are represented down-regulated miRNAs and mRNAs, respectively, and the solid line between the two nodes represents a correlation.
Figure 6.
Network of differentially expressed MiRNA-mRNA in tissue. Red-square nodes and Blue-round nodes are represented down-regulated miRNAs and mRNAs, respectively, and the solid line between the two nodes represents a correlation.
GO analysis DEmiRNAs in SCG blood and tissue samples
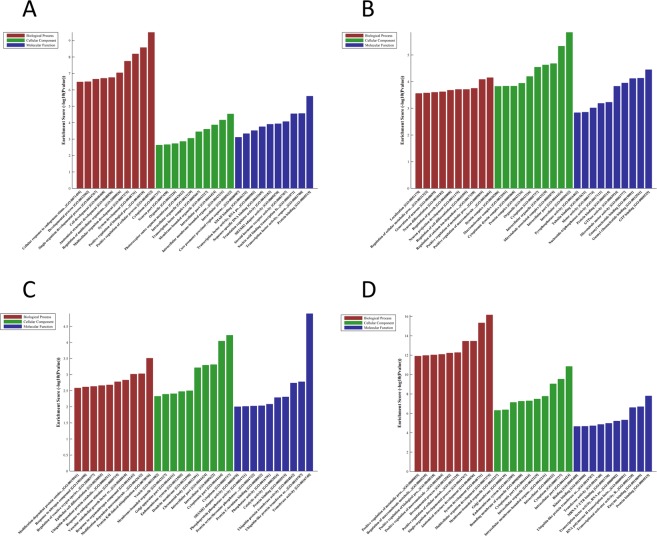
We used the gene function analysis website (http://www.geneontology.org) to perform the Biological Process (BP), Molecular Function (MF), and Cellular Component (CC) analysis of DEmiRNAs with those are upregulated and downregulated in the SCG tissues and blood (Fig. 7; Supplementary Data 2). GO enrichment analysis in blood sample showed that up-regulated miRNA was enriched in 482 BP, 91 CC and 79 MF, while down-regulated mRNA was enriched in 813 BP, 59 CC and 109 MF. The most highly enriched up-regulated GO terms were “positive regulation of macromolecule metabolic process (BP)”, “intracellular (CC)”, and “GTP binding (MF)”, while down-regulated GO terms were most highly enriched in “positive regulation of cellular process (BP)”, “intracellular (CC)”, and “protein binding (MF)”. In the tissue sample, the up-regulated miRNA was enriched in 1239 BP, 162 CC and 164 MF, while down-regulated mRNA was enriched in 197 BP, 61 CC and 50 MF. The most highly enriched up-regulated GO terms were “multicellular organism development (BP)”, “intracellular part (CC)”, and “protein binding (MF)”, while down-regulated GO terms were most highly enriched in “protein K48-linked ubiquitination (BP)”, “cytoplasm (CC)”, and “transferase activity (MF)”. Our results suggest that miRNAs in both blood and tissue samples are associated with cell biological development-related items.
Figure 7.
Top 10 enrichment (−log10 (P value)) of GO terms for DEmiRNAs in blood (A, downregulated and B, upregulated) and tissue (C, downregulated and D, upregulated) from the SC-GBM patients. The abscissa represents the GO term, from left to right in turn for the biological process, cell composition, molecular function, and the ordinate represents the enrichment factor of the gene that is annotated to the term.
Pathway analysis of DEmiRNAs in SCG blood and tissue samples
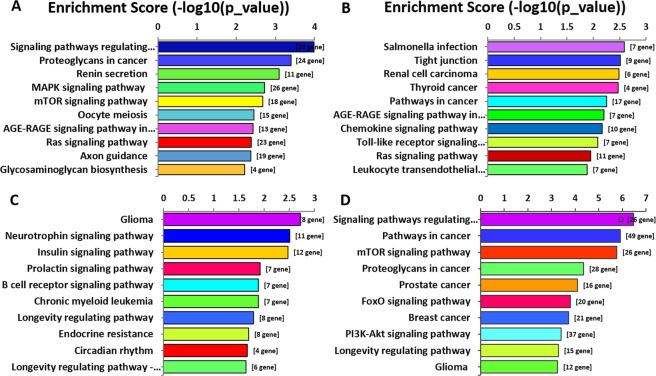
Pathway knowledge can provide disease marker information that is crucial to diagnosis, choice of drug, and patient treatment15. Based on the KEGG (Kyoto Encyclopedia of Genes and Genomes) database, the significance levels of DEgene pathways were analysed in our research (Fig. 8). The results showed that the down-regulated miRNAs in the blood was mainly involved in the “Signalling pathways regulating pluripotency of stem cells” pathway, and the up-regulated genes were mainly involved in the “salmonella infection” pathway. Furthermore, the differential expression genes in the tissue are mainly involved in “Glioma”, “Signalling pathways regulating pluripotency of stem cells” and “Pathways in cancer” pathways. KEGG pathway analysis indicated that miRNAs that are dysregulated in tissue and blood samples through the “Glioma”, “Signalling pathways regulating pluripotency of stem cells” and “Pathways in cancer” pathways, thereby affecting the progression of SCG disease.
Figure 8.
KEGG pathways enrichment analysis of SCG. Top 10 enrichment (−log10 (P value)) of pathways for DEmRNAs in blood (A, down-regulated and B, up-regulated) and tissue (C, down-regulated and D, up-regulated).
The common DEmiRNAs of tissue and blood samples in SC-GBM and L-SCG
In order to study the differences in miRNA expression between SCG tissue and blood, we compared the DEmiRNAs data in SCG tissue and blood and picked out the DEmiRNAs which were not only present in tissues but also in blood. We found that 9 up-regulated and 17 down-regulated miRNAs were simultaneously present in the blood and tissues of SC-GMB patients (Table 6). Interestingly, we also observed three DEmiRNAs, hsa-miR-181a-2-3p, hsa-miR-764 and kshv-miR-K12-6-3p, whose expression in the tissue and blood were entirely opposite, i.e. they were all significantly up-regulated in the blood while being down-regulated in the tissue.
Table 6.
Co-expression of DEmiRNAs between blood and tissue.
| ID | Name | Blood | Tissue | ||
|---|---|---|---|---|---|
| FC | P-value | FC | P-value | ||
| Up-regulated | |||||
| 46258 | hsa-miR-1184 | 2.2546 | 0.0969 | 2.6751 | 0.4408 |
| 42702 | hsa-miR-30c-1-3p | 2.0758 | 0.2024 | 2.3802 | 0.3339 |
| 147731 | hsa-miR-3189-3p | 2.4706 | 0.0068 | 2.7780 | 0.1861 |
| 147679 | hsa-miR-3197 | 2.2278 | 0.2495 | 3.1664 | 0.2333 |
| 169378 | hsa-miR-4430 | 3.7769 | 0.1252 | 2.2844 | 0.2175 |
| 168928 | hsa-miR-4431 | 3.0007 | 0.0327 | 2.4578 | 0.4755 |
| 30493 | hsa-miR-548a-5p | 2.6957 | 0.3233 | 2.6742 | 0.0992 |
| 145933 | hsa-miR-652-5p | 2.0440 | 0.0039 | 3.6343 | 0.2335 |
| 148673 | hsv1-miR-H15 | 4.8409 | 0.2213 | 3.4020 | 0.2077 |
| Down-regulated | |||||
| 42769 | hsa-let-7b-3p | 0.4401 | 0.0146 | 0.2541 | 0.3962 |
| 5250 | hsa-miR-105-5p | 0.3436 | 0.2065 | 0.4136 | 0.0124 |
| 46404 | hsa-miR-1244 | 0.4372 | 0.2428 | 0.2266 | 0.0543 |
| 148227 | hsa-miR-1251-3p | 0.4507 | 0.3436 | 0.3266 | 0.0085 |
| 145972 | hsa-miR-141-5p | 0.3104 | 0.2530 | 0.3995 | 0.0582 |
| 11022 | hsa-miR-221-3p | 0.3025 | 0.0051 | 0.4126 | 0.4049 |
| 11023 | hsa-miR-222-3p | 0.4446 | 0.0262 | 0.2693 | 0.2650 |
| 148215 | hsa-miR-3591-3p | 0.4094 | 0.2951 | 0.2117 | 0.0019 |
| 148430 | hsa-miR-374c-5p | 0.4851 | 0.1413 | 0.1743 | 0.0147 |
| 148499 | hsa-miR-3910 | 0.4852 | 0.4121 | 0.2893 | 0.0931 |
| 169072 | hsa-miR-3925-3p | 0.3670 | 0.2833 | 0.3706 | 0.1074 |
| 169247 | hsa-miR-4477a | 0.4285 | 0.3173 | 0.1499 | 0.0108 |
| 168801 | hsa-miR-4477b | 0.4105 | 0.3063 | 0.1306 | 0.0150 |
| 169109 | hsa-miR-5003-5p | 0.4194 | 0.4575 | 0.2731 | 0.0197 |
| 42959 | hsa-miR-514a-3p | 0.3896 | 0.4511 | 0.3190 | 0.0154 |
| 17612 | hsa-miR-555 | 0.4927 | 0.3098 | 0.3010 | 0.3019 |
| 168669 | hsa-miR-5693 | 0.3598 | 0.2693 | 0.2233 | 0.0507 |
Discussion
MiRNAs are involved in a variety of tumour development, including liver cancer, lung cancer, breast cancer, brain tumours and colon cancer16,17. Meanwhile, the dysregulated miRNAs also play a vital function in the occurrence and development of gliomas18. Some miRNAs are known to promote brain gliomas formation and progression by regulating the definition of cellular metabolism, invasion, and angiogenesis in glioma19. Their small size, stability, and targeting ability of various oncogenes have simultaneously identified miRNAs as candidates for biomarkers of brain gliomas. Several clinical studies have shown that surgical resection of SCG has far less effect than that of brain gliomas20. As a glioma of the central nervous system (CNS), SCG may also present a unique dysregulation pattern of miRNAs21. The disclosure of miRNA properties of SCG may also be beneficial to the diagnosis, prognosis and treatment of the tumour patients.
The expression of miRNAs in blood and tissues have tumour-related and tissue-specific features, and their expression is remarkably stable22. In order to get a more comprehensive data of miRNAs in SCG patients, we studied the expression profiles of miRNAs both in tissues and blood of SCG patients with different pathological grades using miRNA microarray. A total of 49 up-regulated miRNAs and 25 down-regulated miRNAs were identified in peripheral blood. At the same time, 20 up-regulated and 187 down-regulated miRNAs were observed in the spinal cord glioblastoma (SC-GBM) tissues compared to L-SCG (P < 0.05, FC > 2). A greater number of miRNAs were up-regulated in the SC-GBM group in blood samples, whereas in tissue sample, a greater proportion of miRNAs were down-regulated. We found that 9 up-regulated and 17 down-regulated miRNAs were consistently present in the blood and tissues of SC-GMB patients. Furthermore, we noticed that there are a few differentially expressed miRNAs (DEmiRNAs) whose expression levels starkly contrasted between tissue and blood samples. We speculate that this result may be due to the distinct functions of miRNAs present in spinal cord glioma tissues and blood. For example, three kinds of DEmiRNAs, hsa-miR-181a-2-3p, hsa-miR-764, and kshv-miR-K12-6-3p, which were up-regulated in blood but down-regulated in tissues. Previous research has approved that hsa-miR-764 is a biomarker for the diagnosis of hepatocellular carcinoma and lung adenocarcinoma23,24. This interesting result suggests us to further consider and inquire into the exact mechanism of hsa-miR-764 in the onset and progression of of SCG. In addition, overexpression of miR-K12-6-3p contributes to the spread of malignant tumours and angiogenesis and requires to deeper investigation25. Subsequently, we verified the differentially expressed miRNA-181a-2-3p and miRNA-3189-3p by RT-PCR and the results were consistent with the miRNA microarray, indicating that the consequence was reliable.
A previously reported study suggested miR-3196 to be a target of the tumour suppressor protein H2AX, and that the combination of its promoter and phosphorylated H2AX (γH2AX) can promote cancer cell apoptosis26. In SC-GBM blood samples, the expression of hsa-miR-3196 is significantly decreased, which suggested that it may act as a key factor in the development of SCG. At the same time, hsa-miR-4740-3p was remarkably upregulated in SC-GBM blood (FD = 6.53; P = 0.015). The function of hsa-miR-4740-3p is not known yet. However, the high expression in SC-GBM blood samples warrants further attention. Additionally, another down-regulated miRNA in the blood, hsa-miR-27a-3p, (FD = 0.42; P = 0.026), has been reported to serve as a prognostic and therapeutic target for GBM in the brain and its expression level can be used to identify grade II, III, and IV astrocytomas27. Therefore, we can also explore whether hsa-miR-27a-3p can be used as a target of SCG grading in various grades of SCG in the future studies.
B-cell translocation gene 2 (BTG2) is a direct functional target of miR-27a-3p in gastric cancer. Inhibition of miR-27a-3p significantly up-regulates BTG2 expression28. In order to further elucidate the mechanism and characteristics of DEmiRNAs in SCG, we constructed the miRNA-mRNA network. Interestingly, we observed that BTG2 is not only target the expression of hsa-miR-27a-3p in the blood but also regulates the expression of hsa-miR-506-3p, hsa-miR-3119 and hsa-miR- 212-5p in the tissue. This regulatory type prompts us that these four miRNAs may act as potential makers of diagnosis, treatment, and prognosis for SCG patients.
In tissue samples, the most significantly up-regulated miRNA was hsa-miR-196b-5p. Previous studies have reported the overexpression of hsa-miR-196b-5p to be associated with Ebola virus29, while low expression of it causes relapse in patients with multiple sclerosis30. This indicates that the dysregulation of hsa-miR-196b-5p plays an important role in regulating physiological function as well as pathology. In addition, miR-302f is most significantly down-regulated in SC-GBM patient tissues in this study, whereas it is up-regulated in gastric cancer tissues, confirming the tissue specificity of miRNAs31. Growth differentiation factor 15 (GDF15), has been shown to be one of the target genes for p5332. In this study, we found that GDF15 can directly target hsa-miR-3664-3p, a miRNA whose expression was downregulated in SC-GBM tissue (FD = 0.17; P = 0.038). It is well-established that miRNAs inhibit the expression of their target genes33. Therefore, the decrease of hsa-miR-3664-3p expression in SC-GBM may result in the increase of its target gene GDF15 and further increase the expression of p53. In addition, another GDF15-related gene miR-3189, consistent with previous findings34, was elevated in SC-GBM compared to L-SCG.
Pathway analysis identified several pathways related to cancer. For example, “Glioma” and “Pathways in cancer” are two of the most enriched pathways. In addition, “mTOR signalling pathway”, “Pathways in cancer”, “Proteoglycans in cancer” and “Signalling pathways regulating pluripotency of stem cells” are present in both tissue and blood DEmiRNAs, which have been shown to be involved in the pathogenesis of glioma35,36. It is interesting that the most significantly increased pathway in blood samples, “Salmonella infection” (has-05132), has been shown to inhibit the growth of glioma37. Consistent with these outcomes, our results also indicated that Salmonella infection pathway may play a crucial role in the self-destruction of SCG via genetic modification.
To the best of our knowledge, this is the first study to investigate the role of miRNAs in SCG pathology. We used miRNA microarray and bioinformatics to screen out differentially expressed miRNAs in the tissue and blood of gliomas of different grades, and found that the miRNA expression pattern between blood and cancer tissue samples only partially overlaps, probably due to the presence of immune cells or metastatic regions from other tumours in the blood circulatory system38. The evidence presented in this study provides a basis for further study of the regulatory role of miRNAs in the molecular mechanism of mRNAs. Future studies should also be undertaken to elucidate the functional relevance of miRNAs that have been shown in this study to be differentially expressed in disease.
Materials and Methods
Patients and samples preparation
In this study, based on the 2016 WHO Classification of the Central Nervous14, we selected 10 patients with SCG who went through surgical treatment without preoperative chemotherapy or radiotherapy in the department of neurosurgery of Capital Medical University Sanbo Brain Hospital (2016.02-2016.12). The study cohort including high-grade group (WHO IV, n = 5) and low-grade group (WHO I-II, n = 5) SCG patients; respectively, whichever arterial blood and tissue samples for miRNA analysis were collected during surgery. Subsequently, the patient’s clinical data, including survival data, was obtained by us. The research protocol was approved and supervised by The Ethics Committee of BUCM (Beijing University of Chinese Medicine) and Capital Medical University Sanbo Brain Hospital. All procedures performed in studies involving human participants were in accordance with the ethical standards of the institutional and with the 1964 Helsinki declaration and its later amendments or comparable ethical standards. All patients in this study gave written informed consent, including adults, whose informed consent came from the participants themselves; And the informed consent by parents of all minor participants (age below 18). Tissue samples were pathologically confirmed, and were stored in liquid nitrogen immediately after surgical resection. Blood samples were stored in EDTA tubes and placed in liquid nitrogen for subsequent use.
Tumor histopathology
We used Hematoxylin-eosin (HE) staining to assess the grade of SCG tissue samples. Briefly, tumor tissue were collected from different patients, and first fixed in 4% neutral formaldehyde fixative, then embded in paraffin. Sections of 3–5 mm thicknesses were used for HE staining, which was conducted according to convention methods. Finally, the morphological changes in tissue section was observed using an optical microscope (Olympus, Tokyo, Japan).
Microarray determination
We used the 7th generation human miRNA array (containing 3100 capture probes), using tissue and circulating blood from five SC-GBM patients and five low grade SCG. Total miRNAs were hybridized and labelled following the manufacturer’s manual (Exiqon). Afterwards, an Axon GenePix 4000B microarray scanner (Axon Instruments, Foster City, CA) was used to scan the slides. Then, the scanned images were imported into GenePix Pro 6.0 software (Axon) for grid alignment and data extraction. After median normalization, significant DEmiRNAs between two groups were identified through FC and P-value.
Quantitative Real-time PCR verification
RT-PCR was conducted according to An et al. protocol39. Total RNA was extracted from SCG tissue and blood with Trizol reagent (Invitrogen, Carlsbad, CA, USA). Complementary DNA (cDNA) was synthesized with a cDNA Reverse Transcription Kit (Invitrogen Life Technologies, USA) using 2 μg of total RNA, and miRNA expression was measured by quantitative PCR using SYBR Premix ExTaq and an MX3000 instrument. The primers and miRNA used in this study are listed in Table 7. PCR data were normalized to U6 to calculate miRNA-181a-2-3p and hsa-miR-3189-3p.
Table 7.
MiRNA and mRNA primers for quantitative PCR analysis.
| Primer name | Sequence |
|---|---|
| U6 (H) |
F: 5′GCTTCGGCAGCACATATACTAAAAT3′ R: 5′CGCTTCACGAATTTGCGTGTCAT3′ |
| hsa-miR-181a-2-3p |
F: 5′ GCGCGACCACTGACCGTTGAC3′ R: 5′ ATCCAGTGCAGGGTCCGAGG3′ |
| hsa-miR-3189-3p | F: 5′ CCGCGCCCTTGGGTCTGATG3′ |
| R: 5′ ATCCAGTGCAGGGTCCGAGG3′ |
Link TCGA survival data to miRNA
We use the OncoLnc tool40 (http://www.oncolnc.org.) to link TCGA survival data for miRNAs. All study participants were diagnosed with GBM. First, select a single miRNA name (not case-sensitive). The Kaplan-Meier analysis option in the search results page was selected. We divided the patients into non-overlapping upper and lower sections, 25% upper and 25% lower. Finally, the drawn Kaplan-Meier diagram was displayed, and the CSV file with raw data used for the plot (Supplementary Data 3) was downloaded.
Differential miRNA target gene prediction
MirdbV5 and TaregetScan7.1, target prediction databases, were used to predict and analyse the target gene of abnormal expression of miRNAs. Then the result of the prediction takes the overlapping part of the gene obtained by these two databases, which were used to GO and KEGG Pathway analysis.
GO and pathway analysis
GO includes molecular, cellular and biological processes three sub-items. We used (http://www.geneontology.org) for GO analysis to obtain significantly enriched GO articles and corresponding genes to deduce important biological functions involved in DEmiRNAs. Meanwhile, based on the newest KEGG database, find out the pathways which are most associated with DEmiRNAs. Fisher’s exact test is used for identify pathway and GO entries which are significant correlated DEmiRNAs (p < 0.05).
Statistical analysis
SPSS software (20.0 Version) was used for statistical analyses. All results are expressed as mean ± SEM. Comparisons between multiple groups were analysed using one-way ANOVA analysis. Multivariate Cox regressions were performed with the coxph function from the R survival library40. A probability value of P less than 0.05 was considered significant.
Supplementary information
Acknowledgements
This work was supported by Grants from the National Natural Science Foundation of China (81774171), Tangshan Science and Technology Innovation Team Training Program (18130219A), Chaoyang District Collaborative Innovation Project (CYXC1719) and Horizontal subject of Zhong Fu Boai Health management (Beijing) Co., Ltd (2180071720024).
Author Contributions
T. Fan and G.J. Jiang designed the experiments; T. An. wrote the manuscript; T. An, Y.F. Liu, B.H. Lv and C. Liang performed the experiments; J.P.H. Huang, Y.Q. Wang, Y.H. Fu, X.Q. Zhang and X.G. Zhao analysed the data. All authors reviewed the manuscript.
Competing Interests
The authors declare no competing interests.
Footnotes
Publisher’s note: Springer Nature remains neutral with regard to jurisdictional claims in published maps and institutional affiliations.
Tian An and Tao Fan contributed equally.
Supplementary information
Supplementary information accompanies this paper at 10.1038/s41598-019-42364-x.
References
- 1.Ma CC, et al. Long non-coding RNA ATB promotes glioma malignancy by negatively regulating miR-200a. J Exp Clin Cancer Res. 2016;35(1):90. doi: 10.1186/s13046-016-0367-2. [DOI] [PMC free article] [PubMed] [Google Scholar]
- 2.Tobias A, Ahmed A, Moon KS, Lesniak MS. The art of gene therapy for glioma: a review of the challenging road to the bedside. J Neurol Neurosurg Psychiatry. 2013;84(2):213–222. doi: 10.1136/jnnp-2012-302946. [DOI] [PMC free article] [PubMed] [Google Scholar]
- 3.Duan R, et al. HOXA13 is a potential GBM diagnostic marker and promotes glioma invasion by activating the Wnt and TGF-beta pathways. Oncotarget. 2015;6(29):27778–27793. doi: 10.18632/oncotarget.4813. [DOI] [PMC free article] [PubMed] [Google Scholar]
- 4.Baulina NM, Kulakova OG, Favorova OO. MicroRNAs: The Role in Autoimmune Inflammation. Acta Naturae. 2016;8(1):21–33. doi: 10.32607/20758251-2016-8-1-21-33. [DOI] [PMC free article] [PubMed] [Google Scholar]
- 5.Xue H, et al. MicroRNA-584-3p, a novel tumor suppressor and prognostic marker, reduces the migration and invasion of human glioma cells by targeting hypoxia-induced ROCK1. Oncotarget. 2016;7(4):4785–4805. doi: 10.18632/oncotarget.6735. [DOI] [PMC free article] [PubMed] [Google Scholar]
- 6.Fan YH, et al. Overexpression of miR-98 inhibits cell invasion in glioma cell lines via downregulation of IKKepsilon. Eur Rev Med Pharmacol Sci. 2015;19(19):3593–3604. [PubMed] [Google Scholar]
- 7.Chai C, et al. Circulating miR-199a-3p in plasma and its potential diagnostic and prognostic value in glioma. Eur Rev Med Pharmacol Sci. 2016;20(23):4885–4890. [PubMed] [Google Scholar]
- 8.Liu Z, et al. MicroRNA-153 regulates glutamine metabolism in glioblastoma through targeting glutaminase. Tumour Biol. 2017;39(2):1393398235. doi: 10.1177/1010428317691429. [DOI] [PubMed] [Google Scholar]
- 9.Mo FF, et al. Jiang Tang Xiao Ke Granule Play an Anti-diabetic Role in Diabetic Mice Pancreatic Tissue by Regulating the mRNAs and MicroRNAs Associated with PI3K-Akt Signaling Pathway. Front Pharmacol. 2017;8:795. doi: 10.3389/fphar.2017.00795. [DOI] [PMC free article] [PubMed] [Google Scholar]
- 10.Ben-Hamo R, Efroni S. MicroRNA regulation of molecular pathways as a generic mechanism and as a core disease phenotype. Oncotarget. 2015;6(3):1594–1604. doi: 10.18632/oncotarget.2734. [DOI] [PMC free article] [PubMed] [Google Scholar]
- 11.Reddy KB. MicroRNA (miRNA) in cancer. Cancer Cell Int. 2015;15:38. doi: 10.1186/s12935-015-0185-1. [DOI] [PMC free article] [PubMed] [Google Scholar]
- 12.Deng D, et al. MicroRNA-124-3p regulates cell proliferation, invasion, apoptosis, and bioenergetics by targeting PIM1 in astrocytoma. CANCER SCI. 2016;107(7):899–907. doi: 10.1111/cas.12946. [DOI] [PMC free article] [PubMed] [Google Scholar]
- 13.Song Hang, Zhang Yao, Liu Na, Zhao Sheng, Kong Yan, Yuan Liudi. miR-92a-3p Exerts Various Effects in Glioma and Glioma Stem-Like Cells Specifically Targeting CDH1/β-Catenin and Notch-1/Akt Signaling Pathways. International Journal of Molecular Sciences. 2016;17(11):1799. doi: 10.3390/ijms17111799. [DOI] [PMC free article] [PubMed] [Google Scholar]
- 14.Louis DN, et al. The 2016 World Health Organization Classification of Tumors of the Central Nervous System: a summary [J] Acta Neuropathologica. 2016;131(6):803–820. doi: 10.1007/s00401-016-1545-1. [DOI] [PubMed] [Google Scholar]
- 15.Jiang G, et al. Relationships of circular RNA with diabetes and depression. Sci Rep. 2017;7(1):7285. doi: 10.1038/s41598-017-07931-0. [DOI] [PMC free article] [PubMed] [Google Scholar]
- 16.Persson H, et al. Identification of new microRNAs in paired normal and tumor breast tissue suggests a dual role for the ERBB2/Her2 gene. Cancer Res. 2011;71(1):78–86. doi: 10.1158/0008-5472.CAN-10-1869. [DOI] [PubMed] [Google Scholar]
- 17.Mathupala SP, Guthikonda M, Sloan AE. RNAi based approaches to the treatment of malignant glioma. Technol Cancer Res Treat. 2006;5(3):261–269. doi: 10.1177/153303460600500313. [DOI] [PubMed] [Google Scholar]
- 18.Ohnishi YI, et al. Promotion of astrocytoma cell invasion by micro RNA-22 targeting of tissue inhibitor of matrix metalloproteinase-2. J Neurosurg Spine. 2017;26(3):396–403. doi: 10.3171/2016.8.SPINE16248. [DOI] [PubMed] [Google Scholar]
- 19.Beyer, S. et al. The Role of miRNAs in Angiogenesis, Invasion and Metabolism and Their Therapeutic Implications in Gliomas. Cancers (Basel). 9(7) (2017). [DOI] [PMC free article] [PubMed]
- 20.Hongyun H, Lin C. The concept of “growth boundary of glioma” and total resection of brain and spinal gliomas.Chinese. Journal of Clinical Medicine. 2013;14:21–22. [Google Scholar]
- 21.Drusco A, et al. A differentially expressed set of microRNAs in cerebro-spinal fluid (CSF) can diagnose CNS malignancies. Oncotarget. 2015;6(25):20829–20839. doi: 10.18632/oncotarget.4096. [DOI] [PMC free article] [PubMed] [Google Scholar]
- 22.Molina-Pinelo S, et al. Association between the miRNA signatures in plasma and bronchoalveolar fluid in respiratory pathologies. Dis Markers. 2012;32(4):221–230. doi: 10.1155/2012/873749. [DOI] [PMC free article] [PubMed] [Google Scholar]
- 23.Chen Y, Chen J, Liu Y, Li S, Huang P. Plasma miR-15b-5p, miR-338-5p, and miR-764 as Biomarkers for Hepatocellular Carcinoma. Med Sci Monit. 2015;21:1864–1871. doi: 10.12659/MSM.893082. [DOI] [PMC free article] [PubMed] [Google Scholar]
- 24.Kim H, et al. MicroRNA expression profiles and clinicopathological implications in lung adenocarcinoma according to EGFR, KRAS, and ALK status. Oncotarget. 2017;8(5):8484–8498. doi: 10.18632/oncotarget.14298. [DOI] [PMC free article] [PubMed] [Google Scholar]
- 25.Li W, et al. The SH3BGR/STAT3 Pathway Regulates Cell Migration and Angiogenesis Induced by a Gammaherpesvirus MicroRNA. Plos Pathog. 2016;12(4):e1005605. doi: 10.1371/journal.ppat.1005605. [DOI] [PMC free article] [PubMed] [Google Scholar]
- 26.Xu C, Zhang L, Duan L, Lu C. MicroRNA-3196 is inhibited by H2AX phosphorylation and attenuates lung cancer cell apoptosis by downregulating PUMA. Oncotarget. 2016;7(47):77764–77776. doi: 10.18632/oncotarget.12794. [DOI] [PMC free article] [PubMed] [Google Scholar]
- 27.Rivera-Diaz M, et al. MicroRNA-27a distinguishes glioblastoma multiforme from diffuse and anaplastic astrocytomas and has prognostic value. Am J Cancer Res. 2015;5(1):201–218. [PMC free article] [PubMed] [Google Scholar]
- 28.Zhou L, et al. MiR-27a-3p functions as an oncogene in gastric cancer by targeting BTG2. Oncotarget. 2016;7(32):51943–51954. doi: 10.18632/oncotarget.10460. [DOI] [PMC free article] [PubMed] [Google Scholar]
- 29.Sheng M, et al. Hsa-miR-1246, hsa-miR-320a and hsa-miR-196b-5p inhibitors can reduce the cytotoxicity of Ebola virus glycoprotein in vitro. Sci China Life Sci. 2014;57(10):959–972. doi: 10.1007/s11427-014-4742-y. [DOI] [PubMed] [Google Scholar]
- 30.Selmaj I, et al. Global exosome transcriptome profiling reveals biomarkers for multiple sclerosis. Ann Neurol. 2017;81(5):703–717. doi: 10.1002/ana.24931. [DOI] [PubMed] [Google Scholar]
- 31.Yao Y, et al. MicroRNA profiling of human gastric cancer. Mol Med Rep. 2009;2(6):963–970. doi: 10.3892/mmr_00000199. [DOI] [PubMed] [Google Scholar]
- 32.Jones MF, et al. Growth differentiation factor-15 encodes a novel microRNA 3189 that functions as a potent regulator of cell death. Cell Death Differ. 2015;22(10):1641–1653. doi: 10.1038/cdd.2015.9. [DOI] [PMC free article] [PubMed] [Google Scholar]
- 33.Zhang Y, Zhao S, Xu Z. Network and pathway analysis of microRNAs, transcription factors, target genes and host genes in human glioma. Oncol Lett. 2016;11(5):3534–3542. doi: 10.3892/ol.2016.4398. [DOI] [PMC free article] [PubMed] [Google Scholar]
- 34.Jeansonne D, et al. Anti-tumoral effects of miR-3189-3p in glioblastoma. J Biol Chem. 2015;290(13):8067–8080. doi: 10.1074/jbc.M114.633081. [DOI] [PMC free article] [PubMed] [Google Scholar]
- 35.Chao Y, et al. Mst1 regulates glioma cell proliferation via the AKT/mTOR signaling pathway. J Neurooncol. 2015;121(2):279–288. doi: 10.1007/s11060-014-1654-4. [DOI] [PubMed] [Google Scholar]
- 36.Liu M, et al. Phosphorylated mTOR and YAP serve as prognostic markers and therapeutic targets in gliomas. Lab Invest. 2017;97(11):1354–1363. doi: 10.1038/labinvest.2017.70. [DOI] [PubMed] [Google Scholar]
- 37.Mehta N, et al. Bacterial Carriers for Glioblastoma Therapy. Mol Ther Oncolytics. 2017;4:1–17. doi: 10.1016/j.omto.2016.12.003. [DOI] [PMC free article] [PubMed] [Google Scholar]
- 38.Nagy, Z. B. et al. Comparison of Circulating miRNAs Expression Alterations in Matched Tissue and Plasma Samples During Colorectal Cancer Progression. Pathol Oncol Res (2017). [DOI] [PubMed]
- 39.Mo FF, et al. Jiang Tang Xiao Ke Granule Play an Anti-diabetic Role in Diabetic Mice Pancreatic Tissue by Regulating the mRNAs and MicroRNAs Associated with PI3K-Akt Signaling Pathway[J] Frontiers in Pharmacology. 2017;8(6):795. doi: 10.3389/fphar.2017.00795. [DOI] [PMC free article] [PubMed] [Google Scholar]
- 40.Anaya Jordan. OncoLnc: linking TCGA survival data to mRNAs, miRNAs, and lncRNAs. PeerJ Computer Science. 2016;2:e67. doi: 10.7717/peerj-cs.67. [DOI] [Google Scholar]
Associated Data
This section collects any data citations, data availability statements, or supplementary materials included in this article.


