

Abstract
Introduction
Dental unit waterlines (DUWLs) are notorious for being contaminated with different bacterial species including the opportunistic pathogen Pseudomonas aeruginosa which poses a risk to patients and professionals. This work aimed at studying the occurrence and biofilm-forming ability (BFA) of P. aeruginosa in the output of DUWLs in a dental center in Egypt.
Methods
Water samples were collected from the outlets of the high-speed hand piece, the air/water syringe and the cup filler waterlines. Bacteriological analysis included heterotrophic plate count (HPC), isolation and identification of P. aeruginosa and determination of the antimicrobial susceptibility and the BFA of the isolates by tissue culture plate (TCP) method and tube method (TM).
Results
The average concentration of HPC bacteria in the output of the 3 DUWLs was 2.9×10⁴ CFU/μL where 88.3% of the samples exceeded the Egyptian standards for drinking water (<50 CFU L). P. aeruginosa was isolated from nine cup filler samples (which had a water source different from the other waterlines). The isolates were sensitive to all tested antimicrobials. Of these nine isolates, 6, 5 and 4 were positive for BFA by TCP, modified TCP and TM, respectively.
Conclusions
More stringent measures are required to ensure safer dental water; as the majority of studied samples exceeded the required HPC bacterial limit and P. aeruginosa isolates were detected. P. aeruginosa isolates from DUWLs may not be as resistant to antibiotics as what is reported in the literature about clinical isolates. Some P. aeruginosa isolates can colonize DUWLs despite their inability to form biofilms in experimental testing.
Keywords: Pseudomonas aeruginosa, dental unit waterlines, biofilm
Introduction
Contamination of output water from dental unit waterlines (DUWLs) with bacteria is hazardous for both patients and healthcare personnel.1 Environmental species represent the largest source of microbial contaminants found in DUWL output water. Certain environmental species are of concern as they can start biofilm formation and provide protection to more pathogenic species. In addition, different opportunistic pathogens have also been isolated from DUWLs, including legionellae, staphylococci, Pseudomonas aeruginosa and fungi.2,3
The Gram-negative bacterium P. aeruginosa is a common colonizer of DUWLs. It is a major healthcare-associated pathogen that can cause a wide spectrum of severe infections and its ability to form biofilms enhances the problem.4 Biofilm formation by P. aeruginosa involves the intercellular communication quorum-sensing (QS) system. QS is a population density-dependent system through which bacteria regulate different biological activities such as plasmid conjugation and bioluminescence. P. aeruginosa has three well-defined QS systems, las, rhl and PQS that control the production of different virulence factors. In P. aeruginosa, QS is involved in both the initiation and maturation of biofilm, where the las system is especially important during the late stages of biofilm development.5 Infections caused by P. aeruginosa are hard to treat because the organism is intrinsically resistant to many drugs and can also acquire new mechanisms of resistance, such as the production of β-lactamases and carbapenemases that hydrolyze most β- lactams.6
This work aimed at studying the occurrence of P. aeruginosa in the water output of DUWLs in a dental center in Alexandria, Egypt. It included the isolation and identification of P. aeruginosa followed by testing the biofilm-forming ability (BFA) and the antimicrobial susceptibility patterns of the isolates. In addition, the level of contamination of the studied water samples with heterotrophic plate count (HPC) bacteria, and the effect of clinical activity on such level, was also evaluated.
Methods
This study was carried out during a 5-month period from November 2016 to March 2017 on a total of 147 water samples randomly collected from seven dental clinics at a governmental dental center in Alexandria, Egypt. The minimal sample size was calculated based on a previously reported frequency of isolation of P. aeruginosa from DUWLs of 6%.7 By using a power of 80% (β=20%) to detect the prevalence of P. aeruginosa in DUWLs, precision 5% and α=0.05 (significance level 95%), the minimal required sample size was found to be 87 samples. When the anticipated prevalence was increased to 10%, the minimal required sample size became 140. This sample size was calculated using Epi-Info software version 7.1.5.2. The study was approved by the Ethics Committee at the High Institute of Public Health (HIPH), Alexandria University.
Dental units
Twenty DUs were used for this study. They were distributed over seven clinics as follows: five units from each of the clinics of pediatric dentistry and conservative treatment, and two units from each of the clinics of oral surgery, periodontics, implants, fixed prosthodontics and minor operations. Each DU received a dual water supply, where the high-speed handpiece and the air/water syringe waterlines were supplied by a refillable water reservoir attached to the unit, while the cup filler waterline was supplied by tap water. Contamination control procedures applied in the dental center where the study was conducted included the use of fresh distilled water to fill the water reservoirs every morning. Moreover, at the end of the clinic hours, the reservoir in each DU was emptied and kept in an inverted position until the next morning to ensure dryness. Every day, the DUWLs were flushed for 2 minutes before receiving the first patient and for 30 seconds between treatment sessions. Disinfection of the water reservoir, and the waterlines it supplied, was performed weekly using a hypochlorite solution. The treatment room had an air conditioning system. The average temperature was about 20°C.
Sampling
One hundred and forty samples, 120 mL each, were collected from the 20 DUS so that seven samples were collected from each DU, as follows:
(a) In the morning before receiving the first patient (T0): (four samples); one sample was collected from the outlets of each of the high-speed handpiece, the air/water syringe and the cup filler waterlines. One sample was also collected from the water reservoir attached to the unit.
(b) At midday while the DU was in use (T1): (three samples); one sample was collected from the outlets of each of the high-speed handpiece, the air/water syringe and the cup filler waterlines.
In addition to these 140 samples, one water sample was collected from the tap adjacent to the DUs in each of the seven clinics. These seven tap water samples, 120 mL each, were used to assess the water quality before entering the cup filler waterline.
Water samples were aseptically collected in sterile wide-mouthed ground glass stoppered bottles. Before sample collection, and to neutralize the effect of any residual chlorine, a few drops of sodium thiosulphate solution, to a final concentration of 160 mg/L, were added to each bottle followed by sterilization. All samples were transferred immediately to the microbiology laboratory at HIPH, Alexandria University, in an ice box and processed within one to four hours of collection.
Heterotrophic plate count (HPC)
The standard pour plate method was used. Water samples were subjected to serial 10-fold dilutions using sterile peptone water, and one mL of each sample and/or the appropriate dilutions (10-1 to 10-4) were dispensed into sterile Petri dishes. A volume of 15 mL of sterile molten plate count agar at approximately 45°C was aseptically poured into each plate. The agar was mixed with the sample aliquots and then allowed to set and solidify. The plates were inverted; and incubated at 37°C aerobically for 48 hours. Plates showing 30-300 colonies were counted.
Isolation and identification of P. aeruginosa
Water samples (100 mL) were filtered using a 0.45-µm nitro-cellulose membrane filter, which was aseptically removed with a sterile forceps and plated directly on cetrimide agar plates. The plates were incubated for 48 hours at 37°C. All blue-green colonies were purified by subculture on Mueller Hinton agar (MHA) plates for further identification. Isolates that were Gram negative bacilli, positive for oxidase, produced alkaline reaction indicated by pink, red or purple color in acetamide agar slants and produced alkaline/no change reaction with no hydrogen sulphide and no gas on triple sugar iron (TSI) agar slants were considered as P. aeruginosa.
Antimicrobial susceptibility testing
The identified P. aeruginosa isolates were screened for their antimicrobial susceptibility using single disc diffusion method described by Bauer et al.8 The antibiotics used included piperacillin, piperacillin/tazobactam, ticarcillin/clavulanate, ceftazidime, cefepime, aztreonam, imipenem, meropenem, colistin, polymyxin B, gentamicin, tobramycin, amikacin, and ciprofloxacin. Susceptibility was interpreted as susceptible, intermediate and resistant according to the Clinical and Laboratory Standards Institute (CLSI; 2016) tables.
Tube method for detection of BFA
The BFA of the P. aeruginosa isolates was detected using modified adherence assay according to Neeliet et al.9 An overnight culture of P. aeruginosa was suspended in 3 mL phosphate-buffered saline (PBS), absorbance being equal to one-McFarland; 150 µL of this suspension was inoculated into three mL of trypticase soy broth with 1% glucose (TSBglu) in a glass test tube. Tubes containing only TSBglu were introduced as negative controls. After 48h of incubation at 37°C, the culture was aspirated and the tube was washed with PBS. The biofilm layer on the wall of the test tube was fixed by air-drying and then stained with 3 mL of 0.1% crystal violet for 20 min. Excess stain was removed and the tubes were washed with distilled water, allowed to dry in an inverted position and examined for biofilm production. Biofilm formation was deemed positive when a visible film lined the sides and bottom of each tube, the amount of biofilm was visually scored as 0-absent, 1-weak, 2-moderate and 3-strong.
Microtiter plate (MTP) method for detection of BFA
The P. aeruginosa isolates were also tested for their ability to form biofilm by the MTP method according to Stepanović et al.10 with some modifications. A single colony isolated from an overnight culture on MHA plates was inoculated in three mL of TSBglu and incubated for 24 hours at 37°C in stationary conditions. The cultures were adjusted to a turbidity of 0.5-McFarland standards using PBS and diluted 1 in 100 with fresh medium. Individual wells of sterile, 96 well MTP were filled with 200 µL of the diluted cultures; negative control wells contained uninoculated sterile broth only. After incubation (24 h at 37°C), the contents of each well were removed by gentle tapping and the wells were washed three times with 300 µL of sterile PBS.
The plates were drained in an inverted position. The biofilms formed by bacteria adherent to the wells were heat-fixed by exposure to hot air at 60°C for 60 minutes and then stained with 150 µL crystal violet (2% w/v) for 15 min. Excess stain was removed by using running tap water and the plates were kept for drying. For the modified MTP procedures, an additional extraction step was performed by adding 150 µL of 95% ethanol to each stained well and the plates were incubated for 30 minutes at room temperature to resolubilize and extract the dye bound to the adherent cells.
The optical density (OD) of each well was obtained with a microplate ELISA reader (Dialab ELX800G, Vienna, Austria) at wave length 630 nm. The reading was performed twice: (i) before addition of ethanol, as in the standard MTP test and (ii) after ethanol was added. The experiment was performed in triplicates and repeated three times and the results were averaged. The cut-off OD (ODc) was calculated as three standard deviations above the mean OD of the negative control. The isolates were classified as follows:
- OD ≤ ODc - non-biofilm former
- ODc < OD ≤ 2 × ODc - weak biofilm former
- 2 × ODc < OD ≤ 4 × ODc – moderate biofilm maker
- 4 × ODc < OD – strong biofilm former
Statistical analysis was performed using IBM SPSS software package version 20.0. (IBM Corp, Armonk, NY, USA). The statistical calculations included descriptive statistics, χ2 test, Kruskal Wallis test, Wilcoxon signed ranks test and Mann Whitney test. P <0.05 was considered significant.
Results
Heterotrophic plate count (HPC)
The values of contamination of water samples from the different sampling sites with HPC bacteria are shown in Table 1. Due to the absence of specific standards regarding DUWL water in Egypt, the acceptable limit for HPC bacteria in potable drinking water (<50 CFU/mL)11 has been used as a guideline. The average concentration of HPC bacteria in the water samples collected from the output of the 3 DUWLs was 2.9 × 10⁴ ± 7.5 × 10⁴ CFU/mL where only 14 (11.7%) of the samples conformed to the Egyptian standards.
Table 1. Concentration of HPC bacteria in the 147 examined water samples according to water source.
| Sample source | Examined samples (147) | HPC (CFU/mL) | Samples below threshold value | |||
|---|---|---|---|---|---|---|
| No | % | |||||
| Source water | Reservoir | 20 | Mean ± SD | 2.2 × 10⁴ ± 4.2 × 10⁴ | 4 | 20.0 |
| Median | 525 | |||||
| IQR (Q1 - Q3) | 26772.3 (52.8 - 26825) | |||||
| Tap water | 7 | Mean ± SD | 1.4 × 10 ± 1.1 × 10 | 7 | 100.0 | |
| Median | 38 | |||||
| IQR (Q1 - Q3) | 13 (29 - 42) | |||||
| Output water from DUWLs | High-speed handpiece | 40 | Mean ± SD | 4.5 × 10⁴ ± 1.0 × 10⁵ | 2 | 5.0 |
| Median | 2700 | |||||
| IQR (Q1 - Q3) | 49187.5 (62.5 - 49250) | |||||
| Air/water syringe | 40 | Mean ± SD | 3.8 × 10⁴ ± 7.5 × 10⁴ | 6 | 15.0 | |
| Median | 2450 | |||||
| IQR (Q1 - Q3) | 37227.5 (72.5 - 37300) | |||||
| Cup filler | 40 | Mean ± SD | 2.9 × 10³± 6.5 × 10³ | 6 | 15.0 | |
| Median | 865 | |||||
| IQR (Q1 - Q3) | 1677.5 (350 - 2027.5) | |||||
| Total DUWLs | 120 | Mean ± SD | 2.9 × 10⁴ ± 7.5 × 10⁴ | 14 | 11.7 | |
| Median | 1145 | |||||
| IQR (Q1 - Q3) | 11861.8 (88.3 - 11950) | |||||
CFU - colony-forming unit; DUWL - dental unit waterlines; HPC - heterotrophic plate count; IQR - interquartile range; SD - standard deviation.
The reservoir was found to harbor a higher mean value of HPC bacteria than tap water (p=0.002). The high-speed handpiece and the air/water syringe waterlines were both supplied by the water reservoir, but the mean HPC values for the air/water syringe samples were lower than the high-speed handpiece samples although the difference was not statistically significant (p=0.915).
Water samples collected from the output of the DUWLs were found to be more contaminated than the water sources that supplied them; the samples obtained from the output of the high-speed handpiece and the air/water syringe waterlines were more contaminated, although non-significantly, than the reservoir water samples (p=0.262 and 0.227, respectively). The cup filler waterline output samples, however, were significantly more contaminated than the tap water samples (p<0.001).
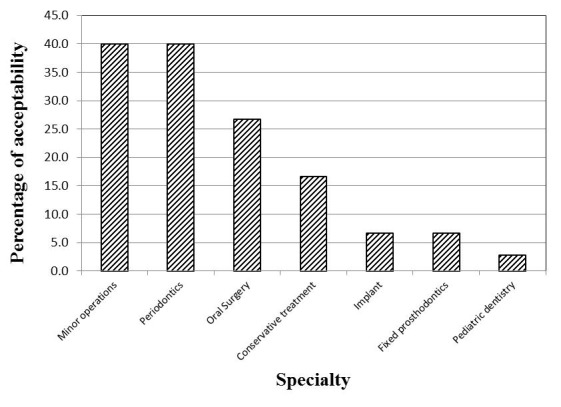
For the three waterlines, there was a decrease in the mean value of HPC in the midday (T1) samples as compared to the samples collected at the beginning of work (T0) (Figure 1). The decrease was found to be statistically significant in case of the high-speed handpiece and the air/water syringe waterlines (p=0.002, 0.009, respectively), but not in case of the cup filler waterline samples (p=0.108). The water samples from the clinics of the different specialties showed significantly different percentages of acceptability in relation to the Egyptian HPC standard for drinking water (p=0.002; Figure 2).
Figure 1. Mean values of HPC bacteria of the 120 examined water samples from DUWLs in relation to the collection time.
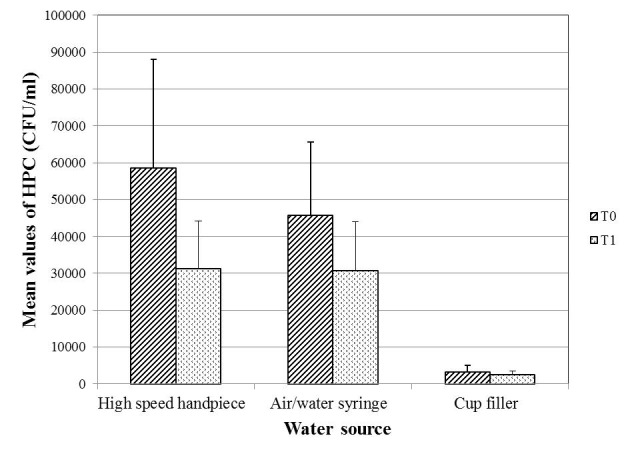
P-value for comparing the mean counts of HPC bacteria at T0 and T1= 0.002, 0.009 and 0.108 for the high-speed handpiece, the air/water syringe and the cup filler waterlines respectively.
CFU – colony-forming unit; DUWLs – dental unit waterlines; HPC – heterotrophic plate count; T0 – at the beginning of the working day; T1 – at midday.
Figure 2. Distribution of the 147 examined water samples from the different specialties according to their acceptability regarding HPC.
Isolation and identification of P. aeruginosa
P. aeruginosa was isolated from only nine samples, which represent 6.1% of the total 147 examined samples and 7.5% of the 120 DUWL samples. All of the 9 samples were from the output of the cup filler waterline, representing 22.5% of the samples collected from this source. The water samples collected from the clinics of the minor operations, oral surgery and implants did not yield any P. aeruginosa isolates. The 9 contaminated samples were distributed over the clinics of the remaining 4 specialties. (Table 2).
Table 2. Distribution of the 147 examined water samples from the different specialties according to their acceptability regarding P. aeruginosa.
| Clinic specialty | Examined water samples (147) | P. aeruginosa | χ2 | df | FEP | OR | 95% CI (LL - UL) | |||
|---|---|---|---|---|---|---|---|---|---|---|
| Acceptable (P. aeruginosa absent) | Unacceptable (P. aeruginosa present) | |||||||||
| No. | % | No. | % | |||||||
| Minor operations | 15 | 15 | 100 | 0 | 0.0 | 1.089 | 1 | 0.599 | - | - |
| Oral surgery | 15 | 15 | 100 | 0 | 0.0 | 1.089 | 1 | 0.599 | - | - |
| Implants | 15 | 15 | 100 | 0 | 0.0 | 1.089 | 1 | 0.599 | - | - |
| Fixed prosthodontics | 15 | 14 | 93.3 | 1 | 6.7 | 0.009 | 1 | 1.000 | 0.705 | 0.08 - 6.09 |
| Conservative treatment | 36 | 33 | 91.7 | 3 | 8.3 | 0.405 | 1 | 0.689 | 0.909 | 0.21 - 3.87 |
| Pediatric dentistry | 36 | 33 | 91.7 | 3 | 8.3 | 0.405 | 1 | 0.689 | 0.909 | 0.21 - 3.87 |
| Periodontics | 15 | 13 | 86.7 | 2 | 13.3 | 1.511 | 1 | 0.230 | 1.758 | 0.33 - 9.41 |
χ2, p - χ2 and p values for Chi square test
FEp - p value for Fisher’s Exact for Chi square test
CI - confidence interval; df - degrees of freedom; LL - lower limit; OR - odds ratio; UL - upper limit.
The level of contamination of any single water sample with HPC bacteria showed no correlation with the possibility of isolating P. aeruginosa from this sample (p value for Mann-Whitney test = 0.401).
Antimicrobial susceptibility testing
The results of the antibiotic susceptibility tests showed that the 9 P. aeruginosa isolates were sensitive to all of the used antibiotics.
Biofilm forming ability testing
The number of strains that showed positive BFA by the different detection methods is shown in Table 3. The three methods did not differ significantly as detectors of biofilm formation (MCp=0.885). The pairwise comparisons of the three methods did not reveal any significant differences either. The classification of the biofilm-producing strains into weak, moderate and strong varied insignificantly among the three methods.
Table 3. BFA of the 9 identified P. aeruginosa isolates as determined by the standard MTP method, the modified MTP method and the TM.
| The standard MTP method | The modified MTP method | The tube method | ||||||||||
|---|---|---|---|---|---|---|---|---|---|---|---|---|
| BFA | Negative | 3 | Negative | 4 | Negative | 5 | ||||||
| Positive | 6 | Weak | 3 | Positive | 5 | Weak | 2 | Positive | 4 | Weak | 3 | |
| Moderate | 0 | Moderate | 3 | Moderate | 1 | |||||||
| Strong | 3 | Strong | 0 | Strong | 0 | |||||||
BFA - biofilm forming ability; MTP - microtiter plate; TM - tube method
Discussion
Dentists, like other healthcare professionals, are ethically obliged to provide patients with a safe and clean clinical environment including the water supplied by DUs. This piece of work has confirmed the results of earlier research,7,12 which reported that the microbiological quality of water emerging from DUs did not conform to the accepted guidelines for potable water. In the present study, 88.3% of the examined DUWL output water samples failed to meet the Egyptian standards for HPC bacteria.
The tap water samples examined in this study showed a significantly lower HPC as compared to the reservoir samples (p=0.002). High levels of contamination of DU reservoirs were previously reported.1,12 Reservoirs are manually filled with water and may become contaminated with skin flora such as staphylococci.7 In addition, the growth of biofilm on their internal surfaces can cause rapid deterioration in the microbiological quality of the water.3
Previous research has demonstrated that bacterial counts differed among the DUWLs supplying different dental instruments.13 In the current study, the high-speed handpiece water samples showed a higher level of contamination than those from the air/water syringe, but the difference was not statistically significant. This seems to be consistent with the results obtained by other authors,1,14 who attributed the higher contamination of high-speed handpiece to their less frequent use compared to the air/water syringe.
In accordance with the results reported by Turetgen et al.,15 the current study found that DUWLs output water was more contaminated than the source water. Some researchers7,12 have attributed the higher level of contamination in the output water compared to the inlet water to the release of bacteria from biofilms lining the DUWLs; an explanation that can apply to the results of the current study too. The decrease in the mean HPC values after clinical activity observed in this study has also been previously reported;16,17 it can be attributed to the continued flushing of the waterlines during and between treatment sessions which can decrease the count in the midday samples.
Changes in the level of HPC contamination in the studied samples have occurred as water moved from the sources to the outlets and also as time passed from the morning to midday. Careful consideration of the significance of these changes in the individual waterlines suggested that the cup filler waterline was more likely colonized by a heavier and better established biofilm than the other two studied waterlines. This can be explained by the less frequent use of this waterline during the dental procedures.
Total absence/100 mL of P. aeruginosa from water used for routine dental treatment is recommended by the European Council directive 98/83. In the present study, P. aeruginosa was isolated from 7.5% (nine out of 120) of the DUWL output samples. All of the nine positive samples were from the cup filler waterline output water. The presence of P. aeruginosa in the output water of the cup filler waterline while being absent from tap water samples collected during the study means that the biofilm in the cup filler waterline has been seeded with the organism at a previous time when the tap water quality dropped for any reason. Wang et al.18 depicted P. aeruginosa as one of the opportunistic pathogens of plumbing systems and pointed out that it can be part of the native drinking water microbiota where it represents a major challenge to standard drinking water monitoring practices because it violates the paradigm of traditional fecal indicator bacteria. Given the fact that P. aeruginosa can persist in water systems over prolonged periods and that the waterlines involved in the current study have not been replaced since the time of installation of the DUs in 2006, it is likely that the cup filler waterlines have been colonized by P. aeruginosa at an earlier time.
It is noteworthy that the level of contamination of the water samples with HPC bacteria and the isolation of P. aeruginosa from these samples showed no correlation. On the contrary, the observed changes in the level of HPC contamination of water samples can be considered as a good predictor of the presence of P. aeruginosa. As previously discussed, analyzing these changes has marked the cup filler waterline as the most contaminated waterline; which agreed with the finding that this same waterline was the only one from which P. aeruginosa was isolated. This is consistent with the trend in some countries where maximum HPC values are being increasingly replaced by a guideline stating that ‘no abnormal change (NAC)’ should be detected, although guidelines are not clear on how NAC is defined.19
The water samples collected from the clinics of the different specialties showed varying degrees of contamination with HPC bacteria and P. aeruginosa. Szymanska and Sitkowska20 reported that the level of contamination of DUWLs may be related to the kind of procedures performed in dental offices and depends also on the degree of using the handpieces.
P. aeruginosa displays high intrinsic resistance to a wide variety of antibiotics, largely because of the low permeability of its outer membrane, which limits the rate of penetration of antibiotic molecules into the cells. In addition, the organism can develop acquired resistance through mutations or through the horizontal transfer of genetic resistance determinants.21 In the current study, however, the nine P. aeruginosa isolates were found to be sensitive to all of the tested antibiotics. The high sensitivity of environmental isolates of P. aeruginosa, compared to clinical isolates, was reported in a number of studies. These differences were attributed to the excessive use of antibiotics.22,23
Biofilm formation is essential for the establishment of P. aeruginosa infections on host tissues and for the colonization of medical devices.5 Results of the present study showed that not all of the 9 P. aeruginosa isolates recovered from the DUWL samples were capable of biofilm formation; the percentage of positive biofilm formers differed non-significantly from one method of detection to the other. The inability of some P. aeruginosa isolates from DUWLs to form biofilms has also been reported by Ouellet et al.24 The presence of P. aeruginosa isolates in DUWL output water despite the failure of some of them to produce biofilm in the different biofilm detection experiments can be explained by the fact that P. aeruginosa is capable of joining already existing biofilms furnished by other species.25 In the current study, no statistically significant differences were found among, or in-between, the three biofilm detection methods regarding their ability to detect and classify biofilm production by the nine P. aeruginosa isolates.
A limitation of the present study was using only conventional biochemical methods for the identification of P. aeruginosa isolates (Gram stain, oxidase test and triple sugar iron agar slants) and not using other nonconventional methods as BBL Crystal Enteric/Non-Fermenter ID Kit or MALDI-TOF MS, or VITEK 2 system for the identification and confirmation of P. aeruginosa isolates, as this was not feasible during the study period.
Conclusions
According to the Egyptian standards, the majority of studied water samples exceeded the allowed limit for HPC bacteria and more efforts should be dedicated to controlling this contamination. The changes in the level of HPC bacterial contamination in DUWL water can serve as an indicator for the presence of P. aeruginosa. P. aeruginosa isolates from DUWLs may not be as resistant to antibiotics as what is reported in the literature about isolates from clinical specimens. Some P. aeruginosa isolates can colonize DUWLs despite their inability to form biofilms in experimental testing.
Footnotes
Authors’ contributions statement: SAG is the corresponding author and performed the laboratory tests, drafted the manuscript and participated in data analysis. AAA designed and supervised the study, supervised laboratory work, analyzed and interpreted the data and reviewed the manuscript. AFA participated in study design and laboratory work supervision and contributed to data analysis and manuscript review. All authors read and approved the final version of the manuscript.
Conflicts of interest: All authors – none to declare.
Funding: None to declare.
References
- 1.Ji XY, Fei CN, Zhang Y, Zhang W, Liu J, Dong J. Evaluation of bacterial contamination of dental unit waterlines and use of a newly designed measurement device to assess retraction of a dental chair unit. Int Dent J. 2016;66:208–14. doi: 10.1111/idj.12225. [DOI] [PMC free article] [PubMed] [Google Scholar]
- 2.Zhang Y, Ping Y, Zhou R, Wang J, Zhang G. High throughput sequencing-based analysis of microbial diversity in dental unit waterlines supports the importance of providing safe water for clinical use. J Infect Public Health. 2018;11:357–63. doi: 10.1016/j.jiph.2017.09.017. [DOI] [PubMed] [Google Scholar]
- 3.O'Donnell MJ, Boyle MA, Russell RJ, Coleman DC. Management of dental unit waterline biofilms in the 21st century. Future Microbiol. 2011;6:1209–26. doi: 10.2217/fmb.11.104. [DOI] [PubMed] [Google Scholar]
- 4.Aprea L, Cannova L, Firenze A, Bivona MS, Amodio E, Romano N. Can technical, functional and structural characteristics of dental units predict Legionella pneumophila and Pseudomonas aeruginosa contamination? J Oral Sci. 2010;52:641–6. doi: 10.2334/josnusd.52.641. [DOI] [PubMed] [Google Scholar]
- 5.El-Khashaab TH, Erfan DM, Kamal A, El-Moussely LM, Ismail DK. Pseudomonas aeruginosa biofilm formation and quorum sensing lasR gene in patients with wound infection. Egypt J Med Microbiol. 2016;25:101–8. [Google Scholar]
- 6.Abaza A. Multi drug resistant Pseudomonas aeruginosa in a health care setting in Alexandria. J High Inst Public Health. 2010;40:333–47. [Google Scholar]
- 7.Güngör ND, Kadaifçiler DG, Peker OÖ. Investigation of the bacterial load and antibiotic susceptibility of dental units. Environ Monit Assess. 2014;186:1847–53. doi: 10.1007/s10661-013-3498-3. [DOI] [PubMed] [Google Scholar]
- 8.Bauer AW, Kirby WM, Sherris JC, Turck M. Antibiotic susceptibility testing by a standardized single disk method. Am J Clin Pathol. 1966;45:493–6. [PubMed] [Google Scholar]
- 9.Neeli VH, Parvathi T, Krishna PB. Study of biofilm production and anti-microbial susceptibility pattern of bacterial and fungal isolates from urinary catheters. Int J Curr Microbiol App Sci. 2016;5:415–24. [Google Scholar]
- 10.Stepanović S, Vuković D, Dakić I, Savić B, Švabić-Vlahović M. A modified microtiter-plate test for quantification of staphylococcal biofilm formation. J Microbiol Methods. 2000;40:175–9. doi: 10.1016/s0167-7012(00)00122-6. [DOI] [PubMed] [Google Scholar]
- 11.Decree of Health Minister (No.458) Egyptian standards for drinking and domestic use water. 2007. [Google Scholar]
- 12.Kotaka CR, Garcia LB, Ito FAN, Fuganti MR, Carnio J, Pelayo JS. Evaluation of the level of microbial contamination and prevalence of gram-negative non-fermentative rods in dental unit waterlines. RSBO. 2012;9:245–53. [Google Scholar]
- 13.Watanabe A, Tamaki N, Yokota K, Matsuyama M, Kokeguchi S. Monitoring of bacterial contamination of dental unit water lines using adenosine triphosphate bioluminescence. J Hosp Infect. 2016;94:393–6. doi: 10.1016/j.jhin.2016.08.001. [DOI] [PubMed] [Google Scholar]
- 14.Smith AJ, McHugh S, McCormick L, Stansfield R, McMillan A, Hood J. A cross sectional study of water quality from dental unit water lines in dental practices in the West of Scotland. Br Dent J. 2002;193:645–8. doi: 10.1038/sj.bdj.4801651. [DOI] [PubMed] [Google Scholar]
- 15.Türetgen I, Göksay D, Cotuk A. Comparison of the microbial load of incoming and distal outlet waters from dental unit water systems in Istanbul. Environ Monit Assess. 2009;158:9–14. doi: 10.1007/s10661-008-0560-7. [DOI] [PubMed] [Google Scholar]
- 16.Pasquarella C, Veronesi L, Napoli C, et al. Microbial environmental contamination in Italian dental clinics: A multicenter study yielding recommendations for standardized sampling methods and threshold values. Sci Total Environ. 2012;420:289–99. doi: 10.1016/j.scitotenv.2012.01.030. [DOI] [PubMed] [Google Scholar]
- 17.Guida M, Gallé F, Di Onofrio V, et al. Environmental microbial contamination in dental setting: a local experience. J Prev Med Hyg. 2012;53:207–12. [PubMed] [Google Scholar]
- 18.Wang H, Bédard E, Prévost M, Camper AK, Hill VR, Pruden A. Methodological approaches for monitoring opportunistic pathogens in premise plumbing: A review. Water Res. 2017;117:68–86. doi: 10.1016/j.watres.2017.03.046. [DOI] [PMC free article] [PubMed] [Google Scholar]
- 19.Van Nevel S, Koetzsch S, Proctor CR, et al. Flow cytometric bacterial cell counts challenge conventional heterotrophic plate counts for routine microbiological drinking water monitoring. Water Res. 2017;113:191–206. doi: 10.1016/j.watres.2017.01.065. [DOI] [PubMed] [Google Scholar]
- 20.Szymańska J, Sitkowska J. Evaluation of activities aimed at preventing microbiological risks in dental practice. Med Pr. 2013;64:11–7. [PubMed] [Google Scholar]
- 21.Breidenstein EB, de la Fuente-Núñez C, Hancock RE. Pseudomonas aeruginosa: all roads lead to resistance. Trends Microbiol. 2011;19:419–26. doi: 10.1016/j.tim.2011.04.005. [DOI] [PubMed] [Google Scholar]
- 22.Sivaraj S, Murugesan P, Muthuvelu S, Purusothaman S, Silambarasan A. Comparative study of Pseudomonas aeruginosa isolate recovered from clinical and environmental samples against antibiotics. Int J Pharm Pharm Sci. 2012;4:103–7. [Google Scholar]
- 23.Gholami S, Tabatabaei M, Sohrabi N. Comparison of biofilm formation and antibiotic resistance pattern of Pseudomonas aeruginosa in human and environmental isolates. Microb Pathog. 2017;109:94–8. doi: 10.1016/j.micpath.2017.05.004. [DOI] [PubMed] [Google Scholar]
- 24.Ouellet MM, Leduc A, Nadeau C, Barbeau J, Charette SJ. Pseudomonas aeruginosa isolates from dental unit waterlines can be divided in two distinct groups, including one displaying phenotypes similar to isolates from cystic fibrosis patients. Front Microbiol. 2015;5:802. doi: 10.3389/fmicb.2014.00802. [DOI] [PMC free article] [PubMed] [Google Scholar]
- 25.Bédard E, Prévost M, Déziel E. Pseudomonas aeruginosa in premise plumbing of large buildings. Microbiologyopen. 2016;5:937–56. doi: 10.1002/mbo3.391. [DOI] [PMC free article] [PubMed] [Google Scholar]