

Abstract
In rheumatoid arthritis research, NHP models of collagen-induced arthritis are important because these species share many immunologic and pathologic features with humans. In addition, serum levels of various cytokines in patients with rheumatoid arthritis have been studied as immune markers for disease prediction, early diagnosis, and effective therapeutic management. The purpose of this study was to identify changes in cytokine levels that occur during the development of collagen-induced arthritis in female cynomolgus macaques (n = 8) and to assess the relationships between these changes and various disease parameters. Blood samples were collected weekly before (week 0) and after (weeks 1 through 7) immunization with type II collagen; clinicopathologic and cytokine data from those samples and other clinical parameters were used in correlation analysis. Serum levels of IFNγ, chemokine (C-C motif) ligand 2 (CCL2), and IL6 showed significant changes after generation of collagen-induced arthritis. IFNγ levels showed a strong negative correlation with body weight (an indicator of general body condition), and CCL2 and IL6 showed moderate negative correlation with body weight. Serum IL6 levels showed moderate positive correlation with the soft tissue swelling score and strong positive correlation with serum C-reactive protein levels in our NHP model of collagen-induced arthritis. In addition, serum levels of matrix metalloproteinase 3 increased significantly after inoculation with type II collagen and showed a moderate positive correlation with serum levels of C-reactive protein, IL6, and IL15. These results suggest close correlations between various cytokines and disease parameters in NHP models of rheumatoid arthritis. These cytokines therefore potentially could be used as markers for monitoring the efficacy of novel treatments in NHP models of rheumatoid arthritis.
Abbreviations: CII, type II collagen; CIA, collagen-induced arthritis; CRP, C-reactive protein; RA, rheumatoid arthritis
Rheumatoid arthritis (RA) is a systemic autoimmune disease and the most common form of inflammatory arthritis.45 RA affects about 1% of the adult human population, and the associated increased activity in proinflammatory pathways and autoantibodies induce damage to the synovium, cartilage, and bone.40 Thus, RA can cause significant disability and discomfort and decrease quality of life.11 The pathogenesis of RA is not fully identified and apparently is multifactorial; the disease seems to be initiated or amplified by an interaction between CD4+ T cells and antigen-presenting cells. Macrophage activation occurs, and proinflammatory cytokines such IL1 and TNFα are secreted abundantly. Proinflammatory cytokines stimulate synovial fibroblasts and chondrocytes in the articular cartilage to secrete degrading enzymes, causing tissue destruction.3 TNFα blockers used to treat RA have become the world's best-selling biologics.31 However, not all RA patients benefit from treatment with TNFα blockers;5 therefore, exploration of other therapeutic targets, such as the cytokine blocker IL1 receptor antagonist, is needed.
Animal models for autoimmune diseases are important in studying the pathogenesis of diseases and developing new therapies.44 Among those models for RA, rodent models of collagen-induced arthritis (CIA) have been the most extensively used and the most widely studied.8,22,39 CIA is caused by overstimulation of innate immune reactivity by adjuvant treatment, which results in a systemic inflammatory response.7 Despite the utility of rodent models, it is important to study arthritis in NHP because they share many genetic, immunologic, and pathologic features with humans;30,48 due to their close phylogenetic relationship, humans and macaques show a larger percentage of shared nucleotide and amino acid sequences than that shared between humans and rodents. Genomic responses in mouse models poorly mimic human inflammatory diseases;41 in contrast to laboratory mice, NHP have many memory T cells.32 Macaque models are useful for studies of preclinical safety and efficacy of new therapeutics due to the similar phylogenetics of humans and macaques.30,48 Another reason for using NHP to study RA is that many of the new drugs currently being developed are monoclonal antibodies with specific targets, and NHP and humans share those specific target proteins.12 In our previous study, unexpected side effects occurred in our NHP models of CIA, including adverse effects that can present in patients with autoimmune diseases.12 Therefore, a NHP model of CIA can reflect the therapeutic effects and side effects in humans.
One review of the NHP CIA model suggests that quantitative parameters for monitoring arthritis are needed because a semiquantitative arthritis scoring system through clinical diagnosis can be subjective, and very mild swelling can be difficult to detect against the background of a macaque's black skin.18 The authors suggested quantitative parameters for monitoring arthritis in NHP: (1) body weight to reflect generalized disease status; (2) C-reactive protein (CRP) to follow inflammation; and (3) collagen crosslinks of hydroxylysyl pyridinoline and lysyl pyridinoline in urine as an indicator of joint tissue damage.18
Cytokines have a crucial role in the immune response, and perturbation in the cytokine network can initiate and perpetuate various autoimmune diseases.1,13,33 The cytokine network in RA is very complex, and targeting the cytokine unbalance potentially can control RA. Therefore, information regarding the various fluctuations in the cytokine and chemokine levels in the CIA model is beneficial to the research community. Correlations of serum IL6 level with clinical and laboratory indices of disease activity were studied in RA patients,29 and serum cytokines have been studied as serum immune markers in RA patients by using a multiplex system for early diagnosis, prediction of RA, and effective therapeutic management.2,10
No previous study has focused on the relationships (correlation) among various disease parameters and cytokines during the development of CIA in NHP; few studies have focused on the serial changes and relationships among a single parameter (serum Hgb concentration) and cytokine levels.47 Therefore, our purpose in the current study is to determine cytokine changes that occur during the development of CIA in cynomolgus macaques and to determine the relationships between cytokines and disease parameters in cynomolgus macaques with CIA.
Regarding the measurement of collagen crosslinks of hydroxylysyl pyridinoline and lysyl pyridinoline in urine, sample collection is cumbersome, and special equipment including HPLC instruments is necessary for analysis. Recent human studies suggest that serum levels of matrix metalloprotein 3 (MMP3) can be used as a laboratory marker to evaluate joint injury status and therapeutic effect and were superior to other traditional and routine laboratory indexes.28 Therefore, we here determine serum MMP3 changes during the development of CIA in cynomolgus macaques and the relationships between MMP3 and other disease parameters.
Materials and Methods
Study design.
We used blood samples collected from 8 female cynomolgus macaques in our previous study12 for analysis of MMP3 and various cytokines; blood samples were collected weekly before (week 0) and after (weeks 1 to 7) immunization with type II collagen (CII). Data obtained from those samples were used for correlation analysis.
Experimental animals.
We used 8 female cynomolgus macaques (age, approximately 3 y; body weight, 2 to 3 kg) that were confirmed to be healthy after CBC analysis, serum biochemistry, and health monitoring under protocols approved by the IACUC of Orient Genia (Sungnam, South Korea; IACUC no., ORIENT-IACUC-15077). Blood samples from all macaques were PCR-negative for herpes B virus, SIV, simian T lymphotropic virus, simian retrovirus type D, and tuberculosis (Zoologix, Chatsworth, CA). The macaques were housed individually in stainless steel cages and maintained on commercial dry food pellets (Primate Diet 5048, Lab Diet, St Louis, MO), vegetables, fruits, and water without restriction under SPF conditions (excluded organisms: herpes B virus, SIV, simian T lymphotropic virus, simian retrovirus type D, Monkeypox virus, Mycobacterium homis, Mycobacterium bovis, Marburg virus, and internal and external parasites). The cages were kept at a constant temperature (typically 23 ± 3 °C; June through August, 25 ± 4 °C) and humidity (30% to 70%). The animals were acclimated for at least 4 wk prior to use. Control samples (n = 3) for proliferation of PBMC and histopathology were acquired from donor macaques used in a study of allo-islet transplantation approved by the IACUC of Genia (IACUC no., ORIENT-IACUC-16019). All procedures were in compliance with Animal Welfare Act Regulations6 and the Guide for the Care and Use of Laboratory Animals,23 and all efforts were made to minimize animal pain and distress. The facility has been audited by the Korean Quarantine Inspection Agency and the Ministry of Food and Drug Safety.
Induction of CIA.
To introduce CIA, chicken CII (catalog no. C9301, Sigma–Aldrich, St Louis, MO) was dissolved overnight at 4 °C in 0.1 M acetic acid to a concentration of 4 mg/mL. To minimize inflammation and necrosis, 1 mL of emulsion containing 2 mg CII (0.5 mL) and complete Freund adjuvant (0.5 mL; Sigma-Aldrich) was divided among 10 to 20 sites over the base of the tail and the back of each animal and injected intradermally as a primary inoculation. Three weeks later, the macaques were given a booster injection of 2 mg CII (0.5 mL) in incomplete Freund adjuvant (0.5 mL; Sigma-Aldrich). The inoculation procedure was conducted under ketamine sedation (10 mg/kg IM). Analgesic medication (tramadol, 2 mg/kg PO BID; Tridol, Alpa-Starry Health Care, Aligarh, India) was given as needed in response to assessment by the animal caretakers and a veterinarian. Ulcerative skin lesions that developed at the immunization sites were cleaned with saline solution, and antibiotic ointment was applied (Bactroban Ointment, Hanall Biopharma, Daejeon, Korea).
Clinical assessment of arthritis.
Once each week, soft-tissue swelling (STS) in each joint was scored on a graded scale from 0 (none) to 5 (severe). All joints of the fingers, toes, elbows, knees, wrists, and ankles (total, 64 joints) were evaluated, and the scores of the joints were summed. The swelling was analyzed by caliper and by measuring the volume of the hands and feet by water immersion.
Blood collection.
Blood samples (4 mL) were collected from the femoral vein under ketamine sedation every week; 1 mL of each blood sample was collected into an EDTA tube for CBC analysis, and 3 mL was collected into a serum-separating tube for analysis of serum chemistry, antitype II collagen antibody, and various cytokines. Blood in serum-separating tubes was allowed to coagulate for 20 to 30 min, and sera were isolated immediately by centrifugation (1977 × g, 20 min). Sera for detection of antitype II collagen antibody and cytokines were aliquoted into four 2-mL polypropylene vials and stored at –70 °C. Serum chemistry parameters were measured immediately after serum separation.
Detection of antitype II collagen antibody.
CII antibodies were measured by using a commercial ELISA kit (human/macaque antichick type II collagen IgG antibody assay kit, Chondrex, Redmond, WA) according to the manufacturer's instructions.
Blood parameters and serum MMP3 levels.
CBC analysis (Cell Dyn 3700. Abbott Diagnostics, Lake Forest, IL) and serum chemistry (ALT, AST, total bilirubin, BUN, creatinine, total protein, albumin, Na+, K+, Cl–, and CRP; model 7180 clinical analyzer, Hitachi Chemical, Osaka, Japan) were performed. A macaque MMP3 ELISA kit (Elabscience, Wuhan, China) was used according to the manufacturer's instructions to detect serum levels of MMP3.
Measurement of serum cytokine levels.
Serum samples were assayed by using a NHP cytokine/chemokine Milliplex kit (catalog no. PRCYTOMAG-40K, Millipore, Bedford, MA) for IFNγ, IL1β, IL4, IL6, IL10, IL12p40, IL15, IL17A, CCL2, and TNFα according to the manufacturer's instructions. Briefly, the samples were measured twice to calculate the median fluorescence intensity. In addition, the MFI of each standard was obtained.
Proliferation of PBMC from macaques with CIA.
Blood samples (5 mL) were harvested from study macaques and supplemented with citrate phosphate dextrose adenine 1 solution (700 μL, Green Cross, Seoul, South Korea) as an anticoagulant. Gradient centrifugation with Ficoll-Paque (GE Healthcare Life Sciences, Piscataway, NJ) was performed at 400 × g for 30 min. PBMC were washed twice with PBS without calcium chloride or magnesium chloride (DPBS, Wel Gene, Seoul, South Korea) and adjusted to 2 × 10⁶ viable cells/mL in complete endotoxin-free RPMI 1640 medium (GE Healthcare Life Sciences) supplemented with 10% fetal calf serum (Gibco, Grand Island, NY) and 1× antibiotic–antimycotic (Gibco). PBMC (2 × 10⁵ cells/100 μL per well) were seeded in 96-well plates (Thermo Scientific, Waltham, MA). Cells were treated with CII (40 μg/mL) or not and cultured at 37 °C in a humidified 5% CO2–air atmosphere for 72 h (total volume, 200 μL per well). After 3 d in culture, BrdU assays (labeling time, 6 h; Cell Proliferation ELISA BrdU, colorimetric, Roche Diagnostics, Mannheim, Germany) were carried out according to the manufacturer's instructions. The reaction was quantified by measuring OD450, with a reference range wavelength of 690 nm. The stimulation index (mean OD value of CII-stimulated culture / mean OD value of medium-only culture) was calculated for each treatment.
Radiographic examination.
Radiographic images (Veterinary Digital Radiographic Imaging System, LATIVET, ATLAIM Corporation, Seongnam, South Korea) were obtained once each week from macaques under ketamine sedation, and changes were noted. The radiographic appearance of all 4 limbs was graded according to a previous study:30 0, no change; 1, disappearance of the articular cavity and progression of obscurity of the epiphysis; 2, increased number of joints lacking articular cavities, closure of the epiphysis, unclear boundary between bones, and progression of obscurity of the surroundings; and 3, further advancement of these changes and twisted bones.
Histopathology.
In this study, we assessed the macaques before (week 0) and after (weeks 1 to 7) CII immunization. For histopathology, data from CIA macaques (n = 4) and healthy control macaques (n = 3) were compared.
Affected interphalangeal joints were harvested from the macaques with STS, and the third digits of the hands and feet were harvested from control macaques without STS. For histopathologic examination, the proximal interphalangeal joint tissues were fixed with 10% neutral buffered formalin (Sigma-Aldrich) and subsequently decalcified with 15% EDTA (pH 7.4, BIOSESANG, Sungnam, South Korea) on a shaker at room temperature for 4 wk. After decalcification, the tissues were dehydrated and embedded in paraffin. For histopathologic assessment of damage, the paraffin-embedded tissues were sliced into 4-µm sections, deparaffinized in xylene, rehydrated in graded alcohol, and stained with hematoxylin and eosin (Dako, Carpinteria, CA) and safranin O (IHC World, Woodstock, MD). For immunohistochemistry of joint tissue, paraffin-embedded sections were deparaffinized in xylene, rehydrated in graded alcohol, and transferred to 0.01 M PBS (pH 7.4). Subsequently, sections underwent antigen retrieval with proteinase K (catalog no. S3020, Dako) for 15 min at room temperature. Endogenous peroxidase was blocked by incubating the slides with 3% hydrogen peroxide in PBS for 10 min at room temperature. After washing in PBS, sections were treated with 1% BSA for 2 h at room temperature to block nonspecific binding. Subsequently, sections were incubated overnight at 4 °C with rabbit antiCD3 (dilution, 1:1000; catalog no. A0452, Dako), and mouse antiCD68 (dilution, 1:50; catalog no. M0814, Dako) antibodies. After washing in PBS, peroxidase-conjugated antimouse/rabbit IgG (dilution 1:100; Real Envision Detection System Peroxidase DAB, Dako) for 1 h at room temperature. The color reaction was visualized by incubating with 0.05% 3,3′ DAB for 1 to 3 min, and then the sections were washed with distilled water. Finally, the sections were lightly counterstained with Harris hematoxylin (Youngdong Diagnostics, Yongin, South Korea) for 30 s to 1 min before dehydration and mounting. In addition, spleen and lymph node samples were stained with hematoxylin and eosin.
Statistical analysis.
All data are expressed in box-and-whisker plots. Difference between before and after inoculation values were examined statistically by using repeated-measures ANOVA and pairwise comparisons to compare the means from k-related samples. Group means were compared by using Mann–Whitney U tests (PBMC proliferation data, control compared with CIA). Normal distribution was assessed by using the Shapiro–Wilk test. Because most of the data were not distributed normally, nonparametric tests were used. Spearman rank correlations were used to evaluate relationships. Correlations were defined as weak positive (0.1 to 0.3), moderate positive (0.3 to 0.7), strong positive (0.7 to 1.0), weak negative (–0.1 to –0.3), moderate negative (–0.3 to –0.7), or strong negative (–0.7 to –1.0).
Confidence levels of 95% or higher were considered significant; that is, P value less than 0.05. All statistical analyses were performed by using SPSS version 22.0 (IBM, Armonk, NY).
Results
Here we focus on the clinical parameters, clinicopathologic data, serum levels of various cytokines, and their relationships during the development of a CIA model in cynomolgus macaques.
Clinical observations.
All macaques gradually lost body weight after CII inoculation. Compared with those at week 0, body weights at weeks 1, 3, 4, 5, 6, and 7 after inoculation decreased significantly (P = 0.005, P = 0.007, P = 0.028, P = 0.008, P = 0.003, and P = 0.002, respectively; Figure 1 A). STS was detected during weeks 4 through 7 after inoculation but did not reach statistical significance (Figure 1 B).
Figure 1.
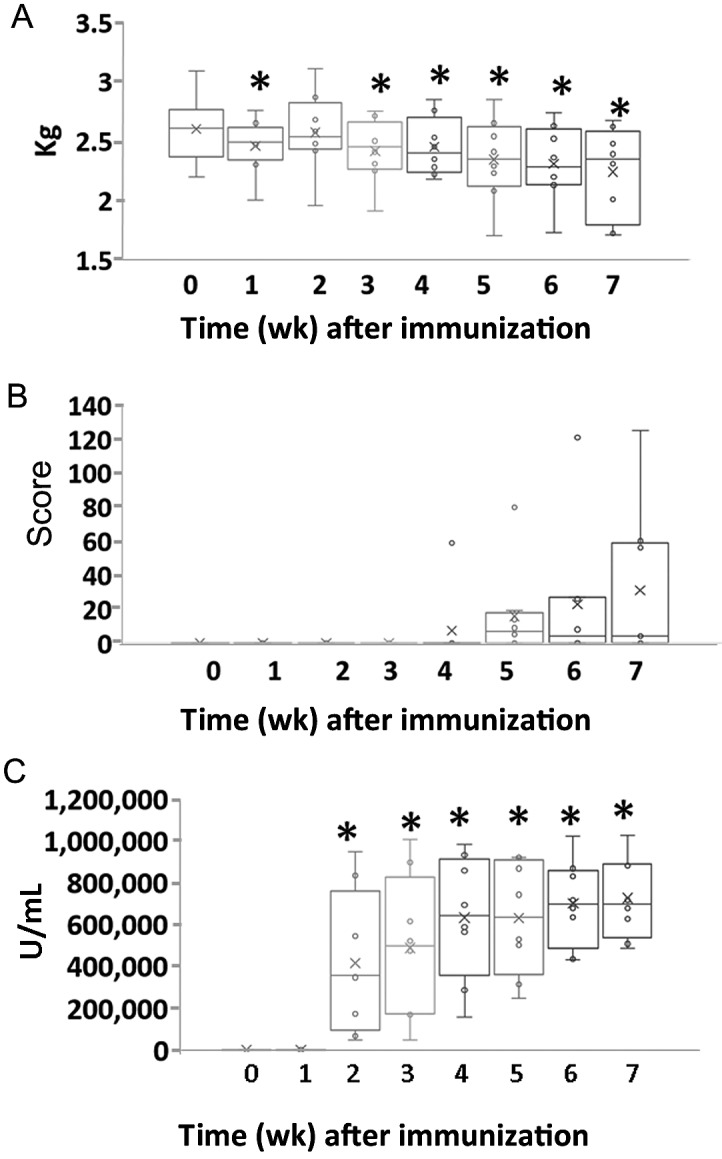
Changes in (A) body weight, (B) soft-tissue swelling scores, and (C) antitype II collagen antibody levels during the development of arthritis in an NHP model of collagen-induced arthritis. (A) Body weight (B) Soft tissue swelling scores (C) Serum level of antitype II collagen antibody. Data are expressed as box-and-whisker plots (n = 8); repeated-measures ANOVA and pairwise comparisons were used to evaluate the means of k-related samples (before compared with after CII inoculation). *, Values differ significantly (P < 0.05).
AntiCII antibody levels in serum.
Serum levels of antiCII antibodies increased gradually after CII inoculation and was significantly higher during weeks 2 through 7 than that at week 0 (week 2, P = 0.010; week 3, P = 0.005; week 4, P = 0.001; week 5, P < 0.001; week 6, P < 0.001; and week 7, P < 0.001; Figure 1 C).
Blood parameters.
WBC and platelet counts did not change significantly during the development of RA in cynomolgus macaques (Figure 2 A and B). Serum Hgb levels during weeks 1, 4, 5, 6, and 7 after inoculation were significantly lower than that at week 0 (P < 0.001, P = 0.005, P = 0.001, P = 0.001, and P = 0.024, respectively; Figure 2 C). Serum levels of CRP during weeks 3 through 7 after inoculation were significantly higher than that at week 0 (week 3, P = 0.035; week 4, P = 0.012; week 5, P = 0.013; week 6, P = 0.009; and week 7, P = 0.008, respectively; Figure 2 D). In addition, serum creatinine decreased gradually after CII inoculation, and decreased values persisted in most animals throughout the experimental period. These decreases in serum creatinine were significant during weeks 4, 5, 6, and 7 after inoculation (P = 0.013, P = 0.013, P = 0.049, and P = 0.027, respectively; Figure 2 E). The serum MMP3 level was significantly increased at all time points after inoculation (week 1, P = 0.008; week 2, P = 0.018; week 3, P = 0.029; week 4, P = 0.014; week 5, P = 0.026; week 6, P = 0.006; and week 7, P = 0.007; Figure 2 F).
Figure 2.

Changes in clinicopathologic parameters during development of arthritis in an NHP model of collagen-induced arthritis. (A) WBC count. (B) Platelet count. (C) Hgb concentration. (D) Serum level of C-reactive protein. (E) Serum creatinine. (F) Serum level of MMP3. Data are expressed in box-and-whisker plots (n = 8); repeated-measures ANOVA and pairwise comparisons were used to evaluate the means from k-related samples (before compared with after CII inoculation). *, Values differ significantly (P < 0.05).
Serum cytokine levels.
The serum levels of many inflammatory cytokines increased after CII induction of RA in cynomolgus macaques (Figure 3). Specifically, compared with week 0 levels, IFNγ increased during weeks 2 through 7 after inoculation (week 2, P = 0.035; week 3, P = 0.017; week 4, P = 0.022; week 5, P = 0.015; week 6, P = 0.015; and week 7, P = 0.016). Serum IL6 was increased during weeks 1, 3, and 4 (P = 0.019, P = 0.043, and P = 0.036, respectively), and the serum level of IL1β was significantly higher during week 4 than that at week 0 (P = 0.034). Serum CCL2 (that is, MCP1) was significantly higher during weeks 1, 2, 4, 5, 6, and 7 than at week 0 (P = 0.002, P = 0.012, P = 0.037, P = 0.008, P = 0.036, and P = 0.027, respectively). Levels of IL17A, TNFα, IL15, IL12p40, IL10, and IL4 did not change significantly during the development of CIA in cynomolgus macaques.
Figure 3.

Changes in serum cytokine levels during the development of arthritis in cynomolgus macaques. Serum levels of (A) IFNγ, (B) IL1β, (C) IL6, (D) IL17A, (E) CCL2 (MCP1), (F) TNFα, (G) IL15, (H) IL12p40, (I) IL10, and (J) IL4 were determined serially after CII inoculation. Data are expressed as box-and-whisker plots (n = 8); repeated-measures ANOVA and pairwise comparisons were used to evaluate the means from k-related samples (before compared with after CII inoculation). *, Values differ significantly (P < 0.05).
Correlation analysis.
Relationships between cytokines and disease parameters were analyzed in this study (Table 1). Serum levels of IFNγ, CCL2 (MCP1), and IL6 changed significantly after induction of CIA. Specifically, body weight (an indicator reflecting general body condition) was closely correlated (moderate negative correlation) with IFNγ (Spearman, r = –0.723, P < 0.001), CCL2 (MCP1; Spearman, r = –0.528, P < 0.001), and IL6 (Spearman, r = –0.472, P < 0.001). In particular, IFNγ levels showed a strong negative correlation with body weight. In addition, levels of IL6 (Spearman, r = 0.547, P < 0.001), IL15 (Spearman, r = 0.386, P = 0.002), and IFNγ (Spearman, r = 0.357, P = 0.004) were closely correlated (moderate positive correlation) with the clinically assessed STS score, and IL6 showed the highest correlation with STS score.
Table 1.
Relationships between parameters during development of collagen-induced arthritis in cynomolgus monkeys.
| Body weight |
STS score |
AntiCII |
MMP3 |
|||||
| Parameter | r | P | r | P | r | P | r | P |
| IL6 | −0.472b | <0.001 | 0.547b | <0.001 | 0.567b | <0.001 | 0.624b | <0.001 |
| IL15 | −0.275a | 0.028 | 0.386b | 0.002 | 0.353b | 0.004 | 0.447b | <0.001 |
| TNFα | −0.144 | 0.256 | 0.026 | 0.841 | −0.160 | 0.206 | −0.244 | 0.052 |
| CCL2 | −0.528b | <0.001 | 0.173 | 0.171 | 0.309a | 0.013 | −0.006 | 0.965 |
| IL4 | −0.474b | <0.001 | 0.160 | 0.207 | 0.181 | 0.153 | −0.168 | 0.186 |
| IL1β | −0.377b | 0.002 | 0.102 | 0.423 | 0.284a | 0.023 | −0.002 | 0.987 |
| IL17a | −0.108 | 0.395 | −0.024 | 0.851 | −0.017 | 0.893 | 0.115 | 0.366 |
| IL10 | −0.375b | 0.002 | 0.261 | 0.037 | 0.210 | 0.097 | 0.073 | 0.566 |
| IFNγ | −0.723b | <0.001 | 0.357b | 0.004 | 0.448b | <0.001 | 0.214 | 0.090 |
| IL12p40 | −0.325b | 0.009 | 0.290 | 0.020 | 0.077 | 0.545 | 0.165 | 0.192 |
| CRP | −0.519b | <0.001 | 0.542 | <0.001 | 0.529b | <0.001 | 0.536b | <0.001 |
| Creatinine | 0.343b | 0.005 | −0.604b | <0.001 | −0.413b | 0.001 | −0.221 | 0.079 |
| STS score | −0.464b | <0.001 | 1 | — | 0.286a | 0.022 | 0.287a | 0.021 |
| Body weight | 1 | — | −0.464b | <0.001 | −0.443b | <0.001 | 0.101 | 0.428 |
| Platelet | −0.266a | 0.034 | 0.057 | 0.657 | 0.049 | 0.698 | 0.051 | 0.690 |
| Hgb | 0.276a | 0.027 | −0.600b | <0.001 | −0.362b | 0.003 | −0.417b | 0.001 |
| WBC | 0.081 | 0.525 | −0.025 | 0.847 | −0.195 | 0.122 | 0.381b | 0.002 |
| AntiCII | −0.443b | <0.001 | 0.286 | 0.022 | 1 | — | 0.249a | 0.047 |
| MMP3 | 0.101 | 0.428 | 0.287 | 0.021 | 0.249a | 0.047 | 1 | — |
| CRP |
Creatinine |
Hgb |
WBC |
|||||
| Parameter | r | P | r | P | r | P | r | P |
| IL6 | 0.873b | <0.001 | −0.447b | <0.001 | −0.506b | <0.001 | 0.223 | 0.076 |
| IL15 | 0.588b | <0.001 | −0.501b | <0.001 | −0.298a | 0.017 | 0.021 | 0.871 |
| TNFα | −0.026 | 0.835 | 0.143 | 0.260 | 0.304a | 0.015 | 0.155 | 0.221 |
| CCL2 | 0.362b | 0.003 | −0.130 | 0.305 | −0.103 | 0.417 | 0.063 | 0.620 |
| IL4 | 0.092 | 0.472 | −0.225 | 0.075 | 0.098 | 0.441 | 0.212 | 0.093 |
| IL1β | 0.305a | 0.014 | −0.219 | 0.081 | −0.015 | 0.904 | 0.215 | 0.088 |
| IL17a | 0.188 | 0.137 | −0.137 | 0.279 | 0.158 | 0.212 | 0.437b | <0.001 |
| IL10 | 0.262a | 0.037 | −0.226 | 0.072 | 0.027 | 0.832 | 0.246 | 0.050 |
| IFNγ | 0.645b | <0.001 | −0.330b | 0.008 | −0.293a | 0.019 | −0.064 | 0.616 |
| IL12p40 | 0.347b | 0.005 | −0.156 | 0.217 | −0.044 | 0.730 | 0.241 | 0.055 |
| CRP | 1 | — | −0.345b | 0.005 | −0.425b | <0.001 | 0.136 | 0.285 |
| Creatinine | −0.345b | 0.005 | 1 | — | 0.486b | <0.001 | −0.003 | 0.983 |
| STS score | 0.542b | <0.001 | −0.604b | <0.001 | −0.600b | <0.001 | −0.025 | 0.847 |
| Body weight | −0.519b | <0.001 | 0.343b | 0.005 | 0.276a | 0.027 | 0.081 | 0.525 |
| Platelet | 0.042 | 0.744 | −0.092 | 0.470 | −0.179 | 0.157 | 0.203 | 0.108 |
| Hgb | −0.425b | <0.001 | 0.486b | <0.001 | 1 | — | −0.021 | 0.868 |
| WBC | 0.136 | 0.285 | −0.003 | 0.983 | −0.021 | 0.868 | 1 | — |
| AntiCII | 0.529b | <0.001 | −0.413b | 0.001 | −0.362b | 0.003 | −0.195 | 0.122 |
| MMP3 | 0.536b | <0.001 | −0.221 | 0.079 | −0.417b | 0.001 | 0.381b | 0.002 |
Spearman rank correlation was used to evaluate relationships between parameters: weak positive, 0.1 to 0.3; moderate positive, 0.3 to 0.7; strong positive, 0.7 to 1.0; weak negative, –0.1 to –0.3; moderate negative, –0.3 to –0.7; and strong negative, –0.7 to –1.0
P (2-tailed) < 0.05
P (2-tailed) < 0.01
In regard to monitoring inflammation, CRP was closely correlated with IL6 (Spearman, r = 0.873, P < 0.001), IFNγ (Spearman, r = 0.645, P < 0.001), and IL15 (Spearman, r = 0.588, P < 0.001), with IL6 showing strong positive correlation with CRP. STS scored showed moderate negative correlation with creatinine level (Spearman, r = –0.604, P < 0.001), body weight (Spearman, r = –0.464, P < 0.001), and Hgb (Spearman, r = -0.600, P < 0.001). Serum creatinine showed moderate positive correlation with body weight (Spearman, r = 0.343, P = 0.005). The MMP3 level in serum showed moderate positive correlation with the serum levels of CRP, IL6, and IL15 (Spearman, r = 0.536, P < 0.001; r = 0.624, P < 0.001; and r = 0.447, P < 0.001, respectively).
Proliferation of PBMC from macaques with CIA.
In vitro proliferation assays were performed to determine whether macaques with CIA showed increased proliferation of PBMC against the CII autoantigen. After culture in the presence of CII, PBMC from macaques with CIA showed a greater proliferative response than those from control macaques (Figure 4). The stimulation indexes (mean ± SEM) of the control and CIA groups were 1.349 ± 0.095 and 4.478 ± 1.145, respectively, and the stimulation index of the CIA group was significantly (P < 0.05) increased (Figure 4). These results suggest that the CIA model was induced appropriately immunologically.
Figure 4.

Proliferation of PBMC from macaques with collagen-induced arthritis (CIA). PBMC (2 × 10⁵ cells in 100 μL per well) were seeded in 96-well plates. Cells were cultured with or without CII (40 μg/mL) for 72 h, after which they were evaluated in a BrdU assay. The stimulation index value (mean optical density values of CII-stimulated cultures divided by the mean optical density values of medium-only cultures) was calculated for each treatment. (A) Proliferation of PBMC. (B) Proliferation of PBMC against CII. (C) Stimulation index. Data are expressed as box-and-whisker plots (n = 3 or 4 per group); group means were compared by using Mann–Whitney U tests. *, Value significantly (P < 0.05) different from that for the control group.
Radiographic examination.
From week 4 after inoculation onward, epiphyses became increasingly obscure, and the articular cavity disappeared on radiographic examination (Figure 5). STS scores greater than 0 were a score of 1 for 1 macaque at week 4; during week 5, 3 macaques had scores of 1 and 2 macaques showed scores of 2; for week 6, 2 macaques scored as 1 and 3 received a score of 2; and 2 macaques had scores of 1, 2 animals were score 2, and 1 macaque gained a score of 3 at week 7.
Figure 5.

Changes in radiographs of the hindfeet during the development of arthritis in an NHP model of collagen-induced arthritis. At week 4 after inoculation, the epiphysis became indistinct, and the articular cavity disappeared on radiographic examination (arrow).
Histopathology.
After the end of the experiment, the histopathology of the proximal interphalangeal joint was assessed. In the control macaques, which did not receive CII, the cartilage area stained bright red with safranin O (Figure 6 A), but the CIA macaques with proximal interphalangeal joint swelling showed narrowing of the joint space, and the cartilage area was severely damaged (Figure 6 A). In addition, the CIA macaques demonstrated erosion of the articular cartilage, infiltration of inflammatory cells (CD3+ T cells and CD68+ macrophages) and synovial hyperplasia, and overgrowth of pannus were observed (Figure 6 B). Furthermore, lymph nodes were enlarged; structural disorganization was present in lymph nodes and spleen; and proliferation of splenic white pulp and prominent germinal centers were present (Figure 6 C).
Figure 6.

Histopathology of the proximal interphalangeal joints, spleens, and lymph nodes from control and arthritic macaques. (A) Articular cartilage sections were stained with hematoxylin+eosin (H&E) and safranin O (original magnification: 12.5×, 40×, and 100×); in the control animals, the cartilage area stained bright red due to safranin O (arrow). However, in the CIA animals with proximal interphalangeal joint swelling, the joint space was narrowed, and the cartilage area was severely damaged (arrows). (B) Erosion of the articular cartilage, infiltration of inflammatory cells, synovial hyperplasia, and overgrowth of pannus are present in an animal with CIA. Immunohistochemistry with antiCD3 antibody and antiCD68 antibody revealed the infiltration of many CD3+ T cells and CD68+ macrophages into the synovium of macaques with CIA (arrows; original magnification: 40× and 200×). (C) Lymph nodes were enlarged, and structural disorganization was present in lymph nodes and spleen, with proliferation of white pulp and prominent germinal centers in an animal with CIA (arrow; H&E staining, original magnification: 40×).
Discussion
Susceptibility to arthritis development is highly strain dependent in CIA models. Among NHP species, squirrel, rhesus, and cynomolgus macaques are all susceptible, but cebus macaques are not.42 Studies of sex-linked differences in the susceptibility of cynomolgus macaques to CIA indicate that female cynomolgus macaques are more susceptible to CIA than males.46 Specifically, all 10 female macaques developed overt arthritis and produced antiCII antibodies and crossreactive antibodies to macaque type II collagen. In contrast, only 1 of 5 male macaques developed transient mild arthritis and little antibody to macaque type II collagen.42,46 Therefore, we used female cynomolgus macaques in the current study.
Induction of CIA was successful on the basis of clinical symptomatology, including joint swelling and stiffness; clinicopathologic and immunologic findings including elevated CRP levels, antitype II collagen antibody, and increased proliferation against autoantigen; and histopathologic findings of cartilage damage. According to previous studies, lymph node enlargement is an important physical finding associated with RA: a study regarding the frequency of palpable lymph nodes during active disease and remission in human patients with RA reported that overall frequency of enlarged lymph nodes in patients with active RA was 82%, and palpable lymph nodes disappeared during remission in the majority of patients.9 In histopathologic examination, lymphadenopathy in a patient with RA usually revealed reactive follicular hyperplasia, plasma cell infiltration in the interfollicular area, and increased germinal centers with many B cells.27,50 In our current study, lymph node enlargement and proliferation of white pulp and prominent germinal centers were observed in the spleen and lymph nodes from macaques with CIA. Furthermore, the number of proliferating B cells in lymph nodes and spleen were significantly increased in macaques with CIA in our previous study.12
In our cytokine assays, serum levels of IFNγ, CCL2, and IL6 significantly changed after induction of macaque CIA. In particular, the serum IFNγ level showed strong negative correlation and CCL2 and IL6 levels showed moderate negative correlation with body weight, which is an indicator of general body condition. Likewise, serum IFNγ, CCL2, and IL6 levels were significantly higher in mice at 6 wk after CIA induction than in normal age-matched DBA/1 mice.14 Furthermore, mice with CIA showed increased serum levels of IL15, IL2, IL4, KC, and TNFα but not of IL10, IL12p70, IL17, IL1α, IL1β, MIP2, or RANTES.
In a study of serum IFNγ, TNFα, and IL1β levels in 40 human patients with RA, increases in serum IFNγ were detected in 10 patients, TNFα in 20 patients, and IL1β in 5 patients.38 IFNγ seems to be dichotomous in RA: it plays a critical role in the pathogenesis of RA in humans by development of Th1 effector cells, stimulation of B cell maturation, antibody production of isotype switch to Th1-associated antibodies, increased expression of MHC I and II, stimulation of antigen presentation, and increased expression of cell adhesion molecules. In contrast, IFNγ is also an important immune modulator through inhibition of Th17 differentiation, increased activity of T regulatory cells, induction of immune tolerance by indoleamine 2,3-dioxygenase, inhibition of osteoclastogenesis, and inhibition of neutrophil-specific chemokine and mobilization of neutrophils.39
In previous studies, CCL2 (MCP1) levels in synovial fluid and serum were significantly higher in patients with RA compared with osteoarthritis and in patients with high RA disease activity compared with moderate disease activity.43 In addition, increased serum levels of IL8 and CCL2 were present in patients with juvenile RA showing systemic features.15 One study reported that, in human RA patients, serum levels of RANTES and CCL2 are more sensitive markers of disease activity than conventional markers of inflammation.51 The CCL2 results from human patient studies match well with those from our NHP study.
In this study, the serum level of CRP was closely correlated with IL6, IL15, and IFNγ; in particular, CRP showed a strong positive correlation with IL6 and moderate positive correlation with IL15 and IFNγ. CRP, which is associated with the inflammatory response, showed an increase beyond the upper limit of the reference range after CIA induction (that is, after CII inoculation). CRP is a key acute-phase protein in many species. In the production of acute-phase proteins, TNFα, IL1β, and IFNγ are essential for the expression of inflammatory mediators such as prostaglandins and leukotrienes, and these cytokines induce the production of platelet-activating factor and IL6. After stimulation by proinflammatory cytokines, Kupffer cells produce IL6 and present it to hepatocytes in the liver. Therefore, IL6 is the predominant mediator of the hepatocytic secretion of most acute-phase proteins.24
In previous studies of human patients, serum IL6 level during RA showed correlation with clinical and laboratory indices of disease activity, including CRP (r = 0.2), Ritchie articular index (r = 0.3), and duration of morning stiffness (r = 0.2).21,29 In addition, serum IL6 level showed better agreement with treatment response than did the erythrocyte sedimentation rate or CRP.26 In our macaque model of CIA, serum IL6 level was likewise correlated with various clinical and laboratory parameters, including CRP (r = 0.873), MMP3 (r = 0.624), antiCII antibody (r = 0.567), STS score (r = 0.547), Hgb (r = –0.506), and creatinine (r = –0.447). Consequently, IL6 potentially could be used as an additional marker in the evaluation of macaque CIA.
Hemoglobin also decreased significantly after CIA induction, and it decreased relatively less in subjects with fewer clinical symptoms. Anemia is one of the most common extraarticular manifestations of RA (30% to 60% of RA patients),19 and inflammatory cytokines are thought to play important roles in inflammatory anemia in RA.25 In a previous study, iron-deficient anemia was induced after collagen immunization in macaques; hemoglobin level, RBC count and serum iron level in cynomolgus macaque with CIA were negatively correlated with serum level of IL6.47 In our study, Hgb also showed moderate negative correlation with IL6 (r = –0.506, P < 0.001). One study suggested that IL6 is responsible for the hypoferremia of inflammation by inducing renal synthesis of hepcidin, the iron regulatory hormone.34 Hepcidin blocks iron absorption by the duodenum and inhibits the release of iron from macrophages.35
Serum creatinine level decreased significantly after CIA induction in our macaques. Serum creatinine is an index that reflects renal function, but its pattern is inversely proportional to the severity of arthritis: one study reported that an increased arthritis score was accompanied by a decrease in serum creatinine due to muscle wasting during CIA. Serum creatinine reflects muscle mass, and—in addition to joint destruction—muscle wasting is a quality-of-life issue for patients with RA;20 some studies revealed a higher risk of muscle wasting in patients with RA compared with the general population.37 Muscle dysfunction is a clinically intractable and common complication that negatively affects prognosis and quality of life in patients with.49 Creatinine is the spontaneous breakdown product of creatine phosphate and creatine, which mainly are found in striated muscle. Ideally, subjects should consume a meat-free diet for 7 d prior to measurement of creatinine levels. Consequently, the use of creatinine concentration to track muscle wasting may have limitations in human patients due to diet and renal function; however, this measure potentially could be useful in young experimental animals that are fed a controlled diet (commercial dry food pellets).
The major components of the cartilage matrix include type II collagen, proteoglycan, water, other proteins, and glycoprotein. MMP3 is one of the most important degrading enzymes of cartilage matrix.17 In RA, inflammatory cytokines such as TNFα, IL1β, and IL17 act synergistically and play a critical role in the secretion of matrix metalloproteinases from fibroblasts and macrophages. These proteolytic enzymes can destroy all of the structural proteins in the extracellular matrix of cartilage; therefore, MMP1 and MMP3 play important roles in RA.36 In our study, serum level of MMP3 increased significantly after CIA induction in NHP, and the serum level of MMP3 showed moderate positive correlation with those of CRP, IL6, and IL15. In recent human studies, serum levels of MMP3 showed moderate positive correlation with CRP (r = 0.39), serum amyloid A (r = 0.40), IL6 (r = 0.30),4 erythrocyte sedimentation rate (r = 0.62), and disease activity score (DAS 28, r = 0.57).16 MMP3 was shown to be superior to other traditional and routine laboratory indexes28 and therefore may be an informative laboratory marker for evaluating joint injury status and therapeutic effect.
Taken together, our results show that serum levels of IFNγ, CCL2, and IL6 change significantly after induction of CIA in NHP. These cytokines were closely correlated with body weight, which is an indicator of general body condition; IFNγ levels showed particularly strong negative correlation with body weight. In addition, among the tested cytokines, IL6 showed the highest correlation with STS score and serum CRP in NHP CIA (moderate positive and strong positive correlation, respectively). Furthermore, the serum level of MMP3 was significantly increased after compared with before induction of CIA and was moderately positively correlated with the serum levels of CRP, IL6, and IL15. These findings agree well with human studies, and patterns of serum immune markers in macaque CIA were similar to those of human RA. The cytokine network in rheumatoid arthritis is very complex, and targeting the cytokine unbalance can control RA. Furthermore, recent serum cytokine studies in human patients with RA showed that serum immune markers (cytokines) can be used as tools for diagnosis and prognosis10 and for effective therapeutic management.2
This study broadens our understanding of the relationships between cytokines and the disease parameters of CIA. These cytokines could be used as markers for monitoring during efficacy testing of new therapeutics in NHP.
Acknowledgments
We thank the animal care staff for providing technical support and assistance, especially Yong Sub Lee and Sang Hyun Moon (Transplantation Research Center, Samsung Biomedical Research Institute, Samsung Medical Center). We are grateful to Jong Hyun Lee (Transplantation Research Center, Samsung Biomedical Research Institute, Samsung Medical Center) for histopathologic support. This study was supported by a 2017 Research Grant from Kangwon National University (no. 520170386) to Eun Wha Choi. Additional support was provided by a grant from the Korean Health Technology R&D Project, Ministry of Health and Welfare, South Korea (no. HI13C1263) to Sungjoo Kim.
References
- 1.Adorini L. 2003. Cytokine-based immunointervention in the treatment of autoimmune diseases. Clin Exp Immunol 132:185–192. 10.1046/j.1365-2249.2003.02144.x. [DOI] [PMC free article] [PubMed] [Google Scholar]
- 2.Alex P, Szodoray P, Knowlton N, Dozmorov IM, Turner M, Frank MB, Arthur RE, Willis L, Flinn D, Hynd RF, Carson C, Kumar A, El-Gabalawy HS, Centola M. 2007. Multiplex serum cytokine monitoring as a prognostic tool in rheumatoid arthritis. Clin Exp Rheumatol 25:584–592. [PubMed] [Google Scholar]
- 3.Alghasham A, Rasheed Z. 2014. Therapeutic targets for rheumatoid arthritis: progress and promises. Autoimmunity 47:77–94. 10.3109/08916934.2013.873413. [DOI] [PubMed] [Google Scholar]
- 4.Ally MM, Hodkinson B, Meyer PW, Musenge E, Tikly M, Anderson R. 2013. Serum matrix metalloproteinase 3 in comparison with acute phase proteins as a marker of disease activity and radiographic damage in early rheumatoid arthritis. Mediators Inflamm 2013:1–6. 10.1155/2013/183653. [DOI] [PMC free article] [PubMed] [Google Scholar]
- 5.Alunno A, Carubbi F, Giacomelli R, Gerli R. 2017. Cytokines in the pathogenesis of rheumatoid arhtirits: new players and therapeutic targets. BMC Rheumatol 1:1–3. 10.1186/s41927-017-0001-8. [DOI] [PMC free article] [PubMed] [Google Scholar]
- 6. Animal Welfare Act as Amended. 2008. 7 USC §2131–2156.
- 7.Billiau A, Matthys P. 2011. Collagen-induced arthritis and related animal models: how much of their pathogenesis is autoimmune, how much is autoinflammatory? Cytokine Growth Factor Rev 22:339–344. 10.1016/j.cytogfr.2011.11.003. [DOI] [PubMed] [Google Scholar]
- 8.Brand DD, Latham KA, Rosloniec EF. 2007. Collagen-induced arthritis. Nat Protoc 2:1269–1275. 10.1038/nprot.2007.173. [DOI] [PubMed] [Google Scholar]
- 9.Çalgüneri M, Oztürk MA, Ozbalkan Z, Akdogan A, Ureten K, Kiraz S, Ertenli I. 2003. Frequency of lymphadenopathy in rheumatoid arthritis and systemic lupus erythematosus. J Int Med Res 31:345–349. 10.1177/147323000303100415. [DOI] [PubMed] [Google Scholar]
- 10.Chalan P, Bijzet J, van den Berg A, Kluiver J, Kroesen BJ, Boots AM, Brouwer E. 2016. Analysis of serum immune markers in seropositive and seronegative rheumatoid arthritis and in high-risk seropositive arthralgia patients. Sci Rep 6:1–9. 10.1038/srep26021. [DOI] [PMC free article] [PubMed] [Google Scholar]
- 11.Chaudhari K, Rizvi S, Syed BA. 2016. Rheumatoid arthritis: current and future trends. Nat Rev Drug Discov 15:305–306. 10.1038/nrd.2016.21. [DOI] [PubMed] [Google Scholar]
- 12.Choi EW, Lee KW, Park H, Kim H, Lee JH, Song JW, Yang J, Kwon Y, Kim TM, Park JB, Kim S. 2018. Therapeutic effects of antiCD154 antibody in cynomolgus monkeys with advanced rheumatoid arthritis. Sci Rep 8:1–13. 10.1038/s41598-018-20566-z. [DOI] [PMC free article] [PubMed] [Google Scholar]
- 13.Choi EW, Shin IS, Bhang DH, Lee DH, Bae BK, Kang MS, Kim DY, Hwang CY, Lee CW, Youn HY. 2006. Hormonal change and cytokine mRNA expression in peripheral blood mononuclear cells during the development of canine autoimmune thyroiditis. Clin Exp Immunol 146:101–108. 10.1111/j.1365-2249.2006.03187.x. [DOI] [PMC free article] [PubMed] [Google Scholar]
- 14.Choi EW, Yun TW, Song JW, Lee M, Yang J, Choi KS. 2015. Preventive effects of CTLA4Ig-overexpressing adipose tissue-derived mesenchymal stromal cells in rheumatoid arthritis. Cytotherapy 17:271–282. 10.1016/j.jcyt.2014.10.010. [DOI] [PubMed] [Google Scholar]
- 15.De Benedetti F, Pignatti P, Bernasconi S, Gerloni V, Matsushima K, Caporali R, Montecucco CM, Sozzani S, Fantini F, Martini A. 1999. Interleukin 8 and monocyte chemoattractant protein1 in patients with juvenile rheumatoid arthritis. Relation to onset types, disease activity, and synovial fluid leukocytes. J Rheumatol 26:425–431. [PubMed] [Google Scholar]
- 16.Fadda S, Abolkheir E, Afifi R, Gamal M. 2016. Serum matrix metalloproteinase 3 in rheumatoid arthritis patients: correlation with disease activity and joint destruction. The Egyptian rheumatologist 38:153–159. 10.1016/j.ejr.2016.01.001. [DOI] [Google Scholar]
- 17.Green MJ, Gough AK, Devlin J, Smith J, Astin P, Taylor D, Emery P. 2003. Serum MMP3 and MMP1 and progression of joint damage in early rheumatoid arthritis. Rheumatology (Oxford) 42:83–88. 10.1093/rheumatology/keg037. [DOI] [PubMed] [Google Scholar]
- 18.Hart BA, Bank RA, De Roos JA, Brok H, Jonker M, Theuns HM, Hakimi J, Te Koppele JM. 1998. Collagen-induced arthritis in rhesus monkeys: evaluation of markers for inflammation and joint degradation. Br J Rheumatol 37:314–323. 10.1093/rheumatology/37.3.314. [DOI] [PubMed] [Google Scholar]
- 19.Hochberg MC, Arnold CM, Hogans BB, Spivak JL. 1988. Serum immunoreactive erythropoietin in rheumatoid arthritis: impaired response to anemia. Arthritis Rheum 31:1318–1321. 10.1002/art.1780311016. [DOI] [PubMed] [Google Scholar]
- 20.Horai N, Nagaoka T, Higuchi I, Kasai H, Yoshioka T, Umekita Y, Fukuzaki K, Nagata R, Miyata A, Abeyama K. 2013. Muscle wasting associated with pathologic change is a risk factor for the exacerbation of joint swelling in collagen-induced arthritis in cynomolgus monkeys. BMC Musculoskelet Disord 14:1–10. 10.1186/1471-2474-14-205. [DOI] [PMC free article] [PubMed] [Google Scholar]
- 21.Houssiau FA, Devogelaer JP, Van Damme J, de Deuxchaisnes CN, Van Snick J. 1988. Interleukin 6 in synovial fluid and serum of patients with rheumatoid arthritis and other inflammatory arthritides. Arthritis Rheum 31:784–788. 10.1002/art.1780310614. [DOI] [PubMed] [Google Scholar]
- 22.Inglis JJ, Simelyte E, McCann FE, Criado G, Williams RO. 2008. Protocol for the induction of arthritis in C57BL/6 mice. Nat Protoc 3:612–618. 10.1038/nprot.2008.19. [DOI] [PubMed] [Google Scholar]
- 23.Institute for Laboratory Animal Research. 2011. Guide for the care and use of laboratory animals, 8th ed. Washington (DC): National Academies Press. [Google Scholar]
- 24.Jain S, Gautam V, Naseem S. 2011. Acute-phase proteins as a diagnostic tool. J Pharm Bioallied Sci 3:118–127. 10.4103/0975-7406.76489. [DOI] [PMC free article] [PubMed] [Google Scholar]
- 25.Jongen-Lavrencic M, Peeters HR, Wognum A, Vreugdenhil G, Breedveld FC, Swaak AJ. 1997. Elevated levels of inflammatory cytokines in bone marrow of patients with rheumatoid arthritis and anemia of chronic disease. J Rheumatol 24:1504–1509. [PubMed] [Google Scholar]
- 26.Kang SY, Kim MH, Lee WI. 2010. [Measurement of inflammatory cytokines in patients with rheumatoid arthritis.] Korean J Lab Med 30:301–306. 10.3343/kjlm.2010.30.3.301.[Article in Korean]. [DOI] [PubMed] [Google Scholar]
- 27.Kondratowicz GM, Symmons DP, Bacon PA, Mageed RA, Jones EL. 1990. Rheumatoid lymphadenopathy: a morphological and immunohistochemical study. J Clin Pathol 43:106–113. 10.1136/jcp.43.2.106. [DOI] [PMC free article] [PubMed] [Google Scholar]
- 28.Li L, Cai B, Liao J, Yang B, Huang Z, Wang L. 2013. [Clinical value of serum matrix metalloproteinase-3 in evaluating joint destruction and therapeutic effect in rheumatoid arthritis patients.] Xi Bao Yu Fen Zi Mian Yi Xue Za Zhi 29:966–969. [Article in Chinese]. [PubMed] [Google Scholar]
- 29.Madhok R, Crilly A, Watson J, Capell HA. 1993. Serum interleukin 6 levels in rheumatoid arthritis: correlations with clinical and laboratory indices of disease activity. Ann Rheum Dis 52:232–234. 10.1136/ard.52.3.232. [DOI] [PMC free article] [PubMed] [Google Scholar]
- 30.Mihara M, Kotoh M, Nishimoto N, Oda Y, Kumagai E, Takagi N, Tsunemi K, Ohsugi Y, Kishimoto T, Yoshizaki K, Takeda Y. 2001. Humanized antibody to human interleukin 6 receptor inhibits the development of collagen arthritis in cynomolgus monkeys. Clin Immunol 98:319–326. 10.1006/clim.2000.4989. [DOI] [PubMed] [Google Scholar]
- 31.Monaco C, Nanchahal J, Taylor P, Feldmann M. 2014. AntiTNF therapy: past, present, and future. Int Immunol 27:55–62. 10.1093/intimm/dxu102. [DOI] [PMC free article] [PubMed] [Google Scholar]
- 32.Nadazdin O, Boskovic S, Murakami T, O'Connor DH, Wiseman RW, Karl JA, Tuscher JJ, Sachs DH, Madsen JC, Tocco G, Kawai T, Cosimi AB, Benichou G. 2010. Phenotype, distribution and alloreactive properties of memory T cells from cynomolgus monkeys. Am J Transplant 10:1375–1384. 10.1111/j.1600-6143.2010.03119.x. [DOI] [PMC free article] [PubMed] [Google Scholar]
- 33.Nagy G, Huszthy PC, Fossum E, Konttinen Y, Nakken B, Szodoray P. 2015. Selected aspects in the pathogenesis of autoimmune diseases. Mediators Inflamm 2015:1–11. 10.1155/2015/351732. [DOI] [PMC free article] [PubMed] [Google Scholar]
- 34.Nemeth E, Rivera S, Gabayan V, Keller C, Taudorf S, Pedersen BK, Ganz T. 2004. IL6 mediates hypoferremia of inflammation by inducing the synthesis of the iron regulatory hormone hepcidin. J Clin Invest 113:1271–1276. 10.1172/JCI200420945. [DOI] [PMC free article] [PubMed] [Google Scholar]
- 35.Nicolas G, Bennoun M, Devaux I, Beaumont C, Grandchamp B, Kahn A, Vaulont S. 2001. Lack of hepcidin gene expression and severe tissue iron overload in upstream stimulatory factor 2 (USF2) knockout mice. Proc Natl Acad Sci USA 98:8780–8785. 10.1073/pnas.151179498. [DOI] [PMC free article] [PubMed] [Google Scholar]
- 36.Redlich K, Hayer S, Ricci R, David JP, Tohidast-Akrad M, Kollias G, Steiner G, Smolen JS, Wagner EF, Schett G. 2002. Osteoclasts are essential for TNFα-mediated joint destruction. J Clin Invest 110:1419–1427. 10.1172/JCI0215582. [DOI] [PMC free article] [PubMed] [Google Scholar]
- 37.Roubenoff R, Roubenoff RA, Cannon JG, Kehayias JJ, Zhuang H, Dawson-Hughes B, Dinarello CA, Rosenberg IH. 1994. Rheumatoid cachexia: cytokine-driven hypermetabolism accompanying reduced body cell mass in chronic inflammation. J Clin Invest 93:2379–2386. 10.1172/JCI117244. [DOI] [PMC free article] [PubMed] [Google Scholar]
- 38.Sakito S, Ueki Y, Eguchi K, Kawabe Y, Nagataki S. 1995. Serum cytokines in patients with rheumatoid arthritis. Correlation of interferon γ and tumor necrosis factor α with the characteristics of peripheral blood mononuclear cells. Rheumatol Int 15:31–37. 10.1007/BF00286766. [DOI] [PubMed] [Google Scholar]
- 39.Schurgers E, Billiau A, Matthys P. 2011. Collagen-induced arthritis as an animal model for rheumatoid arthritis: focus on interferon-γ. J Interferon Cytokine Res 31:917–926. 10.1089/jir.2011.0056. [DOI] [PubMed] [Google Scholar]
- 40.Scott DL, Wolfe F, Huizinga TW. 2010. Rheumatoid arthritis. Lancet 376:1094–1108. 10.1016/S0140-6736(10)60826-4. [DOI] [PubMed] [Google Scholar]
- 41.Seok J, Warren HS, Cuenca AG, Mindrinos MN, Baker HV, Xu W, Richards DR, McDonald-Smith GP, Gao H, Hennessy L, Finnerty CC, López CM, Honari S, Moore EE, Minei JP, Cuschieri J, Bankey PE, Johnson JL, Sperry J, Nathens AB, Billiar TR, West MA, Jeschke MG, Klein MB, Gamelli RL, Gibran NS, Brownstein BH, Miller-Graziano C, Calvano SE, Mason PH, Cobb JP, Rahme LG, Lowry SF, Maier RV, Moldawer LL, Herndon DN, Davis RW, Xiao W, Tompkins RG, Inflammation and Host Response to Injury, Large Scale Collaborative Research Program 2013. Genomic responses in mouse models poorly mimic human inflammatory diseases. Proc Natl Acad Sci USA 110:3507–3512. 10.1073/pnas.1222878110. [DOI] [PMC free article] [PubMed] [Google Scholar]
- 42.Shimozuru Y, Yamane S, Fujimoto K, Terao K, Honjo S, Nagai Y, Sawitzke AD, Terato K. 1998. Collagen-induced arthritis in nonhuman primates: multiple epitopes of type II collagen can induce autoimmune-mediated arthritis in outbred cynomolgus monkeys. Arthritis Rheum 41:507–514. . [DOI] [PubMed] [Google Scholar]
- 43.Stankovic A, Slavic V, Stamenkovic B, Kamenov B, Bojanovic M, Mitrovic DR. 2009. Serum and synovial fluid concentrations of CCL2 (MCP-1) chemokine in patients suffering rheumatoid arthritis and osteoarthritis reflect disease activity. Bratisl Lek Listy 110:641–646. [PubMed] [Google Scholar]
- 44.Taneja V, David CS. 2001. Lessons from animal models for human autoimmune diseases. Nat Immunol 2:781–784. 10.1038/ni0901-781. [DOI] [PubMed] [Google Scholar]
- 45.Terao C, Raychaudhuri S, Gregersen PK. 2016. Recent advances in defining the genetic basis of rheumatoid arthritis. Annu Rev Genomics Hum Genet 17:273–301. 10.1146/annurev-genom-090314-045919. [DOI] [PMC free article] [PubMed] [Google Scholar]
- 46.Terato K, Arai H, Shimozuru Y, Fukuda T, Tanaka H, Watanabe H, Nagai Y, Fujimoto K, Okubo F, Cho F, Honjo S, Cremer MA. 1989. Sex-linked differences in susceptibility of cynomolgus monkeys to type II collagen-induced arthritis. Evidence that epitope-specific immune suppression is involved in the regulation of type II collagen autoantibody formation. Arthritis Rheum 32:748–758. 10.1002/anr.1780320613. [DOI] [PubMed] [Google Scholar]
- 47.Uchiyama Y, Koike N, Mihara M. 2008. Anemia in monkey collagen-induced arthritis is correlated with serum IL6, but not TNFα. Rheumatol Int 28:879–883. 10.1007/s00296-008-0547-2. [DOI] [PubMed] [Google Scholar]
- 48.Vierboom MP, Zavodny PJ, Chou CC, Tagat JR, Pugliese-Sivo C, Strizki J, Steensma RW, McCombie SW, Celebi-Paul L, Remarque E, Jonker M, Narula SK, Hart B. 2005. Inhibition of the development of collagen-induced arthritis in rhesus monkeys by a small molecular weight antagonist of CCR5. Arthritis Rheum 52:627–636. 10.1002/art.20850. [DOI] [PubMed] [Google Scholar]
- 49.Walsmith J, Roubenoff R. 2002. Cachexia in rheumatoid arthritis. Int J Cardiol 85:89–99. 10.1016/S0167-5273(02)00237-1. [DOI] [PubMed] [Google Scholar]
- 50.Willkens RF, Roth GF, Husby G, Williams RC., Jr 1980. Immunocytological studies of lymph nodes in rheumatoid arthritis and malignant lymphoma. Ann Rheum Dis 39:147–151. 10.1136/ard.39.2.147. [DOI] [PMC free article] [PubMed] [Google Scholar]
- 51.Yao TC, Kuo ML, See LC, Ou LS, Lee WI, Chan CK, Huang JL. 2006. RANTES and monocyte chemoattractant protein 1 as sensitive markers of disease activity in patients with juvenile rheumatoid arthritis: a 6-y longitudinal study. Arthritis Rheum 54:2585–2593. 10.1002/art.21962. [DOI] [PubMed] [Google Scholar]