

Abstract
Phenotype is defined as the state of an organism resulting from interactions between genes, environment, disease, molecular mechanisms, and chance. The purpose of the emerging field of phenomics is to systematically determine and measure phenotypes across biology for the sake of understanding. Phenotypes can affect more than one cell type and life stage, so ideal phenotyping would include the state of every cell type within the context of both tissue architecture and the whole organism at each life stage. In medicine, high-resolution anatomic assessment of phenotype is obtained from histology. Histology’s interpretative power, codified by Virchow as cellular pathology, is derived from its ability to discern diagnostic and characteristic cellular changes in diseased tissues. Cellular pathology is observed in every major human disease, and relies on the ability of histology to detect cellular change in any cell type due to unbiased pan-cellular staining, even in optically opaque tissues. Our laboratory has shown that histology is far more sensitive than stereomicroscopy for detecting phenotypes in zebrafish mutants. Those studies have also shown that more complete sampling, greater consistency in sample orientation, and the inclusion of phenotypes extending over longer length scales would provide greater coverage of common phenotypes. We are developing technical approaches to achieve an ideal detection of cellular pathology using an improved form of microCT that retains the strengths and addresses the weaknesses of histology as a screening tool. We are using zebrafish as a vertebrate model based on the overlaps between zebrafish and mammalian tissue architecture, and a body size small enough to allow whole-organism, volumetric imaging at cellular resolution. Automation of whole-organism phenotyping would greatly increase the value of phenomics. Potential societal benefits would include reduction in the cost of drug development, a reduction in the incidence of unexpected severe drug and environmental toxicity, and more rapid elucidation of the contributions of genes and the environment to phenotypes, including the validation of candidate disease alleles identified in population and personal genetics.
Keywords: Genetics, Genomics, Phenomics, Zebrafish, Cellular Pathology, Systems Approach, High-throughput Phenotyping, Pan-cellular Phenotyping, Genetic phenomics, Environmental Phenomics, Chemical Phenomics, Microanatomical Phenomics, Whole-organism Cellular Pathology, Computational Phenomics, Imaging, Histology, MicroCT, Drug Testing, Toxicology, Toxicological Phenomics, Phenotypic Signatures
1. INTRODUCTION
In this chapter we have taken a systems approach to thinking about phenomics, focusing on what is ideally needed for anatomical phenotyping, which involves the evaluation of tissue architecture. After defining relevant terms, we begin with a consideration of what we have learned from the study of normal and diseased human and zebrafish tissues using histology, and consider potential approaches to an ideal higher-throughput, whole-organism, cellular phenotyping. We consider the history of phenotyping and phenomics, and review how light microscopy caused a revolution in biology and medicine. We then discuss limitations of histology learned from our experience with anatomic pathology and the histological phenotyping of zebrafish mutants. We conclude that whole-animal cellular pathology with computational phenotyping of all cell types and developmental stages will enable a phenomics that provides the greatest benefit to society
1.1. Phenotype:
Phenotypes are observable traits of organisms that represent the consequences of unique interactions between genetic background and environmental factors. Phenotyping involves recording of the observed features of an organism, and is of central importance in biology and medicine. High-throughput phenotyping, a primary focus in the emerging field of phenomics, has the potential to anchor the study of tens of thousands of genetic and chemical variables at a time and to connect genetic and environmental influences that share molecular pathways. However, advances in technology are necessary to facilitate large-scale phenotyping, both in terms of the number of observed individuals (so-called extensive phenotyping) and the depth of detail obtained per individual (intensive phenotyping) (Mahner and Kary, 1997; Houle et al., 2010).
1.2. Phenomics and Phenome Projects:
Phenomics is the large-scale study of phenotypes (reviewed by Lussier and Liu 2006; Houle et al. 2010; Cheng et al. 2011; Hancock 2014). Since a phenotype is the product of interactions between genes and environment, and those variables are typically studied one class at a time, phenomics can be separately considered in the contexts of genetic phenomics and environmental phenomics. The study of phenotypes caused by genetic manipulations or polymorphisms falls within the domain of genetic phenomics, while environmental influences on phenotype, including those associated with drug candidates and potential environmental toxins, can be studied within the context of an environmental phenomics. Within environmental phenomics, the study of phenotypes caused by chemicals and potential toxins can be called chemical phenomics and toxicological phenomics, respectively.
Phenomics is commonly discussed in the context of gene function at a genome-wide level (Mahner and Kary, 1997), and has been applied to the study of metabolism (Schilling et al., 1999), plant biology (Yang et al., 2013), evolutionary biology (Houle, 2010), and human health and disease (Lussier and Liu, 2006), including cancer (Zbuk and Eng, 2007) and neurological disorders (Gerlai, 2002). Clinical phenomics (Lussier and Liu 2006), in the form of medical informatics, is playing an increasingly important role in evidence-based medicine, and may become a focal point for comparative phenomics across model systems. If we take the hint from sets of phenotypes serving as the starting point for differential diagnosis in medicine, with some phenotypes being “pathognomonic” (unique to a given disease), it follows that molecular pathways may be associated with sets of phenotypes in one or more model systems that comprise phenotypic signatures (discussed in Canada 2010). Phenotypic signatures have been applied to screens for drugs that may be useful in neuropsychiatry. The behavioral screens used take advantage of the ability to test multiple zebrafish larvae per well in multi-well plates. Their behavioral phenotype-driven chemical screens are based on computer analysis of movement patterns induced by stimuli such as flashing lights and sound, and have yielded new biologically active compounds that fit into existing drug classes with shared phenotypic signatures (Rennekamp and Peterson, 2015).
Model system phenome projects are becoming critical tools for understanding disease, discovering new drugs, assessing potential environmental toxicants, and improving genotype-phenotype correlations. Vertebrate model organisms for which large-scale, collaborative genetic phenomics has been pursued include the mouse (Austin et al. 2004; Grubb et al. 2009; Brown et al. 2012; Mouse Phenome Database, http://phenome.jax.org; Knockout Mouse Project, http://www.mousephenotype.org), zebrafish (e.g. Zebrafish Phenome Project, and Zebrafish Mutation Project, http://www.sanger.ac.uk/resources/zebrafish/zmp; Cheng et al., 2011), and dog (e.g. Canine Phenome Project, http://www.caninephenome.org). Since some orthologous genes may show species-specific effects, comparative phenomics will play an important role in making model systems phenomics relevant to human biology and health. Since human disease is often defined by its histological, physiological, and neurological correlates, the detection of similar phenotypes in model systems help to define their human relevance.
1.3. Phenotype Omission Error:
The omission of phenotypes is a characteristic of present-day phenomics, and causes misleading uncertainties in both the presence and absence of a reported phenotype. Studies involving positional cloning, and now in personalized medicine, commonly remind us that our knowledge of the connections between genes and phenotypes is far from complete. A classic example of this problem was encountered during the positional cloning of the zebrafish golden pigmentation gene. Genetic mapping reduced the number of candidate genes to five within one genomic region, in the same gene order in both zebrafish and humans. At the time, however, none of these genes showed any known connection with pigmentation. Only by testing each candidate by morpholino knock-down (Nasevicius & Ekker, 2000) was it possible to associate a pigmentation phenotype with one of those genes; this association was subsequently supported by numerous genetic, genomic, and molecular tests in zebrafish and humans, and by correlation between pigmentation and genotype in African Americans (Lamason et al., 2005). Some of the deficiencies in existing phenotypic databases are a consequence of variations in phenotypic analysis between different laboratories, but most are likely due to the incomplete nature of phenome projects and current phenotyping methodologies.
The assignment of a specific phenotype to a single gene ideally means that all phenotypes have been tested, and that only one phenotype was found. However, a single phenotype more commonly means that only one phenotype was investigated, that the assay used did not have the sensitivity to detect changes in other organs, or alternatively, that the study was focused on one organ system due to the demands and constraints of publication and research funding. Likewise, unless otherwise specified, absence of any phenotype in a given organ or cell type may be the result of any of a number of possibilities: that no other phenotype has been detected during a detailed study, no test was performed, that the assay had insufficient sensitivity to detect other phenotypes that are present, or that other phenotypes were ignored. One frequent incomplete phenotype that is common in mouse phenome projects is “embryonic lethal”, which means that the embryos were not examined in detail. These issues may be collectively referred to as phenotype omission error. When trying to decide whether or not a drug is safe, it is of course crucial that a negative result is truly negative. Lack of a stated phenotype may otherwise create a false sense of confidence that the chemical in question is benign. The morbidity associated with the use of thalidomide is a striking example of a tragedy that potentially could have been avoided by the use of more complete phenotypic assays during drug testing (Gordon et al. 1981). In conclusion, it is in everyone’s interest to progressively improve our methods to eliminate phenotype omission error by improving our technologies and assays until they are capable of providing meaningful phenotypic measurements.
One approach to addressing phenotype omission error originates from the practice of human autopsy pathology (as observed during residency training by KCC), in which every organ in the body is studied grossly and sampled for anatomic and cellular disease phenotypes. The ideal complete autopsy effectively represents whole-organism phenotyping to the extent that every organ is examined. In reality, however, only a small fraction of each organ is examined histologically during autopsy. We are unaware of any multicellular organism for which every cell type, in the context of the entire organism, has been characterized in histological detail in a large-scale phenotypic screen. We are working to address this important scientific deficit.
1.4. Stereomicroscopy:
Stereomicroscopy, which utilizes “dissecting microscopes” with typical resolutions in the range of 5 microns, has been proven to be a practical and rapid tool for identifying developmental mutants in model organisms, and is commonly used to study the toxicological effects of chemicals because it provides a practical balance of large working distance and resolution. Surface features and organismal and organ shape may be readily scorable. However, functionally important details of internal tissue architecture are not readily discernable in unstained internal tissues, particularly if the organism is only translucent (as opposed to transparent), or is optically opaque for reasons such as tissue differentiation and pigmentation. Higher-resolution studies of differentiated tissues are of course required to provide insight into cellular change.
1.5. Molecular Imaging vs. Pan-cellular Phenotyping:
Gene- and protein-specific stains and fluorophores are popular, powerful tools for studying patterns of expression and mutant phenotypes, but are subject to the problem of phenotype omission error because, by the nature of the method, they do not provide histology-level data about potential phenotypes in the nonfluorescent cells, even for clearing-based methodologies (Chung & Diesseroth 2013). Pan-cellular phenotyping, or the unbiased study of all cell types in an affected tissue, is required to minimize this type of omission error. For example, epithelial cancers (carcinomas) are so named for their effects on epithelia, but are typically associated with clinically relevant changes to stromal tissues within which the tumor grows (Figure 1). In fact, the hardness of a palpated mass in breast cancer is due to the collagenous stromal response of the body to the tumor rather than the tumor cells themselves (Figure 1, Cotran et al 1999). Studies of epithelial cancers (carcinomas) that focus exclusively on cancer cells and pre-neoplastic epithelial tissue are likely to miss evidence that may indicate that the stroma contributes to the cancer phenotype (e.g. Bhomick et al 2004; Kalluri & Zeisberg 2006).
Figure 1. Infiltrating Ductal Carcinoma illustrating what is visible at different imaging resolutions.

The nuclei of nests of invading tumor cells are evident at 1.3x magnification, at which pixels are ~7.7 × 7.7 u, but cell types are difficult to discern. What is evident at this power, however, is that the cancer cells, generally represented by the purple cells, are surrounded by dense collections of collagen (stained pink) that cause the palpable hardness of tumors, and represents a reaction to the tumor. Virtually all cell types are distinguishable at 10x magnification, at which pixels are about 1 × 1 u. Arrowheads: Invasive nests of cancer cells with multiple, “back-to-back” glandular spaces, typical of ductal adenocarcinoma. Both panels are from the Penn State Histopathology Collection at bio-atlas.psu.edu, at http://bio-atlas.psu.edu/view.php?s=1817&atlas=107.
1.6. Why Histological Phenotyping?:
In medicine, the morbidities and mortality of every major disease, from cardiovascular disease and diabetes to cancer, are closely associated with micron to millimeter-scale cellular and tissue architectural changes that are both typical and informative of pathophysiological mechanisms; most of these microanatomical changes are evident by histology (Cotran et al., 1999). This knowledge motivates our present work to expand phenotyping to include microanatomy for studying the effects of disease, genetic, and/or environmental variables on organismal phenotype. The fascinating history of microscopy and its role in science and medicine makes clear the motivation underlying our current focus on the challenging problem of microanatomical phenotyping.
2. LESSONS FROM LIGHT MICROSCOPY
2.1. Early Tissue Phenotyping:
Tissue phenotyping was first made possible by the light microscopic study of stained tissue sections, which enabled the startling and unprecedented ability to assess both tissue architecture and the physiological state of component cells at the same time. A striking and historic confluence of multiple scientific advances made the development of the compound microscope possible. Those advances included the discoveries of tissue clearing, hardening and embedding to allow nearly transparent sections to be cut using microtomes (Hill, 1770; reviewed by Bracegirdle, 1987), the invention of the microtome for slicing tissue thin enough to distinguish individual cells in tissue sections (Bracegirdle 1987; Davis 1979), the production of glass of sufficient uniformity to produce lenses with cellular (sub-micron) resolution (reviewed by Vogel 2012), development of the mathematics of optics (Abbe, 1873, 1881, 1883), and advances in dye chemistry leading to differential stains for cellular components (Beer 1959; Travis et al 1992). Combined with a flourishing academic scientific environment at major universities, including the first medical schools based on science, these advances helped to create a market for microscope manufacture that could finance further improvements. From the microscopic study of tissue sections, we were able to learn, for the first time, that all living things are made of cells (Du Trochet 1824; Schleiden 1838; Schwann 1839), that all cells come from other cells (Omnis cellula e cellula; reviewed by Wright et al. 2012), and that the histological study of diseased tissues can provide insight into the cellular mechanisms of disease (Virchow, 1855); the latter work was published in book form by Virchow under the title, Cellular Pathology (1858). The concepts and activities that yielded Cellular Pathology represent the founding of the field of anatomic pathology, in which cellular disease phenotypes anchor our study of molecular mechanisms.
2.2. Histological Phenotyping in Medicine.
Light microscopic diagnosis by specialists in anatomic pathology remains today the clinical standard for making tissue diagnoses of diseases including cancer (Cotran et al. 1999). The purview of cellular pathology includes both the gross and microscopic changes associated with disease, which are physical phenotypes. A particularly important property that has made histology so powerful is the ability to survey all cell types at the same time through pan-cellular staining. The basis for pan-cellular recognition is the use of a combination of stains for different cellular components: one for nucleic acids (hematoxylin, which is purple) and one for protein (eosin, which is pink; Poole 1875; Figs 1, 2). Each cell type has a characteristic pattern of both nucleic acid and macromolecular protein and organellar structure that allows the recognition of different cell types as well as a readout of the physiological state of the cell. A long-term goal of our work is to extend the benefit of these histopathological principles to large-scale phenotypic screens in drug development, toxicology and genetics.
Figure 2. Cellular features, including chromosomes and Golgi body at different imaging resolutions.

Cells from the same Infiltrating ductal carcinoma as in Figure 1. which pixels are about 1 × 1 u. The cell at the arrowhead contains two clusters of chromosomes, whose threadlike appearance is visible at 40x (see http://bio-atlas.psu.edu/view.php?s=1817&atlas=107&z=0&c=59056,34025), particularly when focusing through optical sections on the microscope, and are barely discernable by individuals experienced in pathology. Individual chromosomes are not apparent when pixels reach about 1 u, and very few cytological features are visible when pixels reach about 2 u in dimension (about the size used in stereomicroscopy. G, Golgi apparatus, is the pale area next to the nucleus. Size bar, 20 u
2.3. Histological Phenotyping in Zebrafish.
The limitations of stereomicroscopy in terms of resolution and the detection of internal tissue architectural phenotypes predict that stereomicroscopy tends to underestimate the number of phenotypes in a sample compared with methods such as histology that have a higher spatial resolution. To enable the use of histology for genetic screens, we first had to develop tools for the histological study of zebrafish.
2.3.1. Method and Tool Development for Zebrafish Histology.
In the early 1990s, a number of laboratories, beginning with the founder of the modern age of zebrafish genetics, George Streisinger (Streisinger 1984), began zebrafish work that was guided by an interest in cancer. Our first work was based on the idea that genetic screens could be pursued that are inspired by biological processes involved in human cancer. One of the projects involved a genetic screen for mutants showing histological features of cancer. Basic protocols for fixation, decalcification, cutting and staining of fish were based on established practice in both human and mouse pathology performed in our department. Our earliest work showed that there is a tendency for fixed embryos to become bent or curled, and for collections of embryos to be badly misaligned. Since a screen required uniform histological sections of families of zebrafish larvae, we needed to develop a way to cut consistent sections of arrays of fish. We decided to try using agarose as a medium to hold families of fish in a uniform position within agarose wells – essentially a 3-dimensional version of gel combs used for gel electrophoresis. Penn State was well known for its development of artificial hearts, so we collaborated with a machinist who was familiar with machining parts for those hearts. We created molds to create uniform wells for aligning arrays of fixed fish in agarose blocks (Tsao-Wu et al 1998; Moore et al. 2002; Moore et al. 2006; and Sabaliauskas et al. 2006). This work was performed in parallel with the development of methods for creating orthogonal sections of adults with neoplasms (Beckwith et al. 2000; Moore et al. 2006).
2.3.2. Lessons from Creating a Web-based Histology Atlas.
Since an understanding of normal histology is required to interpret histopathology, there was also need for an online atlas of microanatomy for the zebrafish community. Our laboratory lead this task (Cheng, 2004; see http://www.bio-atlas.psu.edu) based on our fortunate proximity to a histotechnologist (Lynn Budgeon) with great talent and a vast experience in processing and sectioning different animal tissues who worked in the laboratory of a generous colleague (Neil Christensen). Creation of this atlas required the generation of zebrafish at different ages, and the setting of standards of fixation, decalcification (of adults), and the generation of slices oriented in the three standard orientations for histology (coronal, sagittal, and transverse). To increase the throughput and consistency of orientation of histological sections of zebrafish, we used the plastic molds cited above. The mold was useful, but creating sections of well-oriented and straight fish was non-trivial. As a result, many more fish and sections were cut than could be used for the atlas. During this time, we imagined that if we could create images of whole fish in 3D at sufficient resolution, we could digitally cut sections in any plane. However, no existing 3D imaging methods were noted to have the required combination of pan-cellular staining and cellular resolution. For several years we attempted to generate 3D reconstructions from serial sections. We utilized 1 micron thick plastic sections rather than the tradition 5 micron paraffin sections due to their lower sample distortion and greater z-axis resolution. Unfortunately, due to a combination of sample distortion associated with floating of slices on water, and slice thicknesses that differed from optical 2D resolution, we were unable to align slices enough to create 3D volumes. These experiences with zebrafish histology left us wishing for a way to create 3D images of whole fish that we could digitally slice and otherwise manipulate and study from different orientations.
A “doubled” 20x objective used in the digital slide scanner (Aperio AT2) was used to create digital representations of the slides for posting to the online atlas. Available magnifications on the website include each of the commonly used objective powers used in the practice of anatomic pathology. For the purposes of our present discussion, pixel dimensions, corresponding to slide scans at 10x, 20x, and 40x magnifications, are about 1.0, 0.5 and 0.25 microns, respectively. The effect of lower resolution on the recognition of cellular structures is illustrated in Figure 2. The physical dimensions of structures such as the Golgi body and chromosome determine whether or not they would be visible on the digital slide. In practical terms, the ability to resolve a given structure in a digital image requires that structure to be at least twice the pixel dimension in size. The cancer cell in Figure 2 is nearly 40 microns across. Of the two neighboring cells to its left, the upper contains a Golgi body, and the lower contains a mitotic apparatus in which individual chromosomes can be barely discerned. The Golgi apparatus, which is about 2 microns in diameter, is discernable at pixel resolutions of 1 micron (10x objective) or smaller; similarly, chromosomes begin to be discernable with 0.5 micron pixels.
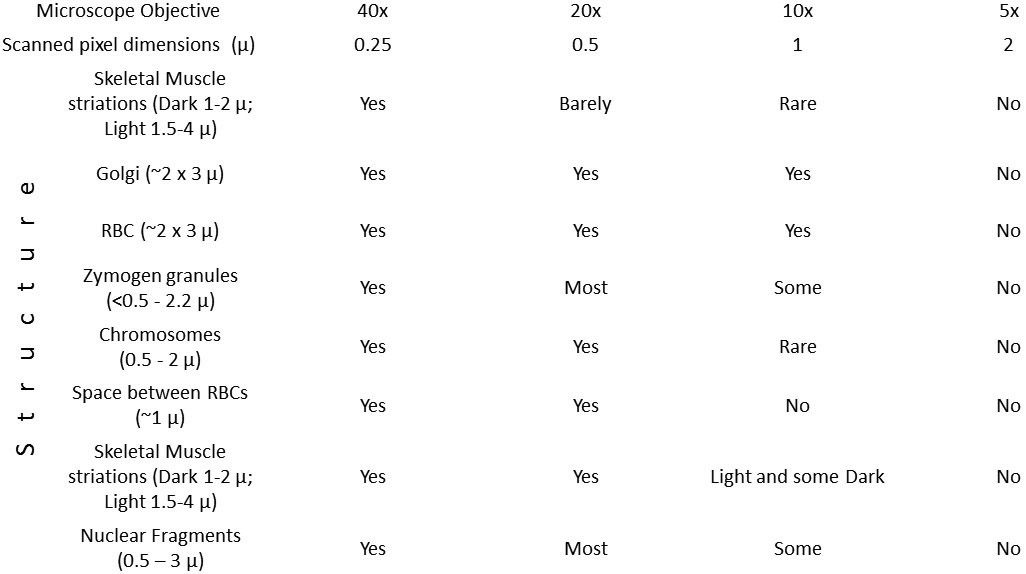
To show how the sizes of specific anatomic structures determine the pixel sizes required to visualize them for common structures, we tabulated the sizes of structures as measured at bio-atlas.psu.edu using a ruler tool (different forms of which are activated by shift-R) in various cell types of the zebrafish and whether or not they are visible at each of several powers represented on our web site (Table 1). At least 20 measurements were made of each structure to provide the sizes listed, and at least 20 structures were examined in the way illustrated in Figure 2, at each power, to confirm the tabulated result. As predicted, each structure became visible when the pixels were ½ the size of the structure.
Table 1.
Structures are visible when the pixel size is half of their size.
 |
We used a simulated cell of similar dimensions to that in Figure 2 to illustrate how histological slices can misrepresent microanatomy (Figure 3). Adjacent histological slices in the perpendicular plane of about 5 micron thickness are represented by rectangles labeled 1, 2, 3 and 4. Such sections can seriously misrepresent the cell, particularly when the cell is greater than the slice thickness. Slice 1 would include a nucleus of the correct diameter, though in only one plane. Slice 2 contains only an edge of the nucleus, making it look smaller than in reality, and would be less darkly stained than a full-thickness slice of nucleus. Slices 3 and 4 are misleading with respect to the anatomy of the cell because slice 3 shows no nucleus, and slice 4 shows only a fraction of the cytoplasm of the cell, again with no nucleus.
Figure 3. Histology misrepresents the microanatomy of large cells.

The simulated large cell is modeled after that shown in Figure 2, Five-micron thick sections typical of histology yield strikingly different cell representations, including dimensions of cytoplasm and nucleus, and DNA staining, a depending upon the plane of section.
Sectioning artifacts, represented by large linear spaces between tissue planes, are generally worse with edematous tissue, and are caused by the need to float tissue sections on water prior to mounting them on glass slides. During that floatation step, different tissue types absorb water at different rates. Weak connections between different parts of the tissue, as encountered in damaged or edematous tissue, cause spaces to form that are larger than in the original tissue. This artifact would be minimized by study of the sample intact rather than after sectioning. Other artifacts associated with histology include the floating of fragments over each other and the loss of loose tissue fragments that float away from the specimen.
Overall, what we have learned from generating a zebrafish atlas of histology that sectioning of zebrafish for histology requires special tools for orienting them well enough for reproducible characterization, that a digital way to create 3-dimensional representations of fish would be potentially far more flexible and powerful than histology due to the ability to create virtual slices and views computationally, and that pixel resolutions of 1 micron or less (corresponding to magnifications of 10x or higher at www.bio-atlas.psu.edu) are required to detect and distinguish histological features such as karyorrhexis and to identify specific cell types. Unfortunately, a practical form of such a tool does not yet exist.
2.3.3. Lessons from Phenotyping Zebrafish Using Histology.
From a histological mutagenesis screen.
Since histological features are so informative about disease state, we pursued a histological screen for zebrafish mutants. Based on the concept that mutations specific to tissue differentiation may only be apparent beyond early embryonic stages, i.e., during larval development, we pursued a mutagenesis screen based on histological examination of about 12 interspersed sections of families of zebrafish larvae (intervening tissue sections were saved but unstained, and every third or fourth slice was stained for histological study; the staining and examination of sections at such intervals is sometimes called “levels” in the practice of pathology). At least that many sections were studied for families of 7-day old larval zebrafish (Mohideen et al. 2003). The screen yielded 6 mutants; more may have been found with a faster and more consistent method of embedding, processing, and cutting groups of larvae.
The potential utility of volumetric data.
Volumetric data provides useful insights that histology cannot provide by itself. To illustrate this idea, consider the example of the “small eye” phenotype of one of the mutants, hht, identified by our histology screen (Mohideen et al. 2003). The small eye phenotype is evident from day 2 until the time of death between day 5 and 7, but the cellular mechanisms underlying this phenotype are not apparent by stereomicroscopy (Figure 4). In contrast, histology reveals the underlying cellular basis for the small eyes (Figure 5): At day 3, the retinal cells show extensive cell death, evident by the presence of degenerating nuclei (karyorrhexis), confirmed by both TUNEL and acridine orange staining (Mohideen et al., 2003, Lin and Cheng, unpublished). By day 5, the process of cell death is less active, and the eyes are more notable for disorganized neuropil and a paucity of mature retinal cells. Quantitative insight into the extent of cell death at different life stages would be gained with a 3-dimensional imaging method that would allow us to count the number of mature nuclei or nuclear fragments per eye. We note that the small eyes of hht are characterized by a high density of melanin pigmentation in melanophores and a retinal pigmented epithelium that has collapsed into the outer parts of the eye, greatly limiting the use of fluorescence for gaining information from about the inside of the eye.
Figure 4. Small-eye phenotype in 3dpf and 5dpf hht by stereomicroscope.

3dpf (B) and 5dpf (D) hht mutants both have “small eyes” compared to their 3dpf (A) and 5dpf (C) wild-type siblings. These views say nothing about the cellular mechanism underlying the small eye phenotype.
Figure 5. Histology distinguishes between dying and degenerated cells as causative of “small eye” phenotype.

Histologically, 3dpf hht eyes (B) contain fewer frequently apoptotic cells (smaller dark dots, B, C) compared with wild-type (A). By day 5, hht eyes are contain a combination of disorganized neuropil (arrowhead) and nuclear debris comprised of particles of larger size (E, F). Size bar, 100 μ. Boxed areas, ~25 × 25 μ.
From a histological screen of existing mutants found by stereomicroscopy.
In a simultaneous study, we tested the notion that histological detail can detect additional phenotypes in mutants already identified and characterized by stereomicroscopy by performing a histological screen of 97 mutants from the Hopkins retroviral insertional mutagenesis screen at MIT (Amsterdam et al. 2004). Mutants were chosen on the basis of survival until at least 5 days of development to allow for temporal phenotypic scoring and analysis. Families of mutants were studied histologically, and semi-quantitatively scored over four days by one observer (Thomas, 2009).
The relative efficiency of detecting phenotypes in different organs by stereomicroscopy vs. histology is summarized in Table 2. The mutant phenotypes of some organ systems, including kidney, pancreas, integument, fin, and brain, were almost undetectable by stereomicroscopy, but readily detected by histology. Large numbers of phenotypes were completely missed by stereomicroscopy, including 81, 48, and 66 phenotypes for kidney, integument, and pancreas, respectively. The relative insensitivity of stereomicroscopy as compared with histology was not as severe in other organs. The most commonly affected organ was the eye, where 93/97, or nearly 97% of mutants were affected, for which 21/93, or nearly a quarter (23%) of phenotypes detected using histology were not detected by stereomicroscopy. It was striking that 86% of the mutations were pleiotropic, with only 11/97, or 11%, of mutants showing a phenotype in only one organ system. This high frequency of pleiotropy suggests that comprehensive phenotyping will be required to accurately determine the range of functional effects of any given experimental variable.
Table 2.
Histology-based phenotyping of stained tissue sections is >3-fold more sensitive than stereomicroscopy of unstained live fish.
| Organ system: | Kidney | Integument | Pancreas | Fin | Brain | Pharynx | Eye | Liver | Gut | TOTAL | |
|---|---|---|---|---|---|---|---|---|---|---|---|
| # of phenotypes in 97 mutants in indicated organ @ 5 dpf | Stereomicroscopy | 0 | 0 | 1 | 4 | 8 | 21 | 72 | 52 | 58 | 216 |
| Histology | 81 | 48 | 67 | 81 | 87 | 77 | 93 | 79 | 91 | 704 | |
| Percent of Histological Phenotypes detected by Stereomicroscopy | 0 | 0 | ~1 | 5 | 59 | 27 | 77 | 66 | 64 | 31 | |
Histology allowed us to achieve a greater granularity of phenotyping than was possible by stereomicroscopy, since we were able to catalogue ontologically defined structures as small as cells that cannot be visualized by stereomicroscopy, along with type and degree of change (see Thomas 2009 for details). Obtaining these data took one student two full years, long enough to make it necessary to find ways to speed up the process. One possibility is to develop imaging and image analysis tools to accomplish some of this phenotyping computationally (Canada 2008; Canada et al. 2006, 2007, 2011). A summary of some of the issues faced during histological phenotyping with suggested solutions is provided in Table 3.
Table 3.
Observations from histological studies of zebrafish mutants and suggested next steps for microanatomical phenotyping.
| Observation or problem | Solution for Microanatomical Phenomics |
|---|---|
| Histology is >3-fold more sensitive for detecting phenotypes than those stereomicroscopy | Retain cellular resolution for phenotyping, using pixel dimensions of 1 μ or less) |
| Most developmental mutations are pleiotropic, affecting multiple cell types and organs | Develop whole-body, pan-cellular phenotyping |
| Patterns of tissue pleiotropy detected by histology are characteristic of sets of functionally related genes and classes of drugs | Utilize tissue phenotyping with the sensitivity of histology |
| Quantitative analysis adds power to phenotypic analysis | Develop and utilize quantitative analysis of phenotypes that are presently descriptive |
| Time course adds a useful dimension to phenotype | Score mutants and treated animals at more than one time point |
| Histology is impractical for large-scale microanatomic phenotyping | Develop a more practical form of microanatomic phenotyping |
| Some structures such as nuclei and large cells are frequently cut, leaving an unknown proportion of the structure in the section | Develop a 3D form of histology that has cellular resolutions so that the full volume of structures can be determined |
| Many microanatomical phenotypes are volumetric, and therefore only indirectly measurable by histology | Measure phenotypes from 3D image files with histological resolution |
| The study of tissue scans at various microscope objective resolutions, such as those at bio-atlas.psu.edu, allow the identification of some cell types at 5x and most cell types at about 10x magnification or better (corresponding to pixel sizes of 2 micron and 1 micron, respectively). | Perform 3D scans at voxel resolutions of 1 micron or better. |
| Floating of sections on water prior to mounting on the slide causes distortion or loss of fragments of tissue sections. | Image intact samples in 3D after they are mounted in solid media such as paraffin or plastic so that there is no physical cutting of the tissue |
| Sampling error and limited control over sample orientation and distortion contribute to difficulties in phenotyping | Utilize full-volume, whole-body imaging, and registration of individual organisms to standard anatomy |
| Histopathological studies in high throughput will require automation to achieve scale | Utilize automation such as robotic loading and automated sample tracking for high throughput |
| Small round zebrafish nuclei are about 4 microns in diameter; some elongated nuclei are only about 2 microns in diameter; many vacuoles and chromosomes are about 1 micron in diameter. | Ensure that the 3D imaging yields voxel sizes of 1 micron or smaller; 0.5 micron voxels may be ideal |
| Interpretative variation between users limits the large-scale use of manual phenotyping | Develop and utilize computational tools for phenotyping to minimize manual phenotyping |
| Computational tools for microanatomic phenotyping are currently very limited | Develop computational tools for phenotyping, and utilize machine learning |
| Accessibility to data is required for validation and reinterpretation | Implement web-based sharing of whole-organism, raw image data |
In summary, histological studies of zebrafish showed that it is challenging but possible to screen for mutants using histology, that histology provides greater sensitivity for detection of phenotypes than stereomicroscopy, and that weaknesses to address include histology’s poor control over sample orientation, insensitivity to macroscopic changes such as misshapen skeletons, and an inability to provide accurate volumetric data about cellular phenotype or tissue structure. Three-dimensional imaging may address some of these problems, and we expect it to make increasingly important contributions to phenome projects as technologies (reviewed by Cheng et al. 2011) improve beyond the already powerful methods in existence today (e.g. Johnson et al 2002; Johnson et al. 2006; Badea et al. 2012).
3. WHOLE-ORGANISM CELLULAR PATHOLOGY AS A SYSTEMS APPROACH TO PHENOMICS
3.1. The Need for Whole-organism Cellular Pathology.
Our consideration of the benefits of incorporating cellular pathology into phenotypic screens points to a need for whole-organism 3-dimensional imaging at a high resolution. A list of features for ideal whole-animal cellular pathology is suggested in Table 4. A survey of available technologies suggests that X-ray micro-computed tomography (microCT) has the potential to approach such a 3D imaging ideal for small model organisms (reviewed by Cheng et al. 2012). Both cone-beam and parallel-beam MicroCT work by Metscher has shown great promise in the use of fixed, metal-stained samples for visualizing the cellular structure of vertebrate and invertebrate species (Metscher 2009a; Metscher 2009b; Metscher & Müller 2011). Cytological resolutions that are sufficient for pathology have yet to be achieved by commercial machines, most of which use cone-beam geometry. Some examples of what can currently be achieved using cone-beam geometry are shown in Figures 6, 7, and 8. Early images of a juvenile zebrafish using a Skyscan machine produced images in which organ systems could be readily identified by in which few individual cell types could be distinguished (Figure 6). Imaging of a larva at nominal voxel resolutions of 0.87 microns on the Xradia XRM500 yielded images in which individual cell types can be distinguished, but cellular state cannot be readily assessed (Figure 7). These images require long (~10 hours or more) scans and cannot produce high-resolution images of the full organism in one operation. Individual nuclei are visible in these images, but the polychromatic x-rays from the tube source blur the edges enough that cellular state is difficult to ascertain. Synchrotron-based microCT can achieve greater effective resolution than commercial microCT due to the nature of the tube source and system geometry, and has potential for high-throughput as a result of its greater flux. Synchrotron implementations are not yet suitable for higher-throughput whole-animal imaging due to a relatively small field of view, a need to retain the flexibility to image a wide array of samples including rocks, soil samples, and materials, and a lack of capability to efficiently create image whole, long specimens in a single operation. Fusing blocks of images is achievable but micron-scale misalignments during sample movement occur, which distort the “joints” between images. Those distortions are not as important for other sample types such as stone that may require lower resolution, but have a significant, potentially negative, impact on phenotyping of biological organisms because distortions that coincide with small anatomical structures may affect the phenotyping of a substantial proportion of those structures.
Table 4.
Ideal whole-animal cellular pathology
| Quantitation of every phenotype |
| Identification of every cell type (pan-cellular imaging) |
| 3-dimensional imaging with isotropic voxels |
| Detection of organism-scale phenotypes |
| Size, shape, and volume |
| Appendage characteristics |
| Organ statistics |
| Skeletal or Physical defects |
| Detection of cytological abnormalities |
| Nuclear/cytoplasmic ratio |
| Swelling (lower density) |
| Changes in chromatin pattern in the nucleus |
| Intracellular inclusions (cytoplasmic or nuclear) |
| Detection of changes in cellular pattern |
| Position |
| Proportionality |
| Volume |
| Circularity |
| Spacing |
| Invasion |
| Number |
| Detection of abnormal structures |
| Abscesses or cysts |
| Bacteria or other pathogens |
| Parasites |
| Intracellular or extracellular deposits |
Figure 6. Commercial MicroCT of a wild-type 35 dpf juvenile zebrafish.

3D rendering of cone-beam microCT image scanned in a Skyscan 1172 from VGStudioMax. This near mid-sagittal section mimics what one would see if the physical fish were cut in this plane. The mucosal folds of the inner surface of the right side of the air bladder (AB), gut, and pharynx (P) are visible in this view, as are a number of organs including the olfactory epithelium (O), brain (Br), gills, heart (H), vertebrae (V), gut, and muscle (M), but only rare nuclei and individual cells are discernable.
Figure 7. Nominal 0.87 micron voxel resolution, cone-beam MicroCT slices of a wild-type 4 dpf larval zebrafish in the coronal (A), sagittal (B) and transverse (C) planes showing nearly histological resolution.

In these Xradia Versa XRM500 microCT images were created using VGStudioMax, essentially all tissues and nuclei are visible, though nuclear and other cellular detail is not. Discernable structures include the lens (L), retina (R), brain (Br), pharynx (P), gut, liver (L), and fin (F), yolk (Y), cartilage (C), notocord (N), heart (H), air bladder (AB), and cartilage (C). Notably, cellular boundaries between the cells of the notocord are apparent. The quality of these images allows the identification of most organs, but a histological level of characterization of cellular state will require greater usable resolution.
Figure 8. Slice of a phosphotungstic acid-stained wild-type juvenile larval zebrafish eye imaged in a VersaXRM500 at a nominal voxel resolution of 1.15 micron voxel resolution shows nearly histological resolution.
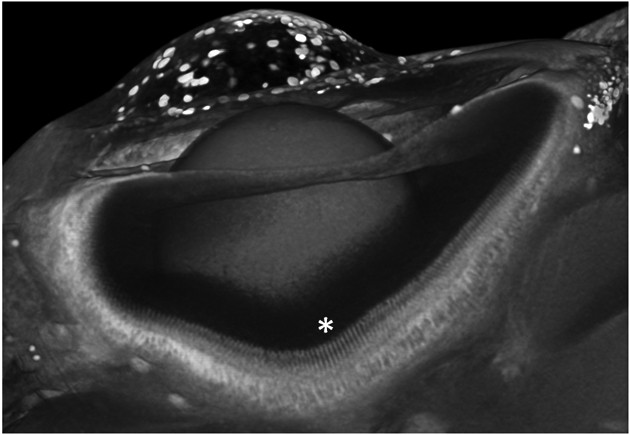
Patterns of the innermost layer of retinal cells are apparent (*), but photoreceptors, which are 4 microns in width, are not readily discerned. 3D rendering created using VGStudioMax.
Overall, existing work indicates that neither commercial nor synchrotron sources are yet practical for whole-organism cellular pathology, but adjustments in the travel distance and precision of actuators, field of view, other aspects of x-ray optics, sample handling, and digital workflow will yield increases in both resolution and throughput that may make it possible for either geometry to contribute to large-scale phenomics. We are pursuing the use of such improvements.
3.2. Whole Organism Cellular Pathology Using Zebrafish.
Multiple factors indicate that the zebrafish is a good model for developing whole organism cellular pathology. An image representing an organism’s width is distributed across a chip of fixed pixel dimension during imaging, determining resolution. For example, a 2 cm sample imaged across a 2k x 2k chip yields a 10 micron pixel; in contrast, a 2 mm sample with the same chip yields a 1 micron pixel. The small size of zebrafish larvae (< 2 mm diameter) theoretically enables this resolution. The use of a chip with more pixels can increase resolution and/or field-of-view, but smaller pixel size in larger arrays are associated with lower quantum efficiency, lower signal to noise ratio, and slower data output. The zebrafish is a well-characterized vertebrate model; about 70% of human genes have at least one obvious zebrafish orthologue (Howe et al. 2013), suggesting great potential to study vertebrate problems related to human biology. Other advantages of the zebrafish include its well-established genome editing tools, including knock-in technology (among the latest in this hot field is Hoshijima et al. 2016), and for chemical phenomics, the ability to do rapid chemical screening using multi-well plates. These considerations led to our choice of zebrafish, and similar arguments can be made for the other popular model fish, the medaka.
4. CONCLUSIONS
Cellular pathology is of critical value in diagnostic anatomic pathology, which tells us that it would be highly beneficial to incorporate its value into large-scale phenotypic analysis. There has unfortunately been no practical way to assess cellular pathology in large-scale, whole-animal screens. We have noted that the range of cell types and organ systems that may be affected by any given variable cannot be predicted, which ideally necessitates the screening of every cell within its tissue context in whole, intact organisms. Furthermore, despite histology’s status as the gold standard today for tissue phenotyping of human disease, and large superiority over stereomicroscopy in terms of ability to detect mutant microanatomical phenotypes in the zebrafish, its technical demands and limitations make it sub-optimal for higher-throughput analysis. Its poor ability to represent 3-dimensional phenotypes such as skeletal or vascular abnormalities, and poor ability to make to accurate volumetric measurements at the cellular level, motivate the development of a tool that has histology’s power and adds the ability to perform volumetric analyses at cellular resolution.
The number of experimental variables number in the tens of thousands for both genes and chemicals, making rapid, quantitative analysis critical for comparing phenotypes. Considering the high resolution and whole-animal scale we desire, high-throughput imaging and image processing should be expected to be a form of “big data” analysis. The work described herein has allowed us to specify some of the ideal features that would be required for a 3-dimensional microanatomical phenotyping. As described, these needs can potentially be addressed using x-ray based, micron-scale tomography, or microCT, using fixed and stained whole organisms. We have noted how the similarity of its genes to humans and its diminutive size have made the zebrafish an ideal vertebrate model for customizing microCT’s for higher-throughput whole-body cellular pathology for phenomics.
We expect the proposed micro-CT tools to provide knowledge important to genetic, toxicological, and disease phenomics. As reviewed here and by others, a majority of the discussion around phenomics seems to be currently motivated by the study of gene function and drug screening. It is therefore worth noting the importance of applying cellular pathology to environmental toxicology. While most toxicological studies study the effect of one potential toxicant at a time, it is worth noting that the growing abundance of chemicals and nanoproducts that are useful or potentially useful for societal functions such as agriculture, energy production, and manufacture has created a growing risk of combinatorial toxicity. For example, a significant, but unknown proportion of the global collapse in bee populations, upon which much of agriculture is dependent, is associated with multiple, rather than single environmental toxicants (Mullin et al. 2010; Krupke et al. 2012; Pettis et al. 2013). Since healthy colonies exist with single toxicants, the combination of toxicants is now thought to weaken the ability of bee colonies to resist naturally-occurring pathogens. We know that histology-based cellular pathology is necessary for identifying infectious agents. Infectious diseases, whether associated with global climate change or combinatorial environmental toxicity, can therefore be expected to be associated with patterns of cellular and tissue architectural change that are directly involved in disease pathogenesis.
In sum, we have described the vision of three-dimensional, cellular pathology-based phenomics. We expect this approach to contribute towards a better understanding of biology, safer and more economical drug development, and the prevention and elucidation of mechanisms of new chemical and infectious threats to global societies. Widespread understanding and acceptance of the proposed infrastructures proposed here will require broader discussion, but with recent advancements in the relevant technologies, we have every reason to believe that credible infrastructures for a phenomics based on whole-organism cellular pathology can be created within a decade.
References
- Abbe E (1873) Beiträge zur Theorie des Mikroskops und der mikroskopischen Wahrnehmung. Archiv für mikroskopische Anatomie 9.1: 413–418. [Google Scholar]
- Abbe Ernst (1881) “VII.—On the Estimation of Aperture in the Microscope.” Journal of the Royal Microscopical Society 1.3: 388–423. [Google Scholar]
- Abbe Ernst (1883) “XV.—The Relation of Aperture and Power in the Microscope (continued).” Journal of the Royal Microscopical Society 3.6: 790–812. [Google Scholar]
- Amsterdam A, Nissen RM, Sun Z, Swindell EC, Farrington S, & Hopkins N (2004). Identification of 315 genes essential for early zebrafish development. Proceedings of the National Academy of Sciences of the United States of America, 101(35), 12792–12797. [DOI] [PMC free article] [PubMed] [Google Scholar]
- Austin CP, Battey JF, Bradley A, Bucan M, Capecchi M, Collins FS, Dove WF, Duyk G, Dymecki S, Eppig JT Grieder FB, Hinz N, Hicks G, Insel TR, Joyner A, Koller BH, Lloyd KCK, Magnuson T, Moore MW, Nagy A, Pollock JD, Roses AD, Sands AT, Seed B, Skarnes WC, Snoddy J, Soriano P, Stewart DJ, Stewart F, Stillman B, Varmus H, Varticovski L, Verma IM, Vogt TF, von Melchner H, Witkowski J, Woychick RP, Wurst W, Yancopoulos GD, Young SG, Zambrowitz B (2004) The knockout mouse project. Nature Genetics 36(9):921–924. [DOI] [PMC free article] [PubMed] [Google Scholar]
- Badea A, Gewalt S, Avants BB, Cook JJ, Johnson GA. Quantitative mouse brain phenotyping based on single and multispectral MR protocols. Neuroimage. 2012. November 15;63(3):1633–45. [DOI] [PMC free article] [PubMed] [Google Scholar]
- Beckwith LG, Moore JL, Tsao-Wu GS, Harshbarger JC, and Cheng KC (2000) Ethylnitrosourea induces neoplasms in zebrafish (Danio rerio), Lab Invest. 80: 379–385. [DOI] [PubMed] [Google Scholar]
- Beer John Joseph. “The emergence of the German dye industry.” (1959). [Google Scholar]
- Bhowmick NA, Neilson EG and Moses HL (2004) Stromal fibroblasts in cancer initiation and progression. Nature 432(7015):332–337. [DOI] [PMC free article] [PubMed] [Google Scholar]
- Bilder RM, Sabb FW, Cannon TD, London ED, Jentsch JD, Parker DS, Poldrack RA, Evans C and Freimer NB, 2009. Phenomics: the systematic study of phenotypes on a genome-wide scale. Neuroscience,164(1), pp.30–42. [DOI] [PMC free article] [PubMed] [Google Scholar]
- Bracegirdle B (1987) A History of Microtechnique: The evolution of the microtome and the development of tissue preparation, 2nd ed. Science Heritage, Ltd, Lincolnwood, IL. [Google Scholar]
- Canada BA (2010). Augmentation of the Zebrafish Phenomic Landscape by Histological Analysis and Content-Based Image Retrieval (Doctoral dissertation). Retrieved from the Penn State Electronic Theses and Dissertations Database. [Google Scholar]
- Canada BA, Cheng KC, Wang JZ. QCHARM: A Novel Computational and Scientific Visualization Framework for Facilitating Discovery and Improving Diagnostic Reliability in Medicine (2006) Proceedings of the American Medical Informatics Association Annual Symposium, pp. 870. [PMC free article] [PubMed] [Google Scholar]
- Canada BA, Thomas GK, Cheng KC* and Wang JZ* (2007) Automated segmentation and classification of zebrafish histology images for high-throughput phenotyping. Proceedings of the Third IEEE-NIH Life Science Systems and Applications Workshop (LISSA 2007), pp. 245–248 *equal contributors. [Google Scholar]
- Canada BA, Thomas GK, Cheng KC*, Wang JZ* (2011) SHIRAZ: An Automated Histology Image Annotation System for Zebrafish Phenomics, International Journal of Multimedia Tools and Applications (Special Issue on Hot Topics in Multimedia) 51:401–440. *equal contributors. [DOI] [PMC free article] [PubMed] [Google Scholar]
- Cheng KC (2004). A life-span atlas for the zebrafish. Zebrafish, 1(2), 69–69. [DOI] [PubMed] [Google Scholar]
- Cheng KC, Xin X, Clark DP, and La Riviere P (2011). Whole-animal imaging, gene function, and the Zebrafish Phenome Project. Curr. Opin. Genet. Dev. 21, 620–629. [DOI] [PMC free article] [PubMed] [Google Scholar]
- Chung K & Diesseroth K (2013) CLARITY for mapping the nervous system. Nature methods 106:508–513 [DOI] [PubMed] [Google Scholar]
- Cotran RS, Kumar V, Collins T, & Robbins SL (1999). Robbins pathologic basis of disease. [Google Scholar]
- Davis AB (1979) Book Review: Slides and Microtomes, Science 204(4394): 748–749 [DOI] [PubMed] [Google Scholar]; DOI: 10.1126/science.204.4394.748 [DOI] [Google Scholar]
- Du Trochet MH, 1824. Recherches anatomiques et physiologiques sur la structure intime des animaux et des végétaux, et sur leur motilité. JB Baillière. [PMC free article] [PubMed] [Google Scholar]
- Gerlai R (2002). Phenomics: fiction or the future? Trends Neurosci. 25, 506–509. [DOI] [PubMed] [Google Scholar]
- Gordon GB, Spielberg SP, Blake DA, & Balasubramanian V (1981). Thalidomide teratogenesis: evidence for a toxic arene oxide metabolite. Proceedings of the National Academy of Sciences, USA. 78(4), 2545–2548. [DOI] [PMC free article] [PubMed] [Google Scholar]
- Grubb SC, Maddatu TP, Bult CJ, Bogue MA. Mouse phenome database. Nucleic acids research. 2009. January 1;37(suppl 1):D720–30. [DOI] [PMC free article] [PubMed] [Google Scholar]
- Hancock JM (2014). Phenomics (CRC Press; ). [Google Scholar]
- Hill J (1770) The construction of timber, from its early growth; explained by the microscope, and proved from experiments, in a great variety of kinds, London, printed for the author. [Google Scholar]
- Hoshijima K, Jurynec MJ, & Grunwald DJ (2016) Precise editing of the zebrafish genome made simple and efficient. Developmental cell, 36(6):654–667. [DOI] [PMC free article] [PubMed] [Google Scholar]
- Houle D (2010). Numbering the hairs on our heads: The shared challenge and promise of phenomics. Proc. Natl. Acad. Sci. 107, 1793–1799. [DOI] [PMC free article] [PubMed] [Google Scholar]
- Houle D, Govindaraju DR, and Omholt S (2010). Phenomics: the next challenge. Nat. Rev. Genet. 11, 855–866. [DOI] [PubMed] [Google Scholar]
- Howe K, Clark MD, Torroja CF, Torrance J, Berthelot C, Muffato M, Collins JE, Humphray S, McLaren K, Matthews L, McLaren S. et al. (2013) The zebrafish reference genome sequence and its relationship to the human genome. Nature 496(7446):498–503. [DOI] [PMC free article] [PubMed] [Google Scholar]
- Johnson GA, Cofer GP, Gewalt SL, Hedlund LW. (2002) Morphologic phenotyping with MR microscopy: The visible mouse 1. Radiology 222(3):789–93. [DOI] [PubMed] [Google Scholar]
- Johnson JT, Hansen MS, Wu I, Healy LJ, Johnson CR, Jones GM, Capecchi MR and Keller C, 2006. Virtual histology of transgenic mouse embryos for high-throughput phenotyping. PLoS Genet, 2(4): e61. [DOI] [PMC free article] [PubMed] [Google Scholar]
- Kahraman A, Avramov A, Nashev LG, Popov D, Ternes R, Pohlenz HD, & Weiss B (2005). PhenomicDB: a multi-species genotype/phenotype database for comparative phenomics. Bioinformatics, 21(3), 418–420. [DOI] [PubMed] [Google Scholar]
- Kalluri R, & Zeisberg M (2006). Fibroblasts in cancer. Nature Reviews Cancer 6(5): 392–401. [DOI] [PubMed] [Google Scholar]
- Krupke CH, Hunt GJ, Eitzer BD, Andino G, & Given K (2012). Multiple routes of pesticide exposure for honey bees living near agricultural fields. PLoS one, 7(1), e29268. [DOI] [PMC free article] [PubMed] [Google Scholar]
- La Riviere PJ, Clark D, Rojek A, Vargas P, Xiao X, DeCarlo F, Kindlmann G, Cheng KC (2010) Optimizing synchrotron micro-CT for high-throughput phenotyping of zebrafish. Developments in X-ray Tomography VII, Stock SR, ed., Proc. of SPIE 7804M: 1–8. [Google Scholar]
- Landman BA, Asman AJ, Scoggins AG, Bogovic JA, Stein JA, Prince JL. (2012) Foibles, follies, and fusion: Web-based collaboration for medical image labeling. NeuroImage. January 2;59(1):530–9. [DOI] [PMC free article] [PubMed] [Google Scholar]
- Li Y, Klena NT, Gabriel GC, Liu X, Kim AJ, Lemke K, Chen Y, Chatterjee B, Devine W, Damerla RR Chang C, Yagi H, San Agustin JT, Thahir M, Anderton S, Lawhead C, Vescovi A, Pratt H, Morgan J, Haynes L, Smith CL, Eppig JT, Reingoldt L, Francis R, Leatherbury L, Ganapathiraju MK, Tobita K, Pazour GL, & Lo CW (2015) Global genetic analysis in mice unveils central role for cilia in congenital heart disease. Nature doi: 10.1038/nature14269. [DOI] [PMC free article] [PubMed] [Google Scholar]
- Lussier YA, Liu Y (2007) Computational Approaches to Phenotyping, Proc Am Thoracic Soc 4(1): 18–25. [DOI] [PMC free article] [PubMed] [Google Scholar]
- Mahner M, and Kary M (1997). What Exactly Are Genomes, Genotypes and Phenotypes? And What About Phenomes? J. Theor. Biol. 186, 55–63. [DOI] [PubMed] [Google Scholar]
- Metscher BD (2009a) MicroCT for comparative morphology: simple staining methods allow high-contrast 3D imaging of diverse non-mineralized animal tissues. BMC physiology, 9(1): 1. [DOI] [PMC free article] [PubMed] [Google Scholar]
- Metscher BD (2009b) MicroCT for developmental biology: A versatile tool for high‐contrast 3D imaging at histological resolutions. Developmental Dynamics, 238(3), pp.632–640. [DOI] [PubMed] [Google Scholar]
- Metscher BD and Müller GB, 2011. MicroCT for molecular imaging: Quantitative visualization of complete three‐dimensional distributions of gene products in embryonic limbs. Developmental Dynamics, 240(10), pp.2301–2308. [DOI] [PubMed] [Google Scholar]
- Mohideen M-APK, Beckwith LG, Tsao-Wu GS, Moore JL, Wong ACC, Chinoy MR, Cheng KC (2003) Histology-based screen for zebrafish mutants with abnormal cell differentiation. Developmental Dynamics 228:414–423. [DOI] [PubMed] [Google Scholar]
- Moore JL, Aros M, Steudel KG, Cheng KC (2002) Fixation and decalcification of adult zebrafish for histological, immunocytochemical, and genotypic analysis, Biotechniques, 32:296–298 [DOI] [PubMed] [Google Scholar]
- Moore JL, Rush LM, Breneman C, Cheng KC (2006) Zebrafish genomic instability mutants and cancer susceptibility. Genetics 174:585–600 [DOI] [PMC free article] [PubMed] [Google Scholar]
- Mullin CA, Frazier M, Frazier JL, Ashcraft S, Simonds R, & Pettis JS (2010) High levels of miticides and agrochemicals in North American apiaries: implications for honey bee health. PLoS one, 5(3), e9754. [DOI] [PMC free article] [PubMed] [Google Scholar]
- Pettis JS, Lichtenberg EM, Andree M, Stitzinger J, & Rose R (2013). Crop pollination exposes honey bees to pesticides which alters their susceptibility to the gut pathogen Nosema ceranae. PLoS One, 8(7), e70182. [DOI] [PMC free article] [PubMed] [Google Scholar]
- Pantanowitz L, Valenstein PN, Evans AJ, Kaplan KJ, Pfeifer JD, Wilbur DC, Collins LC, Colgan TJ. (2011) Review of the current state of whole slide imaging in pathology. J Pathol Inform 2:36 http://www.jpathinformatics.org/text.asp?2011/2/1/36/83746 [DOI] [PMC free article] [PubMed] [Google Scholar]
- Poole WH (1875) A double staining with haematoxylin and aniline. Quart. Jour. Micr. Sci. NS, 15:375–377. [Google Scholar]
- Rennekamp AJ, and Peterson RT (2015). 15 years of zebrafish chemical screening. Curr. Opin. Chem. Biol. 24, 58–70. [DOI] [PMC free article] [PubMed] [Google Scholar]
- Sabaliauskas NA, Foutz CA, Mest JR, Budgeon LR, Sidor A, Gershenson J, Joshi S, and Cheng KC (2006) High-throughput zebrafish histology. Methods 39:246–254. [DOI] [PubMed] [Google Scholar]
- Schilling CH, Edwards JS, and Palsson BO (1999). Toward Metabolic Phenomics: Analysis of Genomic Data Using Flux Balances. Biotechnol. Prog. 15, 288–295. [DOI] [PubMed] [Google Scholar]
- Schleiden MJ (1838) Beitrage zue Phytogenesis. Archiv für Anatomie, Physiologie und Wissenschaftliche Medicin, 13:137–176. [Google Scholar]
- Schwann T (1839) Mikroskopische Untersuchungen über die Übereinstimmung in der Struktur und dem Wachstum der Tiere und Pflanzen In Klassische Schriften zur Zellenlehre (2003). Jahn I, editor. Wissenschaftlicher Verlag Harri Deutschland GmbH, Frankfurt am Main. [Google Scholar]
- Streisinger G (1984) Attainment of miminal biological variability and measurements of genotoxicity: production of homozygous diploid zebrafish. Natl. Cancer Inst. Monogr. 65:53–58. [PubMed] [Google Scholar]
- Thomas GK (2009). A molecular and systems biology analysis of pleiotropic vertebrate phenotypes (Doctoral dissertation). Retrieved from the Penn State Electronic Theses and Dissertations Database. [Google Scholar]
- Travis AS, Hornix WJ, Bud R, & Homburg E (1992). The emergence of research laboratories in the dyestuffs industry, 1870–1900. The British journal for the history of science, 25(01):91–111. [Google Scholar]
- Tsao-Wu GS, Weber CH, Budgeon LR, and Cheng KC (1998) Agarose embedded tissue arrays for histological and genetic analysis, Biotechniques 25:614–618 [DOI] [PubMed] [Google Scholar]
- Vallee BL and Wacker WE (1963) Medical Biology: A Perspective. JAMA 184(6):485–489. [DOI] [PubMed] [Google Scholar]
- Virchow R (1855). Cellular-pathologie. Virchows Archiv, 8(1):3–39. [Google Scholar]
- Virchow R (1858) Die Cellular Pathologie. Berlin: August Hirschwald. [Google Scholar]
- Vogel W (2012) Glass chemistry. Springer Science & Business Media. [Google Scholar]
- Wright Nicholas A., and Poulsom Richard. (2012) Omnis cellula e cellula revisited: cell biology as the foundation of pathology. J Pathol 226: 145–147. [DOI] [PubMed] [Google Scholar]
- Yang W, Duan L, Chen G, Xiong L, and Liu Q (2013). Plant phenomics and high-throughput phenotyping: accelerating rice functional genomics using multidisciplinary technologies. Curr. Opin. Plant Biol. 16:180–187. [DOI] [PubMed] [Google Scholar]
- Zbuk KM, and Eng C (2007). Cancer phenomics: RET and PTEN as illustrative models. Nat. Rev. Cancer 7:35–45. [DOI] [PubMed] [Google Scholar]