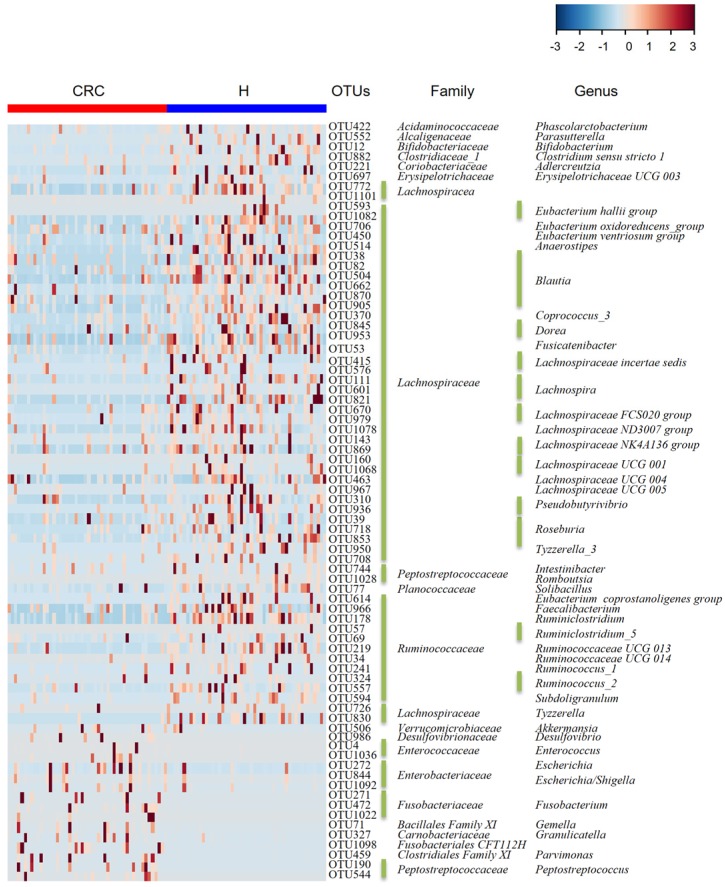
Figure 3.
Heat map of the relative abundances of the 76 OTUs (97% similarity level) that differentiate the H and CRC groups. OTUs are shown from lower abundance (in blue) to higher abundance (in red) for the z-transformed data. Data were analyzed by the Wilcoxon rank-sum test (Mann-Whitney U test). All 76 OTUs were assigned to families and genera.

