Abstract
Stem cells present in urine possess regenerative capacity to repair kidney injury. However, the unique characteristics of urinary stem cells (USC) from patients with diabetic nephropathy (d-USC) are unknown. The goal of this study was to investigate stemness properties in cell phenotype and regenerative potential of d-USC, compared to USC from healthy individuals.
Methods: Thirty-six urine samples collected from patients (n=12, age range 60-75 years) with diabetic nephropathy (stages 3-4 stage chronic kidney disease [CKD]) were compared with 30 urine samples from healthy age-matched donors (n=10, age range 60-74 years).
Results: There were approximately six times as many cells in urine samples from patients with diabetic nephropathy, including twice as many USC clones as healthy donors. However, approximately 70% of d-USC had weaker regenerative capacity as assessed by cell proliferation, less secretion of paracrine factors, weaker telomerase activity, and lower renal tubular epithelial differentiation potential compared to healthy controls. In addition, the levels of inflammatory factors (IL-1β and Cx43) and apoptotic markers (Caspase-3, and TUNEL) were significantly increased in d-USC compared to USC (p<0.01). Protein levels of autophagy marker (LC3-II) and mTOR signaling molecules (p-mTOR/mTOR, p-Raptor/Raptor and p-S6K1) were significantly lower in patient with diabetic nephropathy (p<0.01). Nevertheless, up to 30% of d-USC possessed similar regenerative capacity as USC from healthy donors.
Conclusions: Regenerative performance of most d-USC was significantly lower than normal controls. Understanding the specific changes in d-USC regeneration capability will help elucidate the pathobiology of diabetic nephropathy and lead to prevent USC from diabetic insults, recover the stemness function and also identify novel biomarkers to predict progression of this chronic kidney disease.
Keywords: diabetic nephropathy, urine, stem cells, renal insufficiency
Introduction
Diabetic nephropathy (DN) is a major complication of diabetes mellitus and the leading cause of end-stage renal disease in the U.S. 1. Long-term hyperglycemia causes glomerular hypertrophy, podocyte loss, inflammatory cell infiltration, basement membrane thickening, accumulation of extracellular matrix or expansion of mesangial matrix, glomerular sclerosis, and tubular atrophy and interstitial fibrosis, eventually leading to kidney failure 2, 3. Histopathology of kidney biopsies and serum creatinine measurements are the most commonly used tools to evaluate past, but not active, kidney damage. The accurate assessment of ongoing kidney damage is difficult. The lack of specific and sensitive predictive biomarkers hampers timely treatment for DN. The discovery of differentially expressed proteins associated with DN is critical to increasing our understanding of DN and may lead to the identification of biomarkers that may be useful in the study and monitoring of chronic kidney diseases. Furthermore, protection or improvement of these injured stem cells would be beneficial for kidney function recovery in DN.
We previously demonstrated that kidney stem cells shed into urine could be easily isolated and cultured in vitro 4-8. These urinary stem cells or urine-derived stem cells (USC) have robust proliferative potential, paracrine effects, and multi-potential differentiation 4, 5, 7, 8. USC can be obtained simply by urine collection 5, 7, 8, avoiding the adverse events, cost, and inconvenience associated with obtaining stem cells from other parts of the body9, 10. USC have achieved similar outcomes in cell therapy compared to other mesenchymal stem cells (MSC) used in tissue regeneration in different organs such as urethra 11, urinary sphincter 12, bladder 13, cartilage 14, and in the treatment of diabetic complications, such as nephropathy 15, skin wound 16 and erectile dysfunction 17, 18. Despite significant progress, experiments using the autologous cells derived from diabetic subjects are still controversial 19. Multiple previous studies have shown that diabetes can impair essential stem cell assets in cell proliferation and differentiation function 20-24. One study reported that MSC from rats with chronic kidney disease showed premature senescence and loss of regenerative potential 20. In addition, circulating endothelial progenitor cells (EPC) were sparser and had impaired repair function in diabetic patients with vascular complications 21. Thus, it is likely that USC from patients with DN (d-USC) may have impaired proliferation and differentiation capacity; these deficiencies may contribute to podocyte loss and renal tubular impairment in DN. Thus, the goals of this study were: (1) to investigate the stemness potential, particularly regenerative function, of d-USC from patients with diabetes and stages III to IV chronic kidney disease (CKD), compared to USC from non-diabetic controls; and (2) to study the biological relevance of inflammation and oxidative stress in d-USC compared to USC from healthy control. We hypothesized that these results could be used to develop a predictive profile of impaired regenerative capacity when preparing autologous stem cells to be used in the repair of DN. In addition to comparing regenerative capacity, we studied biological factors that might explain these differences in regenerative function, with an emphasis on the m-TOR signaling pathway, apoptosis, cellular inflammatory and redox properties.
Materials and Methods
Ethics statements
This study was approved by the Wake Forest University Institutional Review Board (IRB00014033). Written informed consent was obtained from each participant using an IRB-approved form. We included patients with type 1 or 2 diabetes and CKD stages III-IV. We excluded patients with the following comorbid conditions: end-stage renal disease, urinary tract cancer, new onset diabetes after organ transplant, or a recent cardiovascular event within the 3 months prior to study initiation.
Collection of Urine Samples
Urine samples were obtained exclusively from males in this study because of the lower bacterial contamination rate in urine samples from men vs. women. We obtained 36 fresh urine samples from 12 males (age range 60-75 years, [mean ± SD] 66±4.7 years) with diabetes and stages III to IV CKD, with an estimated glomerular filtration rate between 15 and 60 ml/min/1.73m2 25. Similarly, 30 fresh urine samples were obtained from 10 heathy men (age range 60-74 years, [mean ± SD] 66±2.2 years), who served as controls. To determine the total number of cells shed into the urine and the proportion of living cells, staining was performed with trypan blue and cells were counted with a hemocytometer.
Isolation and Culture
After mid- and last stream urine was collected, samples were immediately transferred to the laboratory for isolation and culture as previously described 4. Briefly, urine samples were centrifuged at 500×g for 5 min at room temperature, and the supernatant was removed. The cell pellets were gently re-suspended and counted in mixed media, with the remaining cells plated in 24-well tissue culture plates. The medium was composed of keratinocyte-serum free medium (KSFM) (Gibco, Logan, Utah) and embryonic fibroblast medium (EFM) at a 1:1 ratio with 5% fetal bovine serum (FBS). Only colonies derived from a single USC remained, as unattached somatic cells were washed away after the medium was changed. USC clones were trypsinized and transferred into 100mm dishes when the cells reached a confluence of 70~80%. Cell morphology, population doublings (PD), and doubling time (DT) were assayed at each passage.
Cell Proliferation
Stem cells obtained from urine samples of participants with DN and healthy donors were seeded at a density of 3,000 cells/well with 100µl medium in 96-well plates. The culture medium was changed every other day. Cell proliferation was measured on days 1, 3, 5, 7, and 9 using the MTS Assay Kit (Promega, Madison, WI). Briefly, the MTS reagent was incubated with the cells in the dark at 37℃ for 1 hour. Following incubation, the absorbance was measured at 490 nm using a spectrophotometer (Molecular Devices Inc, Sunnyvale, CA). Two repeated measurements were carried out for each time point. To calculate PD and DT, cell numbers and culture time were measured at each passage from p0 until the passage at cellular senescence. PD and DT were calculated using the following formula 5:
| PD = ln (Nf/Ni)/ln2; DT=Ct/PD (Nf: Final number of cells, Ni: Initial number of cells, Ct: Culture time) |
Flow Cytometry
At p5, the cultured cells were labelled with specific anti-human mesenchymal stromal cell surface markers (CD44-PE, CD45-FITC, CD73-PE, CD90-FITC and CD105) and hematopoietic stem cell markers (CD31-PE and CD34) (BD Pharmingen™, San Diego, CA). AC133/1-PE, PE or FITC conjugated isotype control antibodies (BD™ Biosciences, San Diego, CA) were used to determine background fluorescence. Unlabeled primary antibodies were detected with PE labeled antibody to mouse IgG. After staining, the cells were analyzed using a FACS Calibur™ analytical fluorescence activated cell sorter.
Karyotype Analysis
To determine the chromosomal stability of stem cells form patients with DN, karyotype analysis was performed on d-USC and compared to USC undergoing similar analysis. Briefly, the cultured cells at p5 were treated with a hypotonic solution of 0.075% KCl and fixed with a solution of 3:1 methanol-to-acetic acid. The metaphase spread on glass slides were digested using trypsin and then stained with Giemsa to generate G bands along each chromosome. Standard cytogenetic analysis was carried out on the captured images, and karyotyping was performed using MetaSystems software (Zeiss).
Telomerase activity
To detect the changes in telomerase activity in the stem cells from 10 of 12 patients with DN and 10 healthy donors, a modified gel-telomerase repeated amplification protocol (TRAP) assay was performed. Whole cell lysates from 2×10⁵ USC at p5 were assayed for telomerase activity using the Telo TAGGG PCR ELISA kit (Roche Applied Sciences, Indianapolis, IN), according to the manufacturer's instructions. Cell extracts were prepared from immortalized telomerase-expressing human embryonic kidney cells (HEK 293 cells, American Type Culture Collection [ATCC], Manassas, VA) provided in the kit as a positive control. The difference in absorbance readings (A450nm-A690nm) obtained with the positive control was greater than 1.5 units after 20 minutes of the substrate reaction. Samples were regarded as telomerase-positive if the difference in absorbance (A450nm-A690nm) was higher than 0.2 units.
Proteome profiler array
To measure trophic factors secreted by d-USC and USC, cell culture supernatant was collected from the cells (5×10⁵ cell/well at p5) cultured with serum-free DMEM in 6-well plates in a standard incubator environment of 20% oxygen and 5% carbon dioxide at 37°C for 24 hours. The conditioned medium was analyzed using a human angiogenesis array kit (ARY007, R&D Systems, Minneapolis, MN) according to the manufacturer's instructions. Briefly, the membrane containing 55 pro-angiogenetic factors was blocked with bovine serum albumin for 1h on a rocking platform at room temperature. The membrane was then incubated with the cell culture supernatants along with detection antibody cocktail overnight on a rocking platform at 4°C. The membrane was incubated with streptavidin-horseradish peroxidase conjugate antibody and developed on X-ray film following exposure to chemiluminescent reagents. Quantitative analyses were performed using ImageJ software (http://imagej.nih.gov/ij/).
Renal Tubule Epithelial Differentiation
To evaluate the plasticity and differentiation capability of d-USC, we induced these cells to differentiate into human renal tubular epithelial cells (RPTEC). Both d-USC and USC (1,000 cells/cm2, at p5) were induced to differentiate into RPTEC for 14 days, respectively. Renal tubule epithelial differentiation media consisted of a mixture of conditioned medium collected from cultured RPTEC and USC culture medium containing 30 ng/mL epidermal growth factor (EGF, 236-EG-200, R&D Systems) in a 1:1 ratio. The differentiation medium was replaced every third day. Cell morphology was observed before and after induction. Human RPTEC (ATCC® PCS-400-010™) were cultured as a positive control.
Immunofluorescence
Both d-USC and USC at p5 were induced to differentiate into RPTEC on 8-well chamber slides (Thermo Scientific, Waltham, MA) for 14 days. Differentiated cells were evaluated by immunofluorescent staining with human RPREC markers (Na/K-ATPase, E-cadherin, AQP-1, Abcam, Cambridge, MA). The slides were mounted using anti-fade mounting media (Vector Laboratories) containing propidium iodide, and images were captured using a Leica upright microscope (DM 4000B, Germany).
Apoptosis
To evaluate the impaired d-USC, apoptosis was examined by the terminal deoxynucleotidyl transferase dUTP nick end labeling staining (TUNEL, Trevigen, Gaithersburg, MD) assay and immunoblotting of cleaved caspase 3 (#9664, Cell Signaling Technologies). TUNEL was performed on chamber slides using the TACS® 2 TdT-Fluor In Situ Apoptosis Detection Kit (4812-30-K; Trevigen, Gaithersburg, MD) according to the manufacturer's instructions. The cells were seeded at a density of 2,000 cells/cm2 on 4-well Lab-Tek® Chamber-slides. After 24 hours, TUNEL-positive cells were counted under a fluorescent microscopy by using 495nm excitation.
The number of positively stained nuclei (green) per field was determined in 10 randomly selected fields; 10 independent experiments were conducted in each group. Apoptotic index was measured as the number of apoptotic events or cell deaths divided by the number of cells present. Using the TUNEL method, we determined the proportion of cells from the initial plating that expressed markers.
Inflammatory, oxidative stress and apoptosis
We measured relative protein levels of IL-1β (Cell Signaling Technology, Danvers, MA, USA), Cx43 (Cell Signaling Technology), and nitro-tyrosine (Abcam, Cambridge, MA, USA) in d-USC and USC by Western Blot.
Western Blots
After cultured cells were harvested from the culture dish (10cm), proteins were extracted using RIPA lysis buffer (Thermo, Scientific, Rockford, IL) containing a protease/phosphatase inhibitor cocktail (Cell Signaling, Technologies). Protein extracts (20-30 µg) were run on 6-15% sodium dodecyl sulfate-polyacrylamide gels to separate the proteins. A pre-stained protein ladder (1610374, Bio-Rad) was used to monitor resolution of protein bands. After electrophoresis, the separated proteins were transferred to a nitrocellulose filter membrane (Millipore, Billerica, MA) by semi-dry transfer. Following transfer, the membrane was incubated in blocking solution (5% nonfat dry milk in TBS) for 1 h at room temperature. For protein signal analysis, the membrane was incubated overnight at 4°C with primary antibodies in 5% bovine serum albumin in TBS, subsequently rinsed with washing solution (0.1% Tween-20 in TBS) and then incubated with the appropriate diluted HRP-conjugated secondary antibody for 1 hour at room temperature. The blots were visualized with an enhanced chemiluminescence assay (Supersignal West Femto, Thermo Scientific).
Transmission Electron Microscopy
Changes in the number and morphology of autophagosomes and autophagic vacuoles in USC were determined using transmission electronic microscopy (TEM). USC at p5 were cultured as described above on 6-well plate trans-well inserts, fixed, and sectioned according to standard protocols. Briefly, the cultured cells were fixed in 2.5% glutaraldehyde, post-fixed with 1% osmium tetroxide, dehydrated in graded alcohols, embedded in Spurr's resin (Polysciences, Warrington, PA), and cut into 70-nm sections with a Reichert Ultracut E ultramicrotome. The specimens were viewed and photographed with a JEM-1400plus transmission electron microscope.
Statistical analyses
The data were expressed as the mean ± standard deviation (SD). To determine statistical significance between two groups, we used a two-tailed t-test (Graph Pad Prism 5). A p value <0.05 was considered statistically significant.
Results
Number USC Clones
Although several cell types are present in urine, USC are the only urinary cells that attach and grow in this culture system. More epithelial cells shed from the urinary tract into the urine were observed in patients with DN. The total number of cells and number of live cells per 100 ml urine significantly increased in DN patients vs. controls (p < 0.01). However, the ratio of live cells to total cells in patient urine was significantly less in DN patients than that in controls (p = 0.014) (see Table 1). Individual d-USC clones appeared in the primary culture after approximately 1 week, which was significantly longer than the time (average at 3 days) for USC clone appearance in controls (p < 0.01).
Table 1.
Total numbers of cells and USC clones in urine from healthy donors and the patients with DN
| Healthy individuals (n=10, M ±SD) | Pts. with DN (n=12, M±SD) | |
|---|---|---|
| Total no. of cells ×106 /100ml urine | 0.6 ± 0.1 | 4.3 ± 1.0* |
| Total no. of live cells ×106 /100ml urine | 0.4 ± 0.1 | 2.1 ± 0.6** |
| Live cell ratio (no. of live cells/total no. of cells) | 66.4 ± 10.9 | 50.1 ± 7.9* |
| USC initial appearance time (Days) | 4.5 ± 1.0 | 7.2 ± 2.1* |
| USC clone No. at p0/100ml urine | 7.3 ± 2.3 | 13.0 ± 3.0* |
| >p5 clone number percentage (%) | 69.2 ± 6.8 | 27.1 ± 5.9* |
| Population doubling (p1-p8) | 43.5 ± 2.1 | 28.3 ± 3.0* |
| Doubling time (hours) (p1-p5) | 25.1 ± 1.9 | 38.4 ± 2.5* |
Abbreviations: DN: diabetic nephropathy; Pts: patients; No: number
Note: */** indicating significant difference in the permeates between healthy donors and patients with DN, *p<0.01; **p<0.05
Cell morphology and proliferation
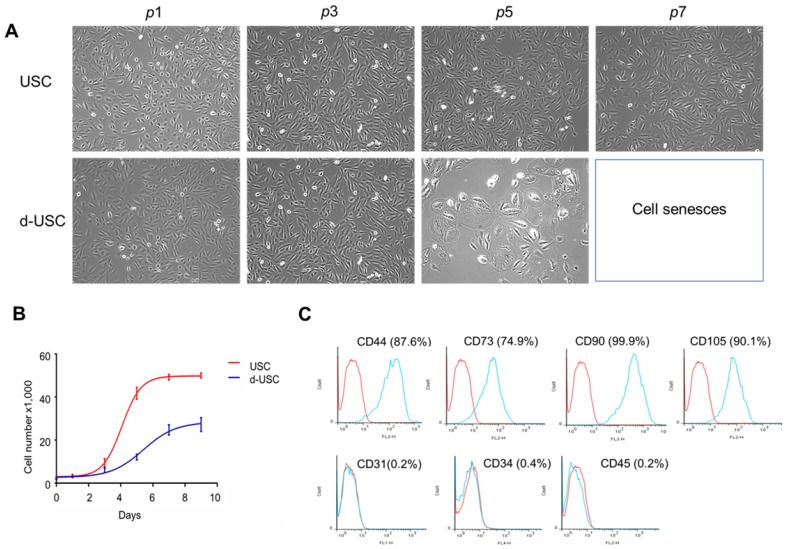
The d-USC in the early passages (p0-3) displayed a “rice grain” appearance, similar to USC. After p4, d-USC cells increased in size, with the development of more vacuoles in the cytoplasm (Figure 1A). No vacuoles were observed in the cytoplasm of USC during any passages. Although many cell clones were formed in d-USC, only 1/3 of them could be cultured to p5. In contrast, 2/3 USC clones from healthy men proliferated past p5 (Table 1). Six urine samples from 3 DN patients were contaminated by bacteria or fungi; no urine samples from heathy donors were contaminated. In addition, the cell proliferation rates of both d-USC and USC were similar at p1-3, but most d-USC proliferated significantly more slowly than USC at p4-5 (Figure 1B). Furthermore, the population doubling (PD) rate of d-USC at p1-8 was significantly shorter than USC from p1 to p8, and the doubling time (DT) of d-USC at p1-5 was significantly higher than for USC (Mean ± SD), indicating that d-USC grew significantly slower than USC (Table 1).
Figure 1.
Cell morphology, proliferation and cell surface markers of d-USC. (A) Cell morphology of d-USC was similar to that of USC at the early stage (p0 to p3), the cell size increased with more vacuoles existed in most d-USC at p5, compared to USC with uniform and small size at p7. (B) Cell proliferation remarkably decreased in d-USC at p5, compared to that in USC at p5. (C) The d-USC at p5 expressed positive for mesenchymal stromal cell markers, including CD44, CD73, CD90, and CD105, and negative for the hematopoietic stem cell markers such as CD31, CD34 and CD45, assessed by flow cytometry.
In brief, two types of urinary stem cells were identified in the urine of DN patients. Approximately 10-30% of the cells had nearly normal proliferation function and reached p8, while 70% had poor regenerative capacity. While the proportion of good quality USC was only 30%, the total number of cells in diabetic patients was 3 to 5 times that of controls, resulting in a similar absolute number of good quality cells in the diabetic and normal urines.
Cell surface marker expression
Similar to USC from healthy donors4, d-USC at p5 expressed positivity for mesenchymal stromal cell markers (i.e. CD44, CD73, CD90, CD105) and were negative for hematopoietic stem cell markers (CD31, CD34, and CD45) as assessed by flow cytometry (Figure 1C).
Karyotype Analysis and telomerase activity
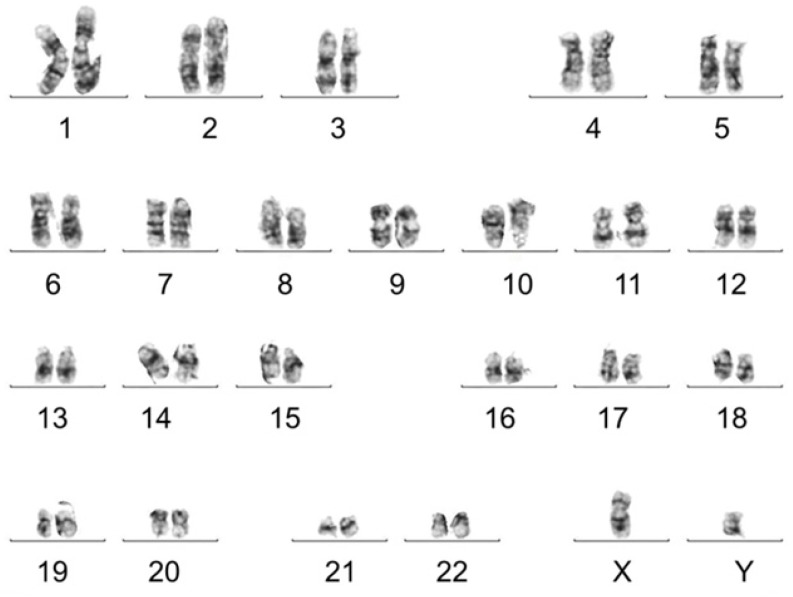
Karyotype analysis was performed to test chromosomal stability of stem cells after serial cultures. Results showed that d-USC and USC both displayed normal karyotypes, with 1 X and 1 Y chromosome and a normal diploid (2n = 46) complement of autosomes. No multiploidy or obvious chromosomal rearrangements at metaphase in d-USC at p5 were detected by Giemsa bandings (Figure 2), similar to USC 4.
Figure 2.
Normal chromosomes detected in d-USC. No multi-ploidy or obvious chromosomal rearrangements at metaphase were detected in d-USC at p5 by Giemsa band karyogamy.
While telomerase activity levels in all d-USC and USC were positive (> 0.2 units), the mean level of telomerase activity in d-USC was significantly lower than in USC (p < 0.01, n = 10). The relatively high telomerase activity detected in 3 (D2, D9, D10) of the 10 d-USC samples was similar to lower levels of telomerase in two USC samples (N4 and N7) (Figure 3).
Figure 3.
Telomerase activity in d-USC. (A) Both d-USC (n=10 patients with DN) and USC clones (n=10 healthy donors) at p5 showed telomerase positive (A450nm-A690nm > 0.2 units). (B) The levels of telomerase activity of d-USC clones showed significantly lower than those of USC (* p < 0.01). HEK 293 cells were used as a positive control.
Regeneration function of USC
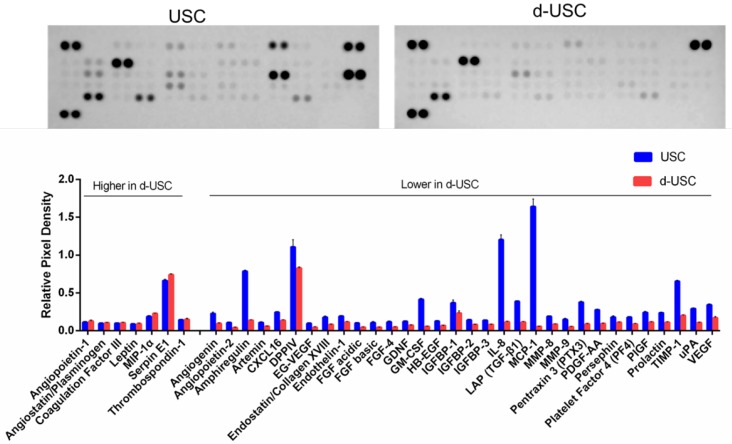
The profiles of proteins secreted from stem cells are often evaluated to assess stem cell regenerative function. The concentration of 32 pro-angiogenic growth factors detected in the supernatant of d-USC was significantly lower than in USC (p < 0.01) (Figure 4). Seven proteins secreted in d-USC were similar to or higher in concentration than in USC.
Figure 4.
Levels of Trophic factors secreted from d-USC. Levels of 32 pro-angiogenic growth factors secreted from d-USC (5×10⁵, p5) in vitro were significantly lower than those from USC, analyzed by human angiogenesis array kit, Relative Pixel Density presented as mean ± SD (p<0.01). Levels of seven proteins (Angiopoietin-1, Angiostatin/Plasminogen, Coagulation Factor III, Leptin, MIP-1α, Serpin E1, Thrombospondin-1) secreted in d-USC were similar to or higher than those in USC.
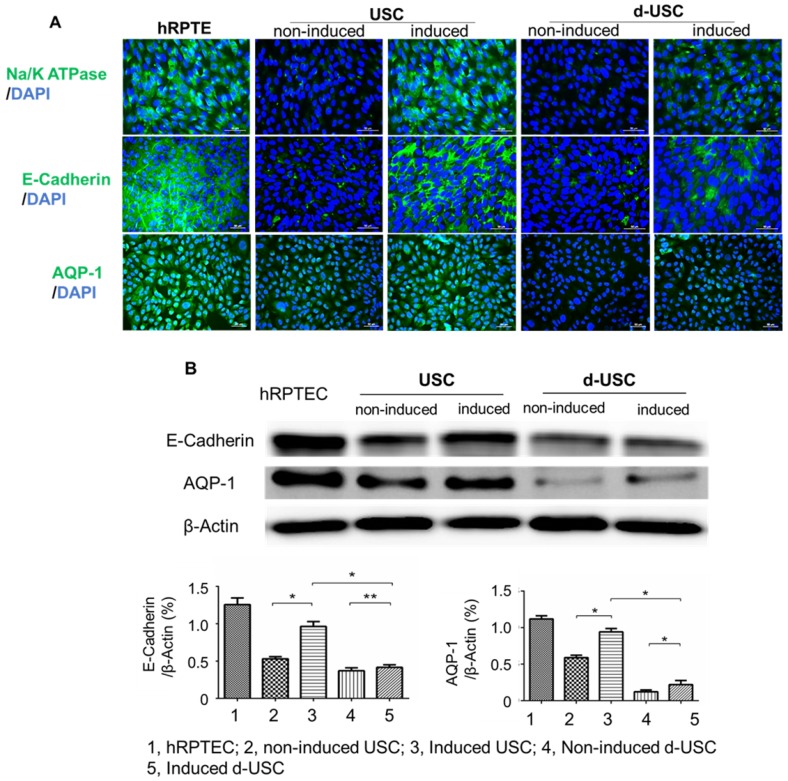
Renal tubule epithelial differentiation is also an important parameter in the assessment of stem cell plasticity and regenerative function of USC. Although both d-USC and USC displayed differentiation capacities, expression of RPTEC markers (AQP1, Na/K ATPase and E-cadherin) in d-USC was significantly weaker than in USC (p < 0.01) (Figure 5A and B). Expression of RPTEC markers in USC was similar to that in human RPTEC, used as a positive control.
Figure 5.
Renal tubular epithelial differentiation of d-USC. Expression of renal tubular epithelial cell markers (Na/K ATPase, E-Cadherin, AQP-1) in d-USC at p5 were significantly less compared to that in USC, quantitatively assessed by immunofluorescence staining (A) and by Western-blot (n = 6) (B). Results were presented as mean ± SD (*p < 0.01; ** p > 0.05).
mTOR signaling pathway proteins and autophagy expression
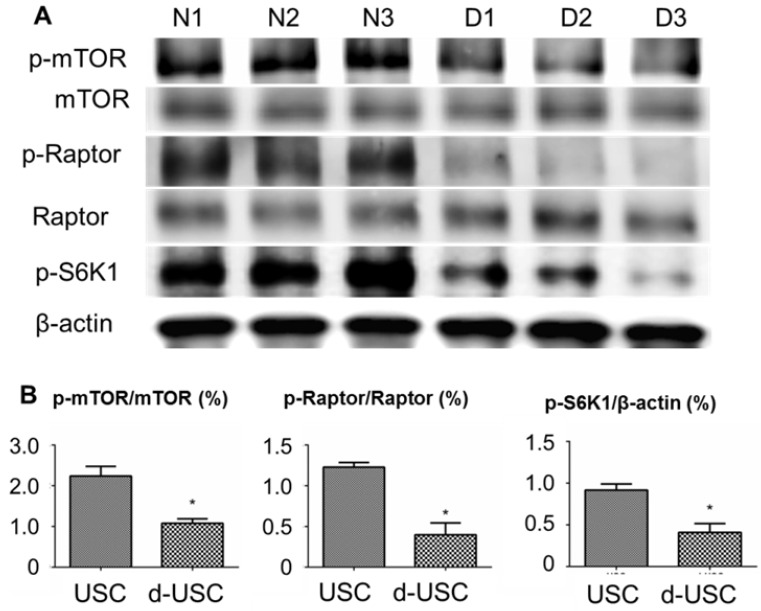
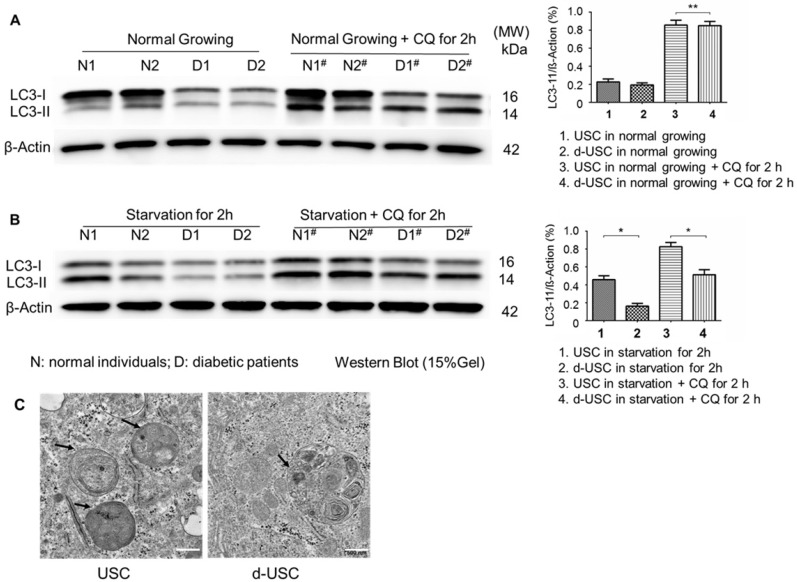
The mTOR pathway in stem cells has an important role in inhibiting senescence. Ratios of p-mTOR/total mTOR, p-Raptor/total Raptor, and p-S6K1/β-actin were significantly lower in d-USC (n = 10) than USC (p < 0.01) (Figure 6). This was consistent with the more rapid senescence of d-USC at p5, compared to USC at p8 and higher passages. In addition, stem cells maintain a high level of autophagy to promote regulation of damaged organelles. We tested how autophagy regulated the uniqueness of d-USC. There are no significant changes in levels of LC3-II expression in d-USC and USC in normal culture medium or the medium containing the autophagy inhibitor chloroquine (CQ) (Figure 7A). Autophagic flux was determined by calculating the ratio of LC3-II: β-actin in cells in starvation that did or did not receive treatment with chloroquine. Levels of LC3-II in d-USC were significantly lower in d-USC treated in HBSS buffer (starvation for 2 h) and chloroquine (10 μM, starvation for 2 h) treatment than those in USC (Figure 7B). There were fewer autophagosomes in d-USC treated with chloroquine than USC based on TEM results, which agreed with the Western blot data (Figures 7B and C).
Figure 6.
mTOR signaling pathway in d-USC. (A) Phosphorylation of mTOR signaling pathway was inhibited in d-USC at p5, compare to that in USC. (B) Ratios of p-mTOR/total m-TOR, p-Raptor/total Raptor and p-S6K/β-actin in d-USC (n = 10) were significantly lower than those in USC (*p < 0.01). Results presented as mean ± SD were quantitatively analyzed by Western blot.
Figure 7.
Lower autophagic flux in d-USC. (A) No difference in LC3 expression between d-USC and USC when grew in normal culture medium or medium containing chloroquine for 2 hours, assessed by Western blotting. β-actin served as the loading control. (B) Quantification of autophagic flux by calculating the ratio of LC3-II with or without CQ treatment in starvation. Levels of LC3-II in d-USC were significantly lower in d-USC treated in HBSS buffer (starvation for 2 h) and chloroquine (CQ, 10 μM, starvation for 2 h) treatment than those in USC. Data shown are the mean ± SD, n = 6 individual cell clones, *p < 0.05, **p > 0.05 (Student's t-test). (C) Representative transmission electron microscopy (TEM) images showed less autophagic vacuoles (AVs, indicated by short arrowheads) in d-USC with CQ treatment (10 μM, 2 h), compared to those in USC (scale bars, 500 nm).
Inflammatory, oxidative stress and apoptosis
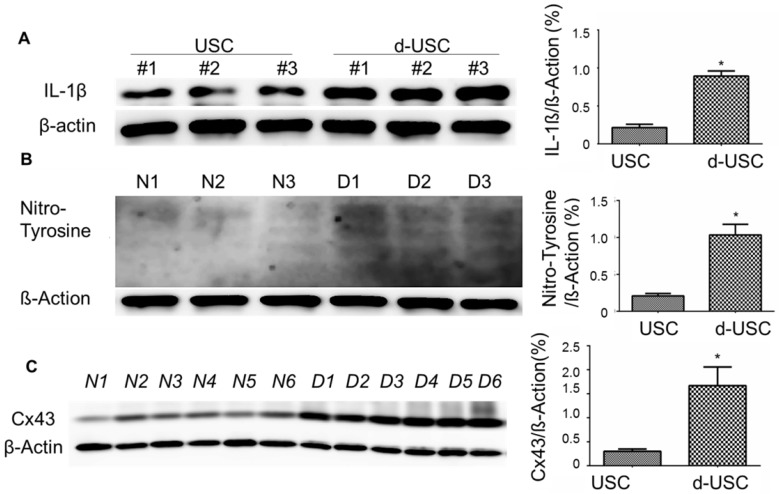
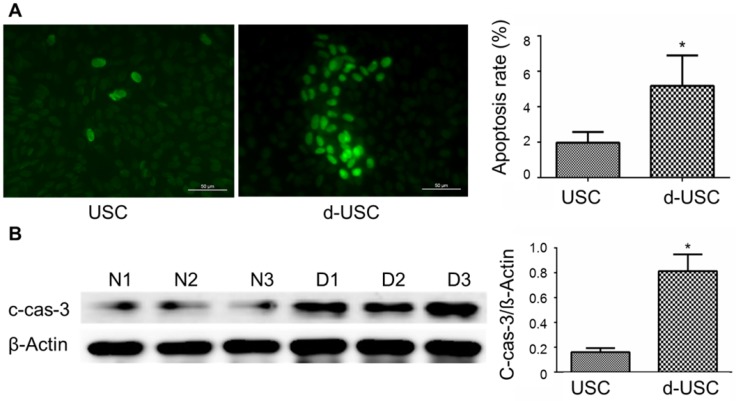
Oxidative stress and inflammatory are thought to promote apoptosis in cells from patients with diabetes 26, 27. We therefore analyzed protein levels of inflammatory, oxidative stress, and apoptosis in d-USC compared to USC. Expressions of IL-1β, an inflammatory marker, were significantly higher in d-USC vs. USC (p < 0.01). As a propagated pro-inflammatory and pro-fibrotic factor 28, 29, the levels of Cx43 were significantly higher in d-USC vs. USC (p < 0.01) (Figures 8A and B). In addition, levels of the oxidative stress maker nitro-tyrosine were significantly increased in d-USC vs. USC, as compared to those in USC as assessed by Western Blot (p<0.01) (Figures 8C). More d-USC stained positively for expression of apoptotic markers than USC. Based on the same number of cells seeded at initial plating 24 hours previously (phrase contrast data not included), the apoptotic index in d-USC (Mean ± SD, 23 ± 5.5%) was significantly higher than USC (Mean ± SD, 9.2 ± 2.8%), as quantitatively analyzed by TUNEL assay (Figure 9A). In addition, protein levels of cleaved caspase 3 (c-cas-3), an apoptotic marker, were significant higher in d-USC vs. USC (Figure 9B), as assessed by Western blots.
Figure 8.
Expression of inflammatory and Oxidative stress markers in d-USC. (A) Expression of IL-1β in d-USC was significantly higher than that in USC (at p5) (* p < 0.01), assessed by Western Blot. Data were repeated in 6 independent experiments and shown as mean ± SD. (B) Cx43 expression of d-USC (n = 6 individual cell clones) at p5 was significantly higher than that in USC from healthy donors (n = 6 individual cell clones) (* p < 0.01), assessed by Western Blot. Data were repeated in 12 independent experiments and shown as Means ± SD. (C) Expression of Nitro-Tyrosine in d-USC (p5, n = 6 individual cell clones) showed significantly higher than that in USC (p5, n = 6 individual cell clones) (* p < 0.01), assessed by Western Blot. The data were repeated in 6 independent experiments and shown as means ± SD.
Figure 9.
Apoptosis and apoptosis-related protein in d-USC. (A) Marker of apoptosis expressed positive in d-USC at p5 with TUNEL staining (green), compared to that in USC at p5 24 hours after seeding at 5 x 10⁵ cells/well in a 6-well plate, captured by a fluorescence microscope (400×). Numbers of cells expressed apoptosis‐related marker in d-USC (n = 10 samples) was significantly higher compared to those in USC (n=10 samples) (*p<0.01). Data represented mean ± SD. (B) The d-USC expressed significantly higher amount of apoptosis-related protein c-cas-3 protein compared to USC (p5) samples (*p<0.01). Data were presented as mean ± SD, assessed with Western Blot
Discussion
Patient-derived stem cells provide potentially valuable resources for in vitro testing of novel drugs or agents and in vivo therapeutic strategies. In addition, there is an emerging interest in studying stem cell characteristics to better understand the cellular basis of human diseases, including DN. Abnormal characteristics of stem cells identified in kidney disease may then be used as biomarkers to predict impaired kidney regenerative capacity and as tools for evaluating drug nephrotoxicity 30. A primary focus of this study was to explore differences in essential stem cell properties in regenerative function between d-USC and USC. The present study confirmed a reduction in the stemness properties of kidney resident stem cells collected in the urine from patients with DN. Compared to USC, d-USC had impaired telomerase activity and differentiation capacity, diminished production of pro-regenerative cytokines, and increased levels of inflammatory factors, apoptosis and oxidative stress markers, reflecting a reduced capacity for kidney injury repair in patients with diabetes and chronic kidney disease. These specific changes in the stemness of d-USC (such as levels of telomerase actively) could help clarify the pathobiology of DN and lead to the recognition of novel biomarkers to predict progression of DN. Importantly, restoration of USC function could enhance their beneficial impact in the treatment of diabetic kidney diseases.
Patients with DN shed more somatic cells, including podocytes 31 renal tubule epithelial cells and urothelial cells 4, into the urine than healthy individuals, and more renal stem cells as well. At this time, the cause for this difference has not been determined. It is speculated that pathologic changes in DN lead to podocyte injury and injury to other segments of the nephron, resulting in increased shedding of cells into the urine. Whether the total number of cells or stem cells shed into urine is directly related to the severity of renal damage requires further investigation. Although a heterogeneous cell population exists in the urine, our culture system allows only stem cells to attach and proliferate over time 5, 7, 8. This method provides a means to isolate stem cells from other somatic cells. Thus, it is possible to characterize the quality of USC from patients with DN and potentially quantitate these findings and develop biomarkers that are predictive of kidney disease progression. In addition, clone appearance, cell morphology and growth rate at p5 as are signs of good cell quality and may be good biomarkers of DN. The poor quality of d-USC cell appeared in later clone formation (about one week or longer after initial plating), associated with slower cell proliferation rates, increased cell size, and the presence of abundant vacuoles in the cytoplasm by p5. These cells had no or lower level of telomerase activity.
Telomerase activity represents the intrinsic stemness property of stem cells in cell growth, trophic factor secretion and multiple potential differentiations. Therefore, telomerase activity as a biomarker might offer a reliable tool to screen the stemness and regenerative capacity of resident stem cells for renal repair before intervention and also predict the progress of diabetic kidney disease. Our previous studies demonstrated that >75% of USC from healthy donors expressed telomerase activity 6. In this study, impaired telomerase activity was observed in d-USC with poor stemness quality. This decline of telomerase activity appears associated with diminished production of pro-regenerative cytokines and reduced differentiation ability of renal tubule epithelial cells, indicating impaired repair capability of urinary stem cells in diabetic kidney disease. Therefore, telomerase activity is a critical factor to predict the basic stem cell potential and fitness of USC and provides a platform by which to evaluate the regenerative aptitude of cell needed for kidney repair.
Oxidative stress and mTOR signaling are crucial mediators of the renal injury that occurs in DN 32. Producing reactive oxygen species (ROS) and reactive nitrogen species (RNS), uncoupling nitric oxide synthase (NOS), and disturbing mitochondrial quality control are three major mechanisms of oxidative stress. ROS affects stem cell renewal, proliferation and differentiation, healthy immune responses and longevity 33, 34. In addition, the mTOR pathway plays a central role in the regulation of cell metabolism, growth and proliferation in renal cells 35. Autophagy is a key for mitochondrial homeostasis regulation in stemness, including multi-potency acquisition and maintenance of adult stem cells 36. The present study displayed higher levels of oxidative stress maker (Nitro-Tyrosine) in d-USC compared to those in USC. In addition, low autophagic flux in d-USC, indicating that glucose toxicity might weaken autophagy function and subequatorial regenerative function of stem cells in diabetic kidney diseases. Furthermore, dysregulation of the m-TOR signaling pathway and increased levels of ROS were found in d-USC. Autophagy activity significantly decreased in d-USC, with low levels of autophagy markers in LC3-II and p-mTOR/mTOR, p-Raptor/Raptor, p-S6K1 for mTOR signaling molecules.
Connexin 43 (Cx43) as a major component of gap junctions is widely distributed in the human kidney, and also is important factor in the molecular biology of diabetes. In addition, Cx43 is considered to be involved in the inflammatory response and in the regulation of renal cell growth 37 and act as an early signal of renal inflammation during the progression of chronic kidney diseases 29, 38, 39, 40. Cx43 expression was increased during the progression of renal disease and decreased Cx43 expression has been shown to be beneficial in chronic inflammation 28, 29. In this study, a significantly higher expression of Cx43 and TUNEL in d-USC vs controls with moderate to severe loss of renal function was found, compared to USC from healthy donors, which might implicate delayed repair of nephrons in DN and also chronic renal inflammation. As the disease progresses, Cx43 appears expressed by all cell types affected by DN. Strongly expressed on inflammatory cells, on damaged tubular cells, and on interstitial cells in human kidneys 37, Cx43 displayed in USC might be used as biomarker for inflammation and renal fibrosis to predict disease progression. In addition, Cx43 can be pharmacological target against inflammatory renal diseases to improved glomerular injury and renal failure.
Based on our results, up to 70% of d-USC with impaired regenerative capacity might not be good candidates for cell therapy while 10-30% of d-USC have non-impaired or less impaired regeneration. Although the patients with DN and CKD 3-5 have impaired renal function, they still void urine. There appears to be a certain amount of USC with normal regenerative function. However, it is unknown why d-USC differ in their regenerative capacities and whether the good quality USC from the patients can be used for future cell therapy. Taken together, our data suggested the increased inflammatory cytokines and oxidative stress may enhance the apoptosis levels and impair the regenerative function of urinary stem cells in DN. Further investigations are needed to determine the changes in quality and quantity of d-USC associated with the different stages (I-V) of chronic kidney disease in more cases. In addition, we will characterize these stem cells with less impaired function and determine whether they can be made suitable for cell therapy. We seek to confirm our findings in a larger group of patients in the future.
Conclusions
Intrinsic stem cell properties, including regenerative capacity of urinary stem cells from DN patients, are significantly reduced due to alleviating inflammation, oxidative stress and apoptosis. These findings are associated with diminished production of pro-regenerative cytokines, reflecting a reduced capacity for kidney injury repair in patients with chronic kidney disease. These results indicate that the patient-derived urinary stem cells could be used for modeling the cell biology of DN and as a tool to predict poor outcome in patients with diabetes and chronic kidney disease. Understanding the defects in d-USC may help us better identify the pathogenesis of DN while USC populations with regeneration potential from the patients could be used in stem cell therapy.
Acknowledgments
Authors would like to thank Professor Douglas Lyles in the department of Biochemistry, Wake Forest School of Medicine for his comments and helpful discussions. Funding sources are the CKD Biomarkers Consortium Pilot and Feasibility Studies Program funded by the National Institute of Diabetes and Digestive and Kidney Diseases (NIDDK: U01 DK103225), Wake Forest Center for Redox Biology and Medicine pilot funds and National Natural Science Foundation of China (No. 81570650 and 81371704).
Abbreviations
- USC
urinary stem cells/urine-derived stem cells from individuals without diabetic nephropathy
- DN
diabetic nephropathy
- d-USC
USC of patients with diabetic nephropathy
- CKD
chronic kidney disease
- EPC
circulating endothelial progenitor cells
- KSFM
keratinocyte-serum free medium
- EFM
embryonic fibroblast medium
- FBS
fetal bovine serum
- PD
population doublings
- DT
doubling time
- RTPEC
renal tubular epithelial cells
- AQP-1
aquaporin-1
- IL-1β
interleukin-1beta
- Cx43
connexin 43
- TBS
tris buffered saline
- TEM
transmission electronic microscopy
References
- 1.American Diabetes Association (2014), Standards of medical care in diabetes - 2014. Diabetes Care. 37: S14-S80. [DOI] [PubMed]
- 2.Reeves WB, Andreoli TE. Transforming growth factor beta contributes to progressive diabetic nephropathy. Proc Natl Acad Sci USA. 2000;97:7667–9. doi: 10.1073/pnas.97.14.7667. [DOI] [PMC free article] [PubMed] [Google Scholar]
- 3.Ritz E, Orth SR. Nephropathy in patients with type 2 diabetes mellitus. N Engl J Med. 1999;341:1127–33. doi: 10.1056/NEJM199910073411506. [DOI] [PubMed] [Google Scholar]
- 4.Zhang Y, McNeill E, Tian H, Soker S, Andersson KE, Yoo JJ. et al. Urine derived cells are a potential source for urological tissue reconstruction. The Journal of urology. 2008;180:2226–33. doi: 10.1016/j.juro.2008.07.023. [DOI] [PubMed] [Google Scholar]
- 5.Bharadwaj S, Liu G, Shi Y, Wu R, Yang B, He T. et al. Multipotential differentiation of human urine-derived stem cells: potential for therapeutic applications in urology. Stem Cells. 2013;31:1840–56. doi: 10.1002/stem.1424. [DOI] [PubMed] [Google Scholar]
- 6.Wu RP, Liu G, Shi YA, Bharadwaj S, Atala A, Zhang Y. Human urine-derived stem cells originate from parietal stem cells. J Urol. 2014;191:e1–e958. [Google Scholar]
- 7.Zhang D, Wei G, Li P, Zhou X, Zhang Y. Urine-derived stem cells: A novel and versatile progenitor source for cell-based therapy and regenerative medicine. Genes Dis. 2014;1:8–17. doi: 10.1016/j.gendis.2014.07.001. [DOI] [PMC free article] [PubMed] [Google Scholar]
- 8.Qin D, Long T, Deng J, Zhang Y. Urine-derived stem cells for potential use in bladder repair. Stem Cell Res Ther. 2014;5:69. doi: 10.1186/scrt458. [DOI] [PMC free article] [PubMed] [Google Scholar]
- 9.Herberts CA, Kwa MS, Hermsen HP. Risk factors in the development of stem cell therapy. J Transl Med. 2011;9:29. doi: 10.1186/1479-5876-9-29. [DOI] [PMC free article] [PubMed] [Google Scholar]
- 10.Lazzeri E, Ronconi E, Angelotti ML, Peired A, Mazzinghi B, Becherucci F. et al. Human Urine-Derived Renal Progenitors for Personalized Modeling of Genetic Kidney Disorders. J Am Soc Nephrol. 2015;26:1961–74. doi: 10.1681/ASN.2014010057. [DOI] [PMC free article] [PubMed] [Google Scholar]
- 11.Liu Y, Ma W, Liu B, Wang Y, Chu J, Xiong G. et al. Urethral reconstruction with autologous urine-derived stem cells seeded in three-dimensional porous small intestinal submucosa in a rabbit model. Stem Cell Res Ther. 2017;8:63. doi: 10.1186/s13287-017-0500-y. [DOI] [PMC free article] [PubMed] [Google Scholar]
- 12.Tran C, Tangada A, Yi H, Balog B, Zhang Y, Damaser M. Human urine-derived stem cells or their secretome alone facilitate functional recovery in a rat model of stress urinary incontinence. Journal of Urology; 2016. p. 195. No. 4S,: e845. [Google Scholar]
- 13.Lee JN, Chun SY, Lee HJ, Jang YJ, Choi SH, Kim DH. et al. Human Urine-derived Stem Cells Seeded Surface Modified Composite Scaffold Grafts for Bladder Reconstruction in a Rat Model. J Korean Med Sci. 2015;30:1754–63. doi: 10.3346/jkms.2015.30.12.1754. [DOI] [PMC free article] [PubMed] [Google Scholar]
- 14.Chen L, Li L, Xing F, Peng J, Peng K, Wang Y. et al. Human Urine-Derived Stem Cells: Potential for Cell-Based Therapy of Cartilage Defects. Stem Cells Int. 2018;2018:4686259. doi: 10.1155/2018/4686259. [DOI] [PMC free article] [PubMed] [Google Scholar]
- 15.Dong X, Zhang T, Liu Q, Zhu J, Zhao J, Li J. et al. Beneficial effects of urine-derived stem cells on fibrosis and apoptosis of myocardial, glomerular and bladder cells. Mol Cell Endocrinol. 2016;427:21–32. doi: 10.1016/j.mce.2016.03.001. [DOI] [PubMed] [Google Scholar]
- 16.Chen C-Y, Rao S-S, Ren L, Hu X-K, Tan Y-J, Hu Y. et al. Exosomal DMBT1 from human urine-derived stem cells facilitates diabetic wound repair by promoting angiogenesis. Theranostics. 2018;8:1607. doi: 10.7150/thno.22958. [DOI] [PMC free article] [PubMed] [Google Scholar]
- 17.Yang Q, Chen X, Zheng T, Han D, Zhang H, Shi Y. et al. Transplantation of Human Urine-Derived Stem Cells Transfected with Pigment Epithelium-Derived Factor to Protect Erectile Function in a Rat Model of Cavernous Nerve Injury. Cell transplantation. 2016;25:1987–2001. doi: 10.3727/096368916X691448. [DOI] [PubMed] [Google Scholar]
- 18.Ouyang B, Sun X, Han D, Chen S, Yao B, Gao Y. et al. Human urine-derived stem cells alone or genetically-modified with FGF2 Improve type 2 diabetic erectile dysfunction in a rat model. PLoS One. 2014;9:e92825. doi: 10.1371/journal.pone.0092825. [DOI] [PMC free article] [PubMed] [Google Scholar]
- 19.Han JW, Sin MY, Yoon YS. Cell therapy for diabetic neuropathy using adult stem or progenitor cells. Diabetes Metab J. 2013;37:91–105. doi: 10.4093/dmj.2013.37.2.91. [DOI] [PMC free article] [PubMed] [Google Scholar]
- 20.Klinkhammer BM, Kramann R, Mallau M, Makowska A, van Roeyen CR, Rong S. et al. Mesenchymal stem cells from rats with chronic kidney disease exhibit premature senescence and loss of regenerative potential. PLoS One. 2014;9:e92115. doi: 10.1371/journal.pone.0092115. [DOI] [PMC free article] [PubMed] [Google Scholar]
- 21.Shaw LC, Neu MB, Grant MB. Cell-based therapies for diabetic retinopathy. Curr Diab Rep. 2011;11:265–74. doi: 10.1007/s11892-011-0197-8. [DOI] [PMC free article] [PubMed] [Google Scholar]
- 22.Ko KI, Coimbra LS, Tian C, Alblowi J, Kayal RA, Einhorn TA. et al. Diabetes reduces mesenchymal stem cells in fracture healing through a TNFalpha-mediated mechanism. Diabetologia. 2015;58:633–42. doi: 10.1007/s00125-014-3470-y. [DOI] [PMC free article] [PubMed] [Google Scholar]
- 23.Zhu M, He X, Wang XH, Qiu W, Xing W, Guo W. et al. Complement C5a induces mesenchymal stem cell apoptosis during the progression of chronic diabetic complications. Diabetologia. 2017;60:1822–33. doi: 10.1007/s00125-017-4316-1. [DOI] [PubMed] [Google Scholar]
- 24.Hazra S, Jarajapu YP, Stepps V, Caballero S, Thinschmidt JS, Sautina L. et al. Long-term type 1 diabetes influences haematopoietic stem cells by reducing vascular repair potential and increasing inflammatory monocyte generation in a murine model. Diabetologia. 2013;56:644–53. doi: 10.1007/s00125-012-2781-0. [DOI] [PMC free article] [PubMed] [Google Scholar]
- 25.Levey AS, Coresh J. Chronic kidney disease. Lancet. 2012;379:165–80. doi: 10.1016/S0140-6736(11)60178-5. [DOI] [PubMed] [Google Scholar]
- 26.Pahl HL. Activators and target genes of Rel/NF-kappaB transcription factors. Oncogene. 1999;18:6853–66. doi: 10.1038/sj.onc.1203239. [DOI] [PubMed] [Google Scholar]
- 27.Montane J, Cadavez L, Novials A. Stress and the inflammatory process: a major cause of pancreatic cell death in type 2 diabetes. Diabetes Metab Syndr Obes. 2014;7:25–34. doi: 10.2147/DMSO.S37649. [DOI] [PMC free article] [PubMed] [Google Scholar]
- 28.Abed A, Toubas J, Kavvadas P, Authier F, Cathelin D, Alfieri C. et al. Targeting connexin 43 protects against the progression of experimental chronic kidney disease in mice. Kidney Int. 2014;86:768–79. doi: 10.1038/ki.2014.108. [DOI] [PubMed] [Google Scholar]
- 29.Toubas J, Beck S, Pageaud AL, Huby AC, Mael-Ainin M, Dussaule JC. et al. Alteration of connexin expression is an early signal for chronic kidney disease. Am J Physiol Renal Physiol. 2011;301:F24–32. doi: 10.1152/ajprenal.00255.2010. [DOI] [PubMed] [Google Scholar]
- 30.Soo JY, Jansen J, Masereeuw R, Little MH. Advances in predictive in vitro models of drug-induced nephrotoxicity. Nat Rev Nephrol. 2018;14:378–93. doi: 10.1038/s41581-018-0003-9. [DOI] [PMC free article] [PubMed] [Google Scholar]
- 31.Nakamura T, Ushiyama C, Suzuki S, Hara M, Shimada N, Ebihara I. et al. Urinary excretion of podocytes in patients with diabetic nephropathy. Nephrol Dial Transplant. 2000;15:1379–83. doi: 10.1093/ndt/15.9.1379. [DOI] [PubMed] [Google Scholar]
- 32.Sureshbabu A, Ryter SW, Choi ME. Oxidative stress and autophagy: crucial modulators of kidney injury. Redox Biol. 2015;4:208–14. doi: 10.1016/j.redox.2015.01.001. [DOI] [PMC free article] [PubMed] [Google Scholar]
- 33.Denu RA, Hematti P. Effects of Oxidative Stress on Mesenchymal Stem Cell Biology. Oxid Med Cell Longev. 2016;2016:2989076. doi: 10.1155/2016/2989076. [DOI] [PMC free article] [PubMed] [Google Scholar]
- 34.Bigarella CL, Liang R, Ghaffari S. Stem cells and the impact of ROS signaling. Development. 2014;141:4206–18. doi: 10.1242/dev.107086. [DOI] [PMC free article] [PubMed] [Google Scholar]
- 35.Lieberthal W, Levine JS. The role of the mammalian target of rapamycin (mTOR) in renal disease. J Am Soc Nephrol. 2009;20:2493–502. doi: 10.1681/ASN.2008111186. [DOI] [PubMed] [Google Scholar]
- 36.Liu P, Liu K, Gu H, Wang W, Gong J, Zhu Y. et al. High autophagic flux guards ESC identity through coordinating autophagy machinery gene program by FOXO1. Cell Death Differ. 2017;24:1672–80. doi: 10.1038/cdd.2017.90. [DOI] [PMC free article] [PubMed] [Google Scholar]
- 37.Hillis GS, Duthie LA, Brown PA, Simpson JG, MacLeod AM, Haites NE. Upregulation and co-localization of connexin43 and cellular adhesion molecules in inflammatory renal disease. J Pathol. 1997;182:373–9. doi: 10.1002/(SICI)1096-9896(199708)182:4<373::AID-PATH858>3.0.CO;2-B. [DOI] [PubMed] [Google Scholar]
- 38.Sarieddine MZ, Scheckenbach KE, Foglia B, Maass K, Garcia I, Kwak BR. et al. Connexin43 modulates neutrophil recruitment to the lung. J Cell Mol Med. 2009;13:4560–70. doi: 10.1111/j.1582-4934.2008.00654.x. [DOI] [PMC free article] [PubMed] [Google Scholar]
- 39.Ey B, Eyking A, Gerken G, Podolsky DK, Cario E. TLR2 mediates gap junctional intercellular communication through connexin-43 in intestinal epithelial barrier injury. J Biol Chem. 2009;284:22332–43. doi: 10.1074/jbc.M901619200. [DOI] [PMC free article] [PubMed] [Google Scholar]
- 40.Sawai K, Mukoyama M, Mori K, Yokoi H, Koshikawa M, Yoshioka T. et al. Redistribution of connexin43 expression in glomerular podocytes predicts poor renal prognosis in patients with type 2 diabetes and overt nephropathy. Nephrol Dial Transplant. 2006;21:2472–7. doi: 10.1093/ndt/gfl260. [DOI] [PubMed] [Google Scholar]


