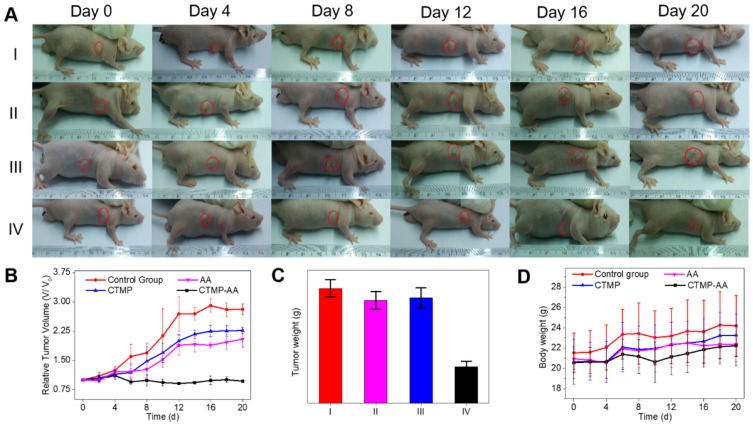
Figure 5.
Antitumor effect of CTMP-AA: (A) the representative images of mice following 20-days treatment for each treatment group; (B) quantitative results of the HepG2 relative tumor volumes. Tumor volumes were normalized to their initial size. (C) Quantitative results of the tumors' weight: (I) Normal saline (NS) as the control group, (II) Free AA, (III) CTMP and (IV) CTMP-AA. (D) The mice weight changes for each treatment group. All data is shown as mean ± S.D.; n = 5 per group.

