

ABSTRACT
In the present study, we aimed to identify specific lncRNAs and miRNAs, as well as mRNAs, involved in bile duct carcinoma (BDC) and to further explore the way in which lncRNA UCA1 regulates cell metastasis ability. Differentially expressed RNAs were screened out from the TCGA database. In in vitro experiments, qRT-PCR was used to measure lncRNA UCA1, miR-122 and CLIC1 expression. We performed a dual luciferase assay to validate the target relationships among UCA1, CLIC1 and miR-122. The cell migration ability was measured by a wound healing assay, and Transwell assays were applied to detect cell invasive ability. Western blot analysis was employed to detect the expression of related proteins in the MAPK signaling pathway. According to the bioinformatics analysis, lncRNA UCA1 and CLIC1 were both significantly upregulated in BDC, while the expression of miR-122 declined compared with the normal group. The target relationship among UCA1, CLIC1 and miR-122 was verified. UCA1 promoted BDC cell migration and invasiveness, while miR-122 inhibited their progression. CLIC1 served as the downstream target gene of miR-122 and had opposite effects. The ERK/MAPK signaling pathway was activated after upregulating UCA1. LncRNA-UCA1 promoted the metastasis of BDC cells by regulating the expression of miR-122 and its downstream gene mRNA CLIC1 and promoted the activation of the ERK/MAPK pathway, which expanded the horizons of targeted therapy of cholangiocarcinoma.
KEYWORDS: Bile duct carcinoma, miR-122, UCA1, CLIC1, ERK/MAPK signaling pathway
Instruction
Bile duct cancer (BDC), also known as cholangiocarcinoma, is the second most common primary hepatic carcinoma with a median survival of less than 2 years [1]. Depending on the location of the lesion, BDC is classified as intrahepatic or extrahepatic [2]. A surgical resection at an early stage is thought to provide a better prognosis [3]. Because of the difficulty in diagnosing BDC at an early stage and the few available treatment options, this cancer still accounts for increasing mortality around the world [4,5]. Over time, cholangiocarcinoma’s survival rate and therapeutic options have been found to be unsatisfactory and have not improved. Therefore, it is urgent to investigate this cancer’s pathogenesis to better understand BDC and explore effective therapeutics.
Accumulating evidence has shown that a large number of long noncoding RNAs (lncRNAs) are involved in diverse pathophysiological processes, including cancer progression [6]. In the study by Shi, X et al., lncRNA AFAP1-AS1 promoted the growth and metastasis of BDC cells [7]. More interestingly, lncRNAs H19 and HULC acted as competing endogenous RNAs (ceRNAs) and facilitated cell migration and invasiveness in BDC [8]. LncRNA urothelial cancer associated 1 (lncRNA-UCA1) has appeared in prior reports before. Ni, B et al. have indicated that lncRNA-UCA1 contributed to cell proliferation and metastasis in colorectal cancer [9]. In addition, lncRNA-UCA1 attenuated radio sensitivity in prostate cancer, and high levels of lncRNA-UCA1 were associated with a poor prognosis [10]. Despite the functions of lncRNA-UCA1 in other human carcinomas, the molecular mechanism of this lncRNA in BDC remains to be elucidated.
MicroRNAs (miRNAs) have been defined as small noncoding RNAs consisting of approximately 22 nucleotides. In recent years, dysregulated miRNAs have been found in human diseases, including cancers [11]. However, the function of miRNAs are not always identical, even in similar cancers. In regards to BDC, miR-34a-dependent overexpression of Per1 reduced BDC growth, while miR-191 acted as a tumor promotor in intrahepatic cholangiocarcinoma [12,13]. As the most frequent miRNA in the adult liver, miR-122 was identified as a central player in liver biology and disease. In addition, it has been demonstrated that miR-122 is an indispensable host factor for hepatitis C virus (HCV) infection [14]. Most of the previous studies have focused on the function of miR-122 in hepatocellular carcinoma and hepatic B and hepatic C viral infections [15,16]. Recently, Xu, Z et al. have reported that miR-122 plays an inhibitory role in proliferation, invasiveness and growth of BDC by targeting ALDOA [4]. Although the function of miR-122 has been gradually fully illustrated in BDC, the comprehensive interactions of miR-122 deserve further explorations.
The chloride intracellular channel 1 (CLIC1) is a member of the CLIC family. Additionally, it is also the most studied one in the family [17]. The effects of CLIC1 have been explored and reported in human cancers. For instance, CLIC1 contributes to chemoresistance in human choriocarcinoma [18]. Silencing of CLIC1 represses gallbladder carcinoma cell proliferation, migration and invasiveness but promotes apoptosis [19]. Wei, X et al. observed CLIC1 upregulation in hepatocellular carcinoma (HCC), and moreover, knockdown of CLIC1 resulted in a decline of invasiveness and viability of the HCC cell line [20]. Although CLIC1 has often been investigated in human diseases, its function in BDC has not been reported to date.
Because the role of lncRNA-UCA1 in BDC is still unknown, we studied lncRNA-UCA1 and elucidated its functions in BDC for the first time. In the present investigation, we evaluated the effect of lncRNA-UCA1 on BDC and identified one of its mechanisms in BDC. LncRNA-UCA1 could function as a ceRNA to target miR-122, and miR-122 could affect CLIC1 expression. In addition, lncRNA-UCA1 could activate the ERK/MAPK signaling pathway in BDC. In conclusion, we not only carried out in vitro experiments but also observed that survival rates were associated with up- or downregulation of lncRNA-UCA1 and CLIC1, respectively. Our results indicate that lncRNA-UCA1 might be a latent target for the development of BDC treatment and warrants further research.
Materials and methods
Human tissue samples
Twenty-two cases of BDC tissue samples and their matched adjacent normal tissues were obtained from patients receiving surgical resection at the Shanghai Fourth People’s Hospital. The patients were diagnosed with BDC based on histopathological evaluation and had not received preoperative radiotherapy or chemotherapy. Approval was obtained from the Shanghai Fourth People’s Hospital, and informed consent was obtained from all patients. All of the tissues were preserved in liquid nitrogen at −80°C for the following experiments.
Cell culture and transfection
Human BDC cell lines LIPF155C, CCLP1, QBC939, huh28 and the normal intrahepatic bile duct epithelial cell line HIBEC were purchased from the BeNa Culture Collection (Shanghai, China). CCLP1, QBC939 and LIPF155C were cultured in Dulbecco Modified Eagle Medium (DMEM; Thermo Fisher Scientific, Waltham, MA, USA) with 40% fetal bovine serum (FBS) and 10% dimethyl sulfoxide (DMSO). Huh28 and HIBEC were cultured in Roswell Park Memorial Institute 1640 (RPMI-1640; Thermo Fisher Scientific) with 40% FBS and 10% DMSO. All cells were cultured in humidified air with 5% CO2 at 37°C.
CCLP1 and QBC939 cell lines were chosen to perform subsequent experiments because the expression of lncRNA UCA1 was the highest in these lines. Before transfection, 2 × 10 [5] cells were cultured in six-well plates with 2 mL complete medium for 16–18 h until they were 30–40% confluent. Transfection was performed following the instructions for Lipofectamine 2000 (Invitrogen, Carlsbad, CA). Cells were generally distributed into different groups as follows: (1) Negative control (NC) group, UCA1 group and si-UCA1 group; (2) Negative control (NC) group, mimics group and mimics+UCA1 group; (3) Negative control (NC) group, si-CLIC1 group, CLIC1 group, mimics+CLIC1 group and si-UCA1+CLIC1 group. The siRNAs were purchased from Sangon (Shanghai, China), and their sequences were as follows:
UCA1: 5′ CAACAGGGAATACTATTCGTATGAT 3′
CLIC1: 5′ GGGAGTCACCTTCAATGTT 3′
Microarray analysis
The dataset was downloaded from the Cancer Genome Atlas (https://cancergenome.nih.gov/) and utilized to conduct microarray analysis. Data from 9 tumor tissues of BDC and matched normal tissues were adopted for this study. The raw data were corrected and normalized by “DESeq2” and the “edgeR” package using R 3.4.1 software. Matched probes were picked out to analyze the differentially expressed genes (DEGs). The screening conditions for DEGs were a P value under the 0.05 level of the Wald test and a value of log2 (fold change) greater than 1. Then, the data were used for multivariate analysis with the “mixOmics” package. Prognostic analysis was also conducted based on the dataset.
Quantitative real-time polymerase chain reaction
After extraction with TRIzol reagent (Invitrogen, Carlsbad, CA), total RNA was concentrated by isopropanol. The integrity of the RNA was detected by agarose gel electrophoresis. Reverse transcription was conducted using a Super Script TMIII Reverse Transcriptase Kit (Invitrogen, Carlsbad, CA), and quantitative real-time polymerase chain reaction (qRT-PCR) was performed with the following conditions: 95°C for 15 sec, 60°C for 30 sec, 74°C for 30 min (40 cycles). The number of cycles was recorded as Ct through the fluorescence signal in each reaction tube that reached the set values. U6 and β-actin were selected to be the internal controls. The primers are presented in Table 1. The relative expression was calculated by the 2−ΔΔCT method.
Table 1.
Sequence used for qRT-PCR.
| Gene | Primer name | Sequence |
|---|---|---|
| UCA1 | Forward | 5′-TGACAACAGATAACCACCTT-3′ |
| Reverse | 5′-TCCGTATAGAAGACCACCTA-3′ | |
| miR-122 | Forward | 5′-TGTGGAGTGTGACAATGGT-3’ |
| Reverse | 5′-GTGTGATAATGGCGTTTGATAG-3′ | |
| CLIC1 | Forward | 5′-GTGAAGGCTGGCAGTGAT-3′ |
| Reverse | 5′-ACGGTGGTAACATTGAAGGT-3′ | |
| U6 | Forward | 5′-CTCGCTTCGGCAGCACATA-3′ |
| Reverse | 5′-AACGATTCACGAATTTGCGT-3′ | |
| β-actin | Forward | 5′-CTCCATCCTGGCCTCGCTGT-3′ |
| Reverse | 5′-GCTGTCACCTTCACCGTTCC-3′ |
Western blot analysis
Cell lysates were prepared by extracting proteins with RIPA (Beyotime, Shanghai, China), and the protein concentration was quantified using the BCA method. Proteins were separated by SDS-PAGE and transferred to PVDF membranes. After being blocked in 5% skim milk for 2 h, the membranes were incubated with primary antibodies (anti-ERK, ab54230, 1:500; anti-p-ERK, ab192591, 1:1000; anti-MAPK, ab197348, 1:1000; anti-p-MAPK, ab211061, 1:1000; anti-β-actin, ab8227, 1:10,000, Abcam, Cambridge, MA, USA) overnight at 4°C, respectively, then with the secondary antibody (ab7090, 1:2000, Abcam) for 1 h at 37°C. Images were acquired by using enhanced chemiluminescence (ECL). The results were treated with gray analysis by image analysis software Gel-Pro Analyzer (United States Biochemical, Cleveland, OH, USA) after scanning. The semiquantitative analysis was performed according to the relative expression of the targeted protein and the internal control protein β-actin, namely, the ratio of the targeted protein and internal control protein.
Dual-luciferase reporter assay
Target genes were predicted by microRNA target prediction software (TargetScan and miRanda). The DNA fragment of the site was synthesized in vitro and the sequence was inserted downstream of the psi-CHECKTM-2 vector (Promega, Madison, WI) of the Renilla luciferase encoding gene to construct a 3′UTR luciferase expression vector of wild-type CLIC1. According to the characteristics of the binding of microRNA and target gene, the primers were designed to mutate the combined seed sequence region of miR-122 and the CLIC1 3′UTR and construct the 3′UTR luciferase expression vector of mutant CLIC1. The constructed vector was inserted into CCLP1 and QBC939 cells. The bacterial cells were incubated in LB Petri dishes containing ampicillin (100 mg/L) to cultivate overnight. Monoclonal colonies were picked to pyrolyze for 5 min at 99°C. The supernatant was obtained to identify the positive clones by PCR. The plasmids were extracted by a plasmid mini kit (Sigma Aldrich, St. Louis, MO) to perform XhoI and NotI double digests and sequencing. The enzyme-digested products were separated by 1% agarose gel electrophoresis containing ethyl bromide and imaged using an UVP gel imaging system. The cells were cotransfected with the 3′UTR luciferase expression vector of wild type/mutant CLIC1 and the antisense miR-122/control microRNA after the vector was identified successfully. The activity of the Renilla luciferase was detected using a dual luciferase assay kit (E1910, Promega, Madison, WI), and the activity of firefly luciferase was used as an internal reference.
Wound healing assay
Cells were cultured in 6-well plates to form a confluent monolayer for 24 h followed by 10 mg/mL mitomycin C (Sigma) treatment for 2 h. The monolayer was scratched with a sterile pipette tip (200 mL). The cells were washed twice with PBS and incubated in serum-free RPMI 1640 medium. The cells were photographed after 0, 24 h and 48 h. The wounded areas were photographed with a microscope. The proportion of wound closure was measured by ImageJ software.
Transwell invasion assay
To detect the invasive capacity of HCC cells, 1 × 10 [5] cells were seeded on a Transwell plate coated with Matrigel matrix (BD Biosciences, Franklin Lakes, NJ, USA), and the bottom chamber was supplied with RPMI 1640 medium containing 10% FBS. After 36 h incubation, the cells were fixed, stained, and observed using a microscope.
Statistical analysis
All experiments were repeated at least three times. The data are presented as the mean ± standard deviation (SD) using GraphPad Prism 6.0 software. Differences between two groups were recognized by unpaired t-tests, and one-way analysis of variance (ANOVA) was employed to identify differences between three or more groups. P < 0.05 was considered to be statistical significance.
Results
lncRNA-UCA1 was upregulated in BDC
Statistical software R and limma packages were employed to analyze the differentially expressed RNAs between normal and tumor tissues. The volcano map is shown in Figure 1A, in which dots in red mean significantly upregulated in carcinoma, while green dots suggest downregulated expression compared with the normal group. The top 10 downregulated and upregulated lncRNAs in tumor tissues were screened out and are presented in Figure 1B. As shown in the results, UCA1 was a highly expressed lncRNA in BDC.
Figure 1.

LncRNA UCA1 expression was upregulated in human bile duct carcinoma. (a) Volcano map. x-axis: log2 (fold change); y-axis: log10 (P-value). the vertical blue lines correspond to 2-fold up and down, and the horizontal blue line represents a P value of 0.05. the red and green points in the plot represent differentially expressed lncRNAs with statistical significance (red: up, green: down). (b) Heatmap showing the differential expression and hierarchical clustering of lncRNAs between BDC and adjacent normal tissues. the top 10 low-expressed and high-expressed lncRNAs in tumor tissue were screened and presented. the red and green blocks in the map represent differentially expressed lncRNAs (red: high-expressed, green: low-expressed). (c) Kaplan–Meier plots for overall survival for a discriminatory median UCA1 expression, from TCGA sequencing data to assess prognostic accuracy. P values were calculated using the log-rank test. (d) the relative expression levels of UCA1 in BDC cell lines and normal bile duct epithelial cells were detected by qRT-PCR. **P < 0.01 compared to the HIBEC group. (e) the relative expression levels of UCA1 in 22 pairs of BDC tissues and para-carcinoma tissues were detected by qRT-PCR. **P < 0.01 compared to the para-carcinoma group. (f) qRT-PCR was used to detect the transfection efficiency of UCA1 in BDC cells treated with pcDNA3.1-UCA1 and siUCA1. **P < 0.01 compared to the NC group.
Kaplan-Meier prognosis analysis indicated an association between UCA1 high expression and a worse survival rate (Figure 1C). The expression level of UCA1 in a series of BDC cell lines were evaluated via qRT-PCR. In Figure 1D, the increasing tendency was most obvious in the QBC939 and CCLP1 cell lines, so subsequent experiments were conducted in these cell lines. The relative expression levels of UCA1 in 22 pairs of BDC tissues and para-carcinoma tissues were detected by qRT-PCR (Figure 1E, P < 0.01). As shown in the results, UCA1 was notably upregulated in BDC tissues compared with para-carcinoma tissues. Combining these bioinformatics results and experiments in vitro, we speculated that UCA1 could affect the pathological progress of BDC.
Effects of UCA1 on cell migration, invasion and activation of the ERK/MAPK signaling pathway
qRT-PCR was employed to estimate the efficiency of UCA1 in BDC cells transfected with pcDNA3.1-UCA1 and siUCA1. UCA1 was overexpressed after administration of pcDNA3.1-UCA1, while it was decreased in the siUCA1 group (Figure 1F, P < 0.01). Then, to verify the mechanism of lncRNA-UCA1 in BDC, the transfected cells were divided into three groups: a negative control group (NC), an UCA1 overexpression group (UCA1), and an UCA1 siRNA group (siUCA1). Wound healing assays and Transwell assays were applied to detect migration and invasiveness in QBC939 and CCLP1 cells (Figure 2A-D), which were higher compared to that in the NC group and siUCA1 group (P < 0.01), suggesting that UCA1 could enhance the migration and invasiveness of these cells. Western blotting was conducted to measure the relative protein expression levels in the ERK/MAPK signaling pathway. As shown in the results, the overexpressed UCA1 facilitated the phosphorylation of ERK/MAPK proteins, consequently activating the ERK/MAPK pathways, while the silencing of UCA1 weakened the phosphorylation level and the ERK/MAPK pathways were blocked (Figure 3A-B). All tendencies in the results were consistent in CCLP1 and QBC939 cells.
Figure 2.

Effects of UCA1 on cell migration and invasion. (a-b) Cell migration ability was detected using wound healing assay in CCLP1 and QBC939 cells after transfection for 0 h, 24 h and 48 h. (c-d) Transwell assays were performed to investigate changes in cell invasion ability. Scale bars represent 80 μm.
Figure 3.
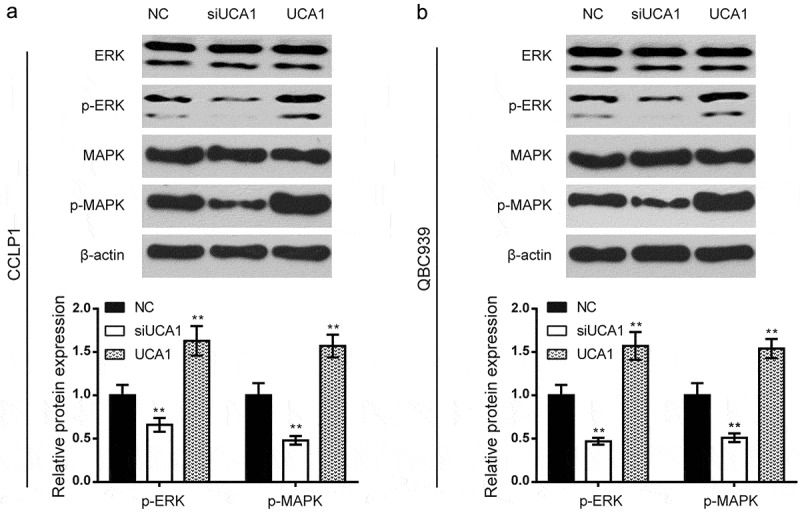
Effects of UCA1 on activation of ERK/MAPK signaling pathway. (a-b) the relative protein expression levels of the ERK/MAPK signaling pathway in CCLP1 cells and QBC939 cells were detected by western blot. compared to the NC group, overexpressed UCA1 enhanced the phosphorylation of ERK and MAPK proteins while the silencing of UCA1 weakened the phosphorylation level. all tendency of results was consistent in CCLP1 and QBC939 cells. **P < 0.01 compared to the NC group.
UCA1 is a target of miR-122
We also detected the differentially expressed microRNAs in BDC. The volcano map is shown in Figure 4A, in which a dot in red means significantly overexpressed in carcinoma, while a green dot suggests downregulated expression compared with the normal group. The top 10 downregulated and upregulated microRNAs in tumor tissues are presented in Figure 4B. As shown in the results, miR-122 was the low-expressed microRNA in BDC. Kaplan-Meier prognosis analysis demonstrated that miR-122 low expression was associated with a worse overall survival rate (Figure 4C). The base pairing sequences were predicted by bioinformatics software miRcode and are shown in Figure 4D.
Figure 4.

UCA1 is a target of miR-122. (a) Volcano plot. x-axis: log2 (fold change); y-axis: log10 (P-value). The vertical blue lines correspond to 2.0-fold up and down, and the horizontal blue line represents a P-value of 0.05. The red and green points in the plot represent differentially expressed microRNAs with statistical significance (red: up, green: down). (b) Heatmap showing the differential expression and hierarchical clustering of microRNAs between BDC and adjacent normal tissues. The top 10 low-expressed and high-expressed microRNAs in tumor tissue were screened and presented. The red and green blocks in the map represent differentially expressed microRNAs (red: high-expressed, green: low-expressed). (c) Kaplan–Meier plots for overall survival for a discriminatory median miR-122 expression, from TCGA sequencing data to assess prognostic accuracy. P values were calculated using the log-rank test. (d) Base pairing complement suggested the putative miR-122 binding position on UCA1. (e) Luciferase reporter assay of BDC cells cotransfected with UCA1-wt or UCA1-mut and miR-122 mimics or the miR-NC. **P < 0.01 compared to the NC group. (f) The relative expression levels of miR-122 in BDC cell lines and normal bile duct epithelial cells were detected by qRT-PCR. **P < 0.01 compared to the HIBEC group. (g) The relative expression levels of miR-122 in 22 pairs of BDC tissues and para-carcinoma tissues were detected by qRT-PCR. **P < 0.01 compared to the para-carcinoma group. (h) Scatter diagram exhibited a negative correlation of UCA1 and miR-122 in 22 pairs of BDC tissues by qRT-PCR. (i) Effects of lnc-UCA1 on expression levels of miR-122 were detected by qRT-PCR after transfection. **P < 0.01 compared to the NC group.
Luciferase reporter assay verified the putative binding position. The luciferase activity was decreased when cells were transfected with miR-122 mimics in the UCA1-wt group, but there were no differences in the UCA1-mut group, suggesting that miR-122 could directly bind to UCA1 and inhibit its expression (Figure 4E). The tendency was similar in the QBC939 and CCLP1 cell lines.
Then, we applied qRT-PCR to measure the expression of miR-122 in the BDC cells CCLP1, QBC939 and human normal intrahepatic bile duct epithelial cell HIBEC, and discovered that miR-122 expression was significantly lower in the BDC cells (Figure 4F, P < 0.01). As shown in Figure 4G, miR-122 expression in the BDC tissues was significantly reduced compared with that of the adjacent tissues (Figure 4G, P < 0.01). A significant negative correlation was found between UCA1 and miR-122 mRNA expression in BDC cells (Figure 4H, P < 0.01). Furthermore, the expression of miR-122 was detected by qRT-PCR after regulation of lnc-UCA1 in BDC cells. The results elucidated that si-UCA1 facilitated miR-122 expression, while UCA1 overexpression reversed this trend (Figure 4I, P < 0.01).
Effects of miR-122 on cell migration, invasion and activation of the ERK/MAPK signaling pathway
To verify the mechanism of miR-122 and targeted lncRNA UCA1 affecting BDC, the transfected cells were divided into three groups: a negative control group (NC), an miR-122 overexpression group (mimics), and an miR-122 mimics+UCA1 overexpression group (mimics+UCA1). Wound healing assays (Figure 5A-B) and Transwell assays (Figure 5C-D) were used to detect migration ability and invasive ability in CCLP1 and QBC939 cells. As illustrated, the migration and invasiveness of BDC cells in the mimics group were decreased (P < 0.01), while that in the mimics+UCA1 group showed no significant difference compared to the NC group, implying that miR-122 repressed the migration and invasiveness of BDC cells, which was reversed by overexpression of UCA1.
Figure 5.

Effects of miR-122 on cell migration and invasion. (a-b) BDC cell migration ability was detected using wound healing assays in CCLP1 and QBC939 cells after transfection for 0 h, 24 h and 48 h. (c-d) Transwell assays were performed to investigate changes in cell invasion ability. Scale bars represent 80 μm.
The relative expression levels of proteins in the ERK/MAPK signaling pathway were detected via western blot. As shown in the results (Figure 6A-B), the overexpressed miR-122 weakened the phosphorylation of ERK and MAPK proteins, thereby blocking ERK/MAPK pathways (P < 0.01); the phosphorylation level in mimics+UCA1 showed no significant difference compared with the NC group. All tendencies in the results were consistent between CCLP1 and QBC939 cells.
Figure 6.
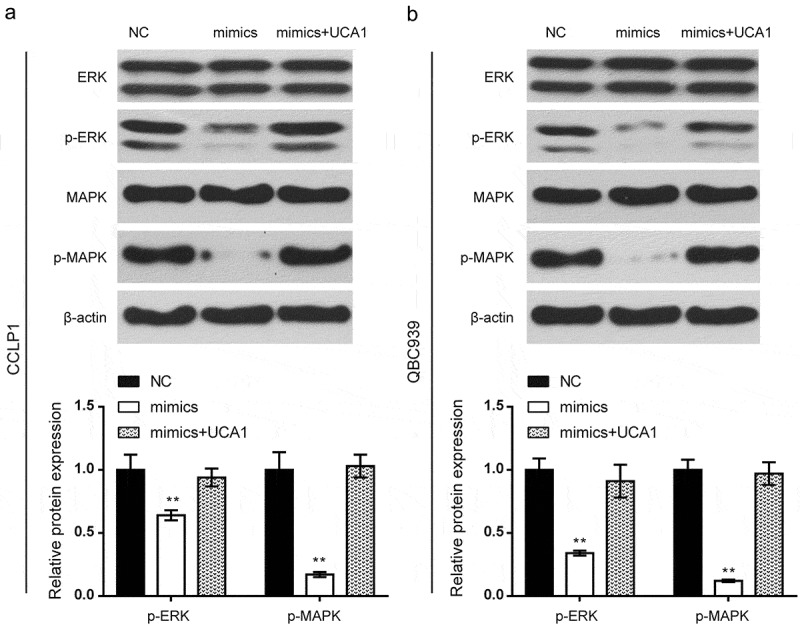
Effects of miR-122 on activation of ERK/MAPK signaling pathway. (a-b) The relative protein expression levels of the ERK/MAPK signaling pathway in the CCLP1 and QBC939 cells were detected by western blot. Compared with the NC group, the overexpressed miR-122 weakened the phosphorylation of ERK and MAPK proteins while the phosphorylation level in mimics+UCA1 group showed no significant difference. All tendency of results was consistent in CCLP1 and QBC939 cells. **P < 0.01 compared to the NC group.
CLIC1 was upregulated in BDC
The volcano map is shown in Figure 7A, in which the dot in red means significantly overexpressed in carcinoma, while a green dot suggests downregulated expression compared with the normal group. The top 10 upregulated and downregulated proteins in tumor tissues are presented in Figure 7B. As shown in the results, CLIC1 was the high-expressed gene in BDC. Kaplan-Meier prognosis analysis demonstrated CLIC1 high expression was associated with a poor survival rate (Figure 7C).
Figure 7.

CLIC1 is upregulated in human bile duct carcinoma. (a) Volcano plot. x-axis: log2 (fold change); y-axis: log10 (P-value). The vertical blue lines correspond to 2.0-fold up and down, and the horizontal blue line represents a P-value of 0.05. The red and green points in the plot represent differentially expressed mRNAs with statistical significance (red: up, green: down). (b) Heat map showing the differential expression and hierarchical clustering of mRNAs between BDC and adjacent normal tissues. The top 10 low-expressed and high-expressed mRNAs in tumor tissue were screened and presented. The red and green blocks in the map represent differentially expressed mRNAs (red: high-expressed, green: low-expressed). (c) Kaplan–Meier plots for overall survival for a discriminatory median CLIC1 expression, from TCGA sequencing data to assess prognostic accuracy. P values were calculated using the log-rank test. (d) Coexpression network of lncRNA-UCA1 with their associated miRNAs and mRNAs. The network is based on the Pearson correlation coefficient, and orange solid lines mean positive correlations while gray dotted lines mean negative correlations.
Coexpression networks of lncRNA-UCA1 with their associated miRNAs and mRNAs were established using the method “pearson” in R package “psych” and graphed using Cytoscape software (Figure 7D). The network is based on the Pearson correlation coefficient (the absolute value of PCC≥0.90, P-value<0.01 and FDR<0.01), and orange solid lines mean positive correlations while gray imaginary lines mean negative correlations. As shown in the results, there was a significant correlation between downregulated miR-122 and the upregulated lncRNA UCA1. The line between miR-122 and upregulated mRNA CLIC1 also suggests a strong negative correlation.
CLIC1 is a target of miR-122
Bioinformatics software miRcode was applied to predict the targeted binding sequences between miR-122 and CLIC1 in Figure 8A. Luciferase reporter assays were conducted to validate the putative binding position. The luciferase activity was decreased when cells were transfected with miR-122 mimics in the CLIC1-wt group but showed no differences in the CLIC1-mut group, demonstrating that miR-122 could directly bind to CLIC1 and inhibit its expression (Figure 8B). The tendency was similar in CCLP1 and QBC939 cells.
Figure 8.

CLIC1 is a target gene of miR-122. (a) Base pairing complement suggested the putative miR-122 binding position in the 3′-UTR of CLIC1. (b) Luciferase reporter assay of BDC cells cotransfected with CLIC1-wt or CLIC1-mut and miR-122 mimics or the miR-NC. **P < 0.01 compared to the NC group. (c) The relative expression levels of CLIC1 in BDC cell lines and normal bile duct epithelial cells were detected by qRT-PCR. **P < 0.01 compared to the HIBEC group. (d) The relative expression levels of CLIC1 in 22 pairs of BDC tissues and para-carcinoma tissues were detected by qRT-PCR. **P < 0.01 compared to the para-carcinoma group. (e) Effects of lnc-UCA1 and miR-122 on expression levels of CLIC1 were detected by qRT-PCR after transfection. **P < 0.01 compared to the NC group. (f) Scatter diagram exhibited a negative correlation of CLIC1 and miR-122 in 22 pairs of BDC tissues by qRT-PCR.
Then, qRT-PCR was utilized to detect the expression of CLIC1 in the BDC cells CCLP1, QBC939 and human normal intrahepatic bile duct epithelial cell HIBEC, which showed that CLIC1 was remarkably overexpressed in the BDC cells (Figure 8C, P < 0.01). The expression levels of CLIC1 in the samples of BDC tissue and the adjacent samples were also detected in Figure 8D. CLIC1 in the BDC tissues were strikingly overexpressed in comparison to that of adjacent tissues (P < 0.01). The expression of CLIC1 was detected by qRT-PCR after regulation by lnc-UCA1 and miR-122 in BDC cells. The results elucidated that UCA1 overexpression or miR-122 inhibitors facilitated CLIC1 expression, while miR-122 mimics or si-UCA1 reversed this trend (Figure 8E, P < 0.01). The expression of CLIC1 showed no significant difference when upregulated UCA1 and miR-122 were simultaneously compared with the NC group. The scatter diagram exhibited a negative correlation between CLIC1 and miR-122 in 22 pairs of BDC tissues by qRT-PCR (Figure 8F, P < 0.01).
Effects of CLIC1 on cell migration, invasion and activation of the ERK/MAPK signaling pathway
There were five groups of transfected cells: negative control group (NC), CLIC1 downregulated group (siCLIC1), CLIC1 overexpressed group (CLIC1), miR-122 mimics+CLIC1 overexpressed group (mimics+CLIC1), and UCA1 knockdown+CLIC1 overexpressed group (siUCA1+ CLIC1). Wound healing assays (Figure 9A-B) and Transwell assays (Figure 9C-D) were used to detect migration ability and invasive ability in CCLP1 and QBC939 cells. As shown in the results, the migration ability and invasive ability of cells in the siCLIC1 group were decreased, while that in the CLIC1 group were increased (P < 0.01). There was no obvious disparity among mimics+CLIC1, siUCA1+ CLIC1 and the NC group, suggesting that CLIC1 enhanced the migration and invasiveness of BDC cells, whereas the administration of miR-122 mimics or knockdown of UCA1 resulted in the opposite effect.
Figure 9.
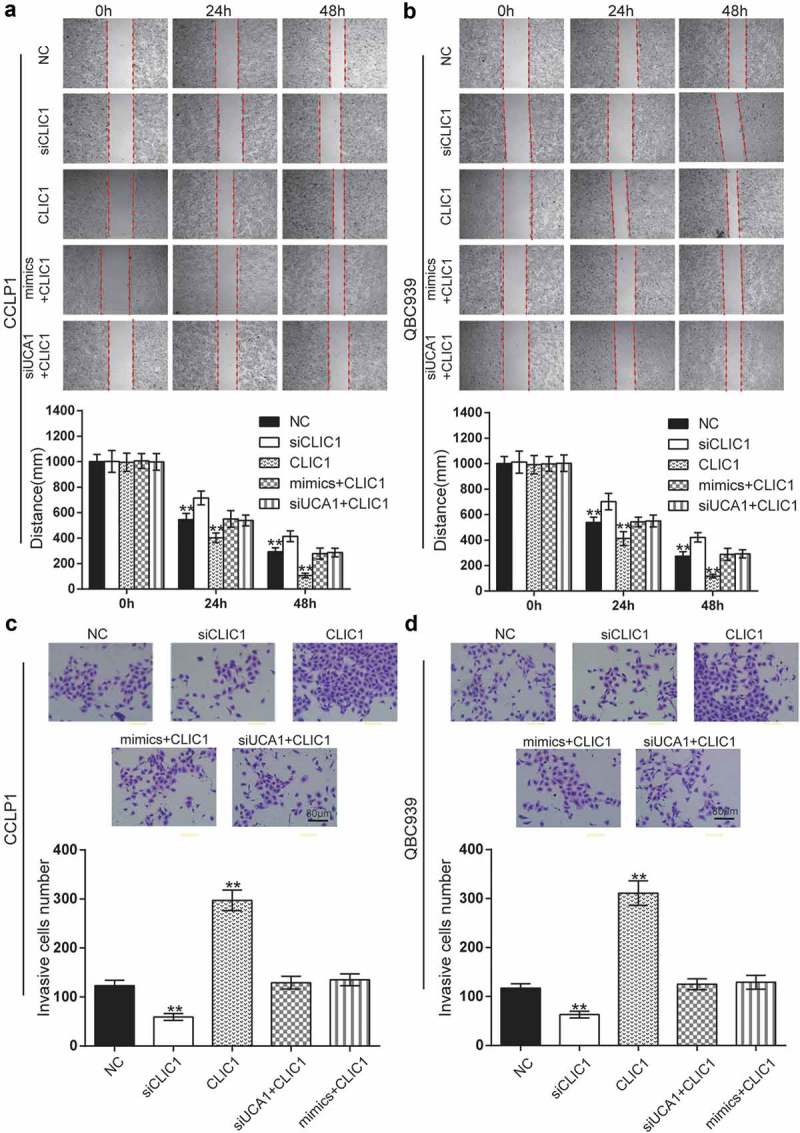
Effects of CLIC1 on cell migration and invasion in BDC. (a-b) BDC cell migration ability was detected using wound healing assays in CCLP1 and QBC939 cells after transfection for 0 h, 24 h and 48 h. (c-d) Transwell assays were performed to investigate changes in cell invasion ability. Scale bars represent 80 μm. **P < 0.01 compared to the NC group.
The relative protein expression levels of the ERK/MAPK signaling pathway were estimated via western blotting. As shown in the results (Figure 10A-B), the knockdown of CLIC1 weakened the phosphorylation of ERK and MAPK proteins, thereby blocking ERK/MAPK pathways (P < 0.01), while the overexpression of CLIC1 enhanced the phosphorylation of ERK and MAPK proteins, thereby activating ERK/MAPK pathways (P < 0.01); the phosphorylation level in mimics+CLIC1 and siUCA1+ CLIC1 groups showed no significant difference compared with the NC group. All tendencies of the results were consistent in CCLP1 and QBC939 cells.
Figure 10.

Effects of CLIC1 on activation of ERK/MAPK signaling pathway. (a-b) The relative protein expression levels of the ERK/MAPK signaling pathway in CCLP1 and QBC939 cells were detected by western blotting. Compared with the NC group, the knockdown of CLIC1 weakened the phosphorylation of ERK and MAPK proteins while the overexpression of CLIC1 enhanced the phosphorylation of ERK and MAPK proteins, and the phosphorylation level in mimics+CLIC1 and siUCA1+ CLIC1 groups showed no significant difference. All tendency of results were consistent in the CCLP1 and QBC939 cells. **P < 0.01 compared to the NC group.
Discussion
Because of the unsatisfactory prognosis of BDC, a growing number of studies have been devoted to reveal the pathogenesis of BDC and develop effective treatment agents. In this study, we identified one of the pathological mechanisms of BDC and explored its effects via bioinformatics analysis and in vitro experiments. The leading actor in the present study is lncRNA-UCA1. On the basis of our results, lncRNA-UCA1 works as a promotor of metastasis of BDC via regulating miR-122/CLIC1 and activating the ERK/MAPK signaling pathway. The target relationships of lncRNA-UCA1/miR-122 and miR-122/CLIC1 were confirmed in our study. Furthermore, both lncRNA-UCA1 and CLIC1 could enhance the migrant and invasive abilities in BDC while miR-122 had the converse functions.
In the present research, the overexpression of lncRNA-UCA1 was detected in BDC tumors and two cell lines: CCLP1 and QBC939. Upregulation of lncRNA-UCA1 was a powerful promotor of migration and invasiveness of BDC cells.
There is only one previous study about lncRNA-UCA1 in BDC. The study of Xu et al. pointed out that UCA1 plays an oncogenic role in cholangiocarcinoma cell growth, cell cycle, apoptosis, migration, invasion and epithelial-to-mesenchymal transition (EMT) via activation of the AKT/GSK-3β signaling pathway. Based on their research, we further studied the downstream ceRNA mechanisms, which might be different from the AKT/GSK-3β signaling pathway [PMID: 29221199]. We obtained similar results to other research on human cancers. For instance, Yang, X et al. have elucidated that lncRNA-UCA1 is upregulated in colorectal cancer (CRC) tissues and cells. In addition, knockdown of lncRNA-UCA1 inhibited the migration of CRC cells after irradiation [21]. In a liver cancer cell line, silencing of lncRNA-UCA1 weakened the migration ability of cells. In addition, Zhu, G et al. have found that lncRNA-UCA1 could regulate miR-301a expression [22]. Taken together, lncRNA-UCA1 overexpression is related to the malignancy of BDC and other human cancers.
Not only lncRNAs but also miRNAs have effects on BDC and could serve as excellent biomarkers. miRNA-122 was once suggested as a biomarker of cholangiocarcinoma [23]. In in vitro experiments, we found that overexpression of miR-122 dampened both invasiveness and the migration of BDC cells, which was consistent with the conclusions of a study by Xu, Z et al. [4]. Apart from that finding, the expression level of miR-122 was reduced in BDC tissues. A negative relationship between miR-122 and lncRNA-UCA1 has been reported in glioma cells [24]. Clearly, these RNAs negatively interact with each other in BDC, as well. Based on our results, miR-122 serves as a tumor suppressor in BDC. Other studies have confirmed this point in gastric and bladder cancers [25,26]. However, the role of miR-122 in clear cell renal cell carcinoma (ccRCC) was the complete opposite. Fan, Y et al. have indicated that miR-122 contributed to metastasis of ccRCC by regulating Dicer [27]. Furthermore, high level expression of miR-122 promoted malignant phenotypes in ccRCC [28]. The changing roles of miR-122 might result from sophisticated interactions in diverse tumor tissues.
To the best of our knowledge, only one previous report has directly indicated a target relationship between miRNA and CLIC1. Zhou N et al. showed that CLIC1 might be a direct target gene of miR-372 [29]. In our study, we discovered that miR-122 could target CLIC1, while the level of CLIC1 was upregulated with overexpression of lncRNA-UCA1. Even when lncRNA-UCA1 was absent, CLIC1 was highly expressed in BDC cells and tumor tissues. More importantly, CLIC1 had a strong effect on the invasiveness and migration of BDC cells. Therefore, we suggested that CLIC1 acted as a promotor of BDC metastasis. The effect of CLIC1 has been explored and reported previously; thus, we could derive confirmation from other human cancers. Both in colon cancer and gastric cancer, inhibition of CLIC1 led to a significant decline of invasive and migrant cell numbers [30,31]. Surprisingly, depletion of CLIC1 promoted invasiveness and migration in esophageal squamous cell carcinoma, where CLIC1 functioned as a tumor suppressor [32]. The main cause of this difference remains a mystery. Therefore, further investigations are needed to reveal the underlying mechanisms.
Recently, one hypothesis for assigning lncRNA function that is gaining notable attention is the ceRNA. The competing endogenous RNA (ceRNA) hypothesis posits that specific RNAs can impair microRNA (miRNA) activity through sequestration, thereby upregulating miRNA target gene expression [PMID: 27040487]. It has been shown that lncRNAs function as competing endogenous RNAs (ceRNAs) by binding to and sequestering specific miRNAs in a type of target mimicry to protect the target mRNAs from repression in both plants and animals [PMID: 25517485]. In our study, the target relationship between UCA1 and miR-122 was verified by a dual-luciferase reporter assay and further studied in cell experiments, indicating the regulating effect of UCA1 on miR-122, and the results indicated that UCA1 acts as a ceRNA upregulating the expression of CLIC1 via the inhibition of miR-122.
It is well-known that ERK/MAPK can promote cancer metastasis, such as in prostate cancer [PMID: 17030190], colon cancer [PMID: 24880666], and melanomas [PMID: 22172720] and indicates that the pSmad3L kinase (MAPK) and p44/42 mitogen-activated protein kinase (ERK1/2) [PMID: 22729936]. CLIC1 was confirmed to upregulate relative protein expressions in the ERK/MAPK signaling pathway [33]. In fact, some lncRNAs have been demonstrated to modulate this signaling pathway, such as lncRNA BANCR and lncRNA MALAT1 [34,35]. As displayed in western blots, lncRNA-UCA1 and CLIC1 contributed to phosphorylation of ERK and MAPK, activating the ERK/MAPK signaling pathway. Clearly, miR-122 inhibited this pathway. These results indicated that the ERK/MAPK signaling pathway might be of importance in the pathogenesis of BDC.
We are the first to reveal the effect of lncRNA-UCA1 and CLIC1 on BDC. We also found that both lncRNA-UCA1 and CLIC1 could regulate the ERK/MAPK signaling pathway in BDC. To offer more convincing results, we carried out vitro experiments in two BDC cell lines at the same time. In spite of these advantages, some limitations should be taken into consideration. Even though we had conducted experiments in two cell lines, the design of si-lncRNA-UCA1 and si-CLIC1 seemed unreasonable and we should have set three different si-groups for lncRNA-UCA1 and CLIC1. Second, we did not further confirm our results through mice experiments.
In summary, lncRNA-UCA1 promoted metastasis of BDC cells by regulating miR-122/CLIC1 and activating the ERK/MAPK signaling pathway. LncRNA-UCA1 might play an important part in the pathogenesis of BDC and could serve as a useful biomarker to improve diagnosis and prognosis. More studies are needed to disclose the underlying interactions of lncRNA-UCA1 in BDC and other human cancers.
Funding Statement
Methylation analysis of tumor suppressor genes in gallbladder carcinoma and its value in early diagnosis of gallbladder carcinoma (2017-KY-01);Methylation analysis of tumor suppressor genes in gallbladder carcinoma and its value in early diagnosis of gallbladder carcinoma [2017-KY-01].
Disclosure statement
No potential conflict of interest was reported by the authors.
Ethical approval
All procedures performed in studies involving human participants were in accordance with the ethical standards of Shanghai Fourth People’s Hospital.
References
- [1].Shimonishi T, Sasaki M, Nakanuma Y.. Precancerous lesions of intrahepatic cholangiocarcinoma. J Hepatobiliary Pancreat Surg. 2000;7:542–550. [DOI] [PubMed] [Google Scholar]
- [2].Kim E, Kim YJ, Kim K, et al. Salvage radiotherapy for locoregionally recurrent extrahepatic bile duct cancer after radical surgery. Br J Radiol. 2017;90:20170308. [DOI] [PMC free article] [PubMed] [Google Scholar]
- [3].Joo I, Lee JM.. Imaging bile duct tumors: pathologic concepts, classification, and early tumor detection. Abdom Imaging. 2013;38:1334–1350. [DOI] [PubMed] [Google Scholar]
- [4].Xu Z, Liu G, Zhang M, et al. miR-122-5p Inhibits the proliferation, invasion and growth of bile duct carcinoma cells by targeting ALDOA. Cell Physiol Biochem. 2018;48:2596–2606. [DOI] [PubMed] [Google Scholar]
- [5].Ishigami K, Nosho K, Koide H, et al. MicroRNA-31 reflects IL-6 expression in cancer tissue and is related with poor prognosis in bile duct cancer. Carcinogenesis. 2018;39:1127–1134. [DOI] [PubMed] [Google Scholar]
- [6].Lu X, Zhou C, Li R, et al. Long noncoding RNA AFAP1-AS1 promoted tumor growth and invasion in cholangiocarcinoma. Cell Physiol Biochem. 2017;42:222–230. [DOI] [PubMed] [Google Scholar]
- [7].Shi X, Zhang H, Wang M, et al. LncRNA AFAP1-AS1 promotes growth and metastasis of cholangiocarcinoma cells. Oncotarget. 2017;8:58394–58404. [DOI] [PMC free article] [PubMed] [Google Scholar]
- [8].Wang WT, Ye H, Wei PP, et al. LncRNAs H19 and HULC, activated by oxidative stress, promote cell migration and invasion in cholangiocarcinoma through a ceRNA manner. J Hematol Oncol. 2016;9:117. [DOI] [PMC free article] [PubMed] [Google Scholar]
- [9].Ni B, Yu X, Guo X, et al. Increased urothelial cancer associated 1 is associated with tumor proliferation and metastasis and predicts poor prognosis in colorectal cancer. Int J Oncol. 2015;47:1329–1338. [DOI] [PubMed] [Google Scholar]
- [10].Fotouhi Ghiam A, Taeb S, Huang X, et al. Long non-coding RNA urothelial carcinoma associated 1 (UCA1) mediates radiation response in prostate cancer. Oncotarget. 2017;8:4668–4689. [DOI] [PMC free article] [PubMed] [Google Scholar]
- [11].Piontek K, Selaru FM. MicroRNAs in the biology and diagnosis of cholangiocarcinoma. Semin Liver Dis. 2015;35:55–62. [DOI] [PubMed] [Google Scholar]
- [12].Li H, Zhou ZQ, Yang ZR, et al. MicroRNA-191 acts as a tumor promoter by modulating the TET1-p53 pathway in intrahepatic cholangiocarcinoma. Hepatology. 2017;66:136–151. [DOI] [PubMed] [Google Scholar]
- [13].Han Y, Meng F, Venter J, et al. miR-34a-dependent overexpression of Per1 decreases cholangiocarcinoma growth. J Hepatol. 2016;64:1295–1304. [DOI] [PMC free article] [PubMed] [Google Scholar]
- [14].Bandiera S, Pfeffer S, Baumert TF, et al. miR-122–a key factor and therapeutic target in liver disease. J Hepatol. 2015;62:448–457. [DOI] [PubMed] [Google Scholar]
- [15].Xu Q, Zhang M, Tu J, et al. microRNA-122 affects cell aggressiveness and apoptosis by targeting PKM2 in human hepatocellular carcinoma. Oncol Rep. 2015;34:2054–2064. [DOI] [PubMed] [Google Scholar]
- [16].Thakral S, Ghoshal K. miR-122 is a unique molecule with great potential in diagnosis, prognosis of liver disease, and therapy both as miRNA mimic and antimir. Curr Gene Ther. 2015;15:142–150. [DOI] [PMC free article] [PubMed] [Google Scholar]
- [17].Li BP, Mao YT, Wang Z, et al. CLIC1 promotes the progression of gastric cancer by regulating the MAPK/AKT pathways. Cell Physiol Biochem. 2018;46:907–924. [DOI] [PubMed] [Google Scholar]
- [18].Wu J, Wang D. CLIC1 induces drug resistance in Human choriocarcinoma through positive regulation of MRP1. Oncol Res. 2017;25:863–871. [DOI] [PMC free article] [PubMed] [Google Scholar]
- [19].He YM, Zhang ZL, Liu QY, et al. Effect of CLIC1 gene silencing on proliferation, migration, invasion and apoptosis of human gallbladder cancer cells. J Cell Mol Med. 2018;22:2569–2579. [DOI] [PMC free article] [PubMed] [Google Scholar] [Retracted]
- [20].Wei X, Li J, Xie H, et al. Chloride intracellular channel 1 participates in migration and invasion of hepatocellular carcinoma by targeting maspin. J Gastroenterol Hepatol. 2015;30:208–216. [DOI] [PubMed] [Google Scholar]
- [21].Yang X, Liu W, Xu X, et al. Downregulation of long noncoding RNA UCA1 enhances the radiosensitivity and inhibits migration via suppression of epithelialmesenchymal transition in colorectal cancer cells. Oncol Rep. 2018;40:1554–1564. [DOI] [PubMed] [Google Scholar]
- [22].Zhu G, Liu X, Su Y, et al. Knockdown of urothelial carcinoma associated 1 suppressed cell growth and migration through regulating miR-301a and CXCR4 in osteosarcoma MHCC97 cells. Oncol Res. 2018;27:55–64. [DOI] [PMC free article] [PubMed] [Google Scholar] [Retracted]
- [23].Zheng B, Jeong S, Zhu Y, et al. miRNA and lncRNA as biomarkers in cholangiocarcinoma(CCA). Oncotarget. 2017;8:100819–100830. [DOI] [PMC free article] [PubMed] [Google Scholar]
- [24].Sun Y, Jin JG, Mi WY, et al. Long noncoding RNA UCA1 targets miR-122 to promote proliferation, migration, and invasion of glioma cells. Oncol Res. 2018;26:103–110. [DOI] [PMC free article] [PubMed] [Google Scholar]
- [25].Xu X, Gao F, Wang J, et al. miR-122-5p inhibits cell migration and invasion in gastric cancer by down-regulating DUSP4. Cancer Biol Ther. 2018;19:427–435. [DOI] [PMC free article] [PubMed] [Google Scholar]
- [26].Wang Y, Xing QF, Liu XQ, et al. miR-122 targets VEGFC in bladder cancer to inhibit tumor growth and angiogenesis. Am J Transl Res. 2016;8:3056–3066. [PMC free article] [PubMed] [Google Scholar]
- [27].Fan Y, Ma X, Li H, et al. miR-122 promotes metastasis of clear-cell renal cell carcinoma by downregulating dicer. Int J Cancer. 2018;142:547–560. [DOI] [PubMed] [Google Scholar]
- [28].Jingushi K, Kashiwagi Y, Ueda Y, et al. High miR-122 expression promotes malignant phenotypes in ccRCC by targeting occludin. Int J Oncol. 2017;51:289–297. [DOI] [PubMed] [Google Scholar]
- [29].Zhou N, Cheng W, Peng C, et al. Decreased expression of hsamiR372 predicts poor prognosis in patients with gallbladder cancer by affecting chloride intracellular channel 1. Mol Med Rep. 2017;16:7848–7854. [DOI] [PubMed] [Google Scholar]
- [30].Wang P, Zeng Y, Liu T, et al. Chloride intracellular channel 1 regulates colon cancer cell migration and invasion through ROS/ERK pathway. World J Gastroenterol. 2014;20:2071–2078. [DOI] [PMC free article] [PubMed] [Google Scholar]
- [31].Ma PF, Chen JQ, Wang Z, et al. Function of chloride intracellular channel 1 in gastric cancer cells. World J Gastroenterol. 2012;18:3070–3080. [DOI] [PMC free article] [PubMed] [Google Scholar]
- [32].Kobayashi T, Shiozaki A, Nako Y, et al. Chloride intracellular channel 1 as a switch among tumor behaviors in human esophageal squamous cell carcinoma. Oncotarget. 2018;9:23237–23252. [DOI] [PMC free article] [PubMed] [Google Scholar]
- [33].Tian Y, Guan Y, Jia Y, et al. Chloride intracellular channel 1 regulates prostate cancer cell proliferation and migration through the MAPK/ERK pathway. Cancer Biother Radiopharm. 2014;29:339–344. [DOI] [PubMed] [Google Scholar]
- [34].Wang D, Wang D, Wang N, et al. Long non-coding RNA BANCR promotes endometrial cancer cell proliferation and invasion by regulating MMP2 and MMP1 via ERK/MAPK signaling pathway. Cell Physiol Biochem. 2016;40:644–656. [DOI] [PubMed] [Google Scholar]
- [35].Han Y, Wu Z, Wu T, et al. Tumor-suppressive function of long noncoding RNA MALAT1 in glioma cells by downregulation of MMP2 and inactivation of ERK/MAPK signaling. Cell Death Dis. 2016;7:e2123. [DOI] [PMC free article] [PubMed] [Google Scholar]