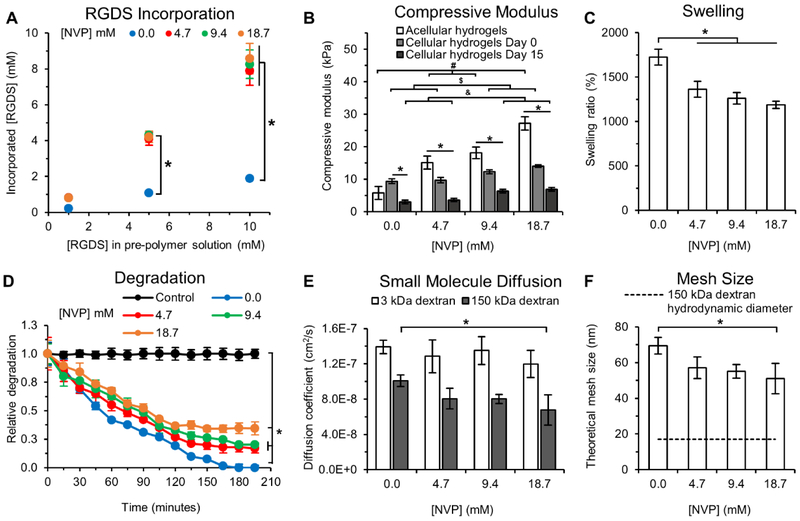
Fig. 2: Hydrogel Characterization.
(A) RGDS incorporation into PEG-PQ hydrogels as a function of NVP and PEG-RGDS concentration in the pre-polymer solution. NVP enhanced PEG-RGDS coupling resulting in an incorporation efficiency of 82.3 ± 2.5% which is significantly higher than 20.4 ± 1.1% achieved without NVP. * indicates p<0.05. n=4 hydrogels per formulation. (B) Compressive modulus of acellular and cell-laden hydrogels as a function of NVP concentration and cell culture time. Acellular hydrogels with increasing NVP concentration displayed a linear increase in the compressive modulus from 5.8 ± 2.0 kPa to 27.2 ± 2.1 kPa for the 0 and 18.7 mM NVP groups respectively. Day 0, cell-laden hydrogels functionalized with 1 mM RGDS displayed reduced stiffness compared to acellular hydrogels, except for the 0 mM NVP group, and exhibited a moderate linear increase in the compressive modulus with increased NVP concentration from 9.4 ± 0.8 kPa to 14.0 ± 0.4 kPa for the 0 and 18.7 mM NVP groups respectively. By day 15, cell-laden hydrogels were significantly softer than their acellular and day 0 counterparts but still maintained a moderate increase in elastic modulus with increased NVP. #, $, & indicates p<0.05 between acellular hydrogels, cellular (day 0) and cellular (day 15) hydrogels respectively; * indicates p<0.05 between acellular, cellular (day 0) and cellular (day 15) hydrogels for each NVP concentration. n=3 hydrogels per condition. (C) Hydrogel swelling as a function of NVP concentration. Hydrogels with 4.7-18.7 mM NVP displayed lower swelling compared to those without NVP. * indicates p<0.05. n=4 hydrogels per condition. (D) Hydrogel degradation as a function of NVP concentration. NVP incorporation significantly reduced degradability of PEG-PQ hydrogels exposed to collagenase IV in a NVP concentration-dependent manner. The control condition refers to hydrogels with 0 mM NVP incubated in PBS without collagenase to account for photobleaching. * indicates p<0.05. n=4 hydrogels per condition. (E) The effective diffusion coefficient was calculated for 3 kDa and 150 kDa FITC-labeled dextran from release studies. Diffusion of 3 kDa FITC-dextran was not influenced by NVP but diffusion of 150 kDa FITC-dextran was impeded via addition of NVP. (F) The theoretical mesh size of hydrogel networks calculated from release studies of 150 kDa FITC-labeled dextran. A gradual reduction in mesh size with increasing NVP concentration was observed. Dashed line indicates the hydrodynamic diameter of 150 kDa dextran based on the Stokes-Einstein equation. * indicates p<0.05. n=4 hydrogels per condition. All values represent mean ± standard deviation.

