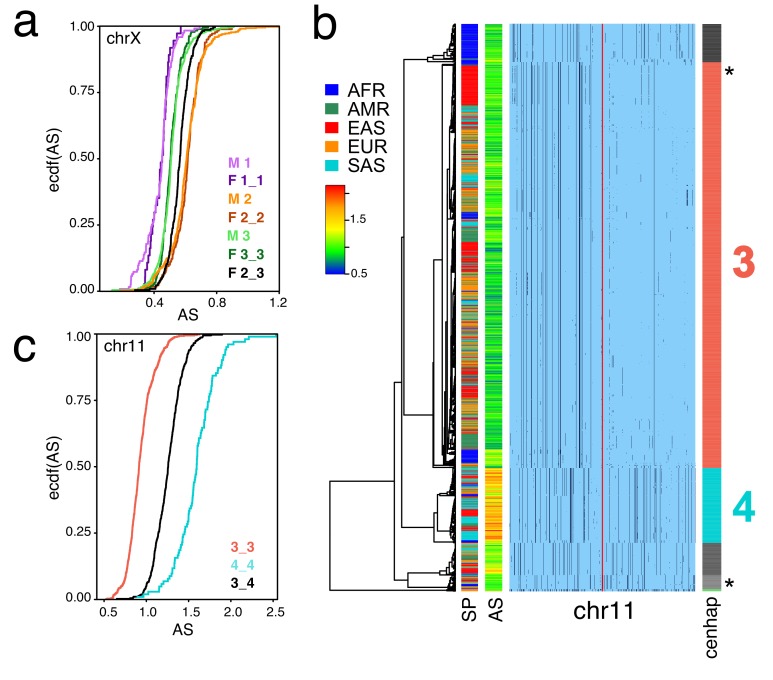
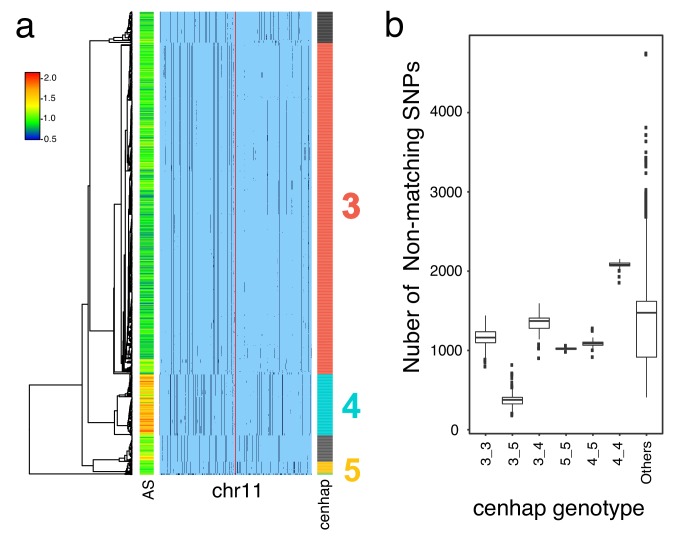
Figure 4. Cenhaps differ in α-satellite array size.
A full resolution version of this figure is available as Figure 4—source data 1. (a) Empirical cumulative densities (ecdf) of chrX α-satellite array size for cenhap homozygotes and heterozygotes (see Figure 1b for cenhap designations). 1_2 and 1_3 heterozygotes were excluded due to insufficient data. Female (F) values were normalized (x 0.5) to facilitate plotting with hemizygote male (M) data. (b) Haplotypic representation of 1000 SNPs from 1546 imputed chr11 genotypes from 773 cenhap-homozygous individuals. SNPs were filtered for MAC ≥ 35 and passing the 4gt_dco with a tolerance of 3. Minor alleles shown in black. Assembly gap indicated by red line. Superpopulation (SP) and scaled chr11-specific α-satellite array size (AS) at left. Cenhap partitions at right; most common cenhap ‘3’ and cenhap with larger mean array size ‘4’ are highlighted. Most probable HuRef cenhap genotypes are indicated by black asterisks at right. (c) Empirical cumulative density of array size for chr11 cenhap (from b) homozygotes (3_3 and 4_4) and heterozygotes (3_4).


