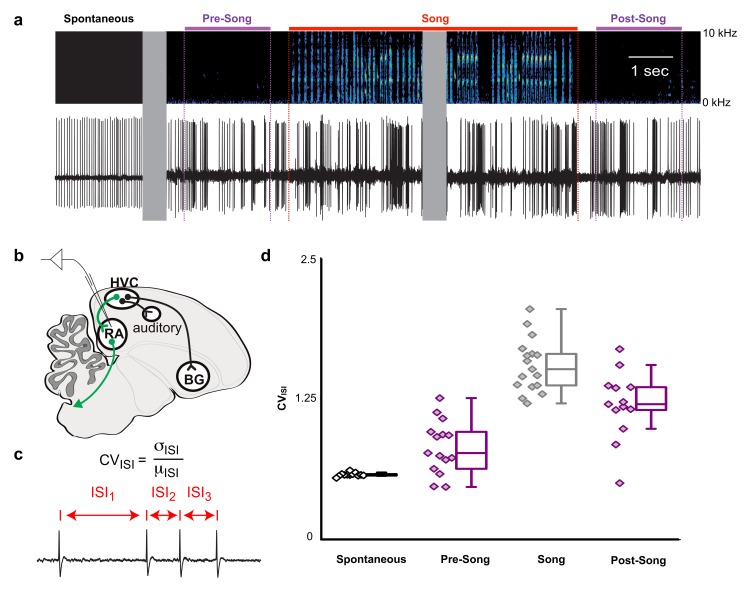
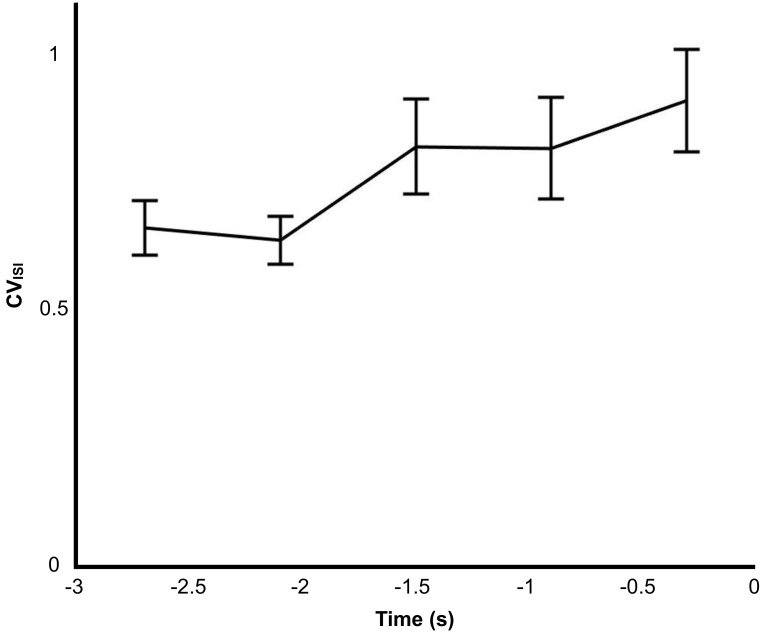
Figure 5. Pre-song and post-song firing in RA of Bengalese finches.
(a) Example extracellular recording from a single RA neuron. Colored lines highlight four epochs (pre-song (purple), song (red), and post-song (purple)) relative to the beginning and ending of a song phrase (see main text). Gray areas indicate discontinuities in time (pauses between ‘spontaneous’ epoch and song initiation and within the middle portion of the song bout). (b) Schematic of recording site. (c) We quantified inter-spike-intervals (ISIs) and computed the coefficient of variation (CV) in each epoch. (d) We found significantly higher ISI variability in the pre-song epoch (purple with diamonds) compared to spontaneous (p<0.005, two-sided K-S test). Box plots show the median, 25th and 75th percentiles with whiskers showing ±1.5 IQR.


