Abstract
Vertebrate genomes exhibit marked CG-suppression, that is lower than expected numbers of 5′-CG-3′ dinucleotides1. This feature is likely due to C-to-T mutations that have accumulated over hundreds of millions of years, driven by CG-specific DNA methyl transferases and spontaneous methyl-cytosine deamination. Remarkably, many RNA viruses of vertebrates that are not substrates for DNA methyl transferases mimic the CG-suppression of their hosts2–4. This striking property of viral genomes is unexplained4–6. In a synonymous mutagenesis experiment, we found that CG-suppression is essential for HIV-1 replication. The deleterious effect of CG dinucleotides on HIV-1 replication was cumulative, evident as cytoplasmic RNA depletion, and exerted by CG dinucleotides in both translated and non-translated exonic RNA sequences. A focused siRNA screen revealed that zinc finger antiviral protein (ZAP)7 inhibited virion production by cells infected with CG-enriched HIV-1. Crucially, HIV-1 mutants containing segments whose CG-content mimicked random sequence were defective in unmanipulated cells, but replicated normally in ZAP-deficient cells. Crosslinking-immunoprecipitation-sequencing assays demonstrated that ZAP binds directly and selectively to RNA sequences containing CG dinucleotides. These findings suggest that ZAP exploits host CG-suppression to discriminate non-self RNA. The dinucleotide composition of HIV-1, and perhaps other RNA viruses, appears to have adapted to evade this host defense.
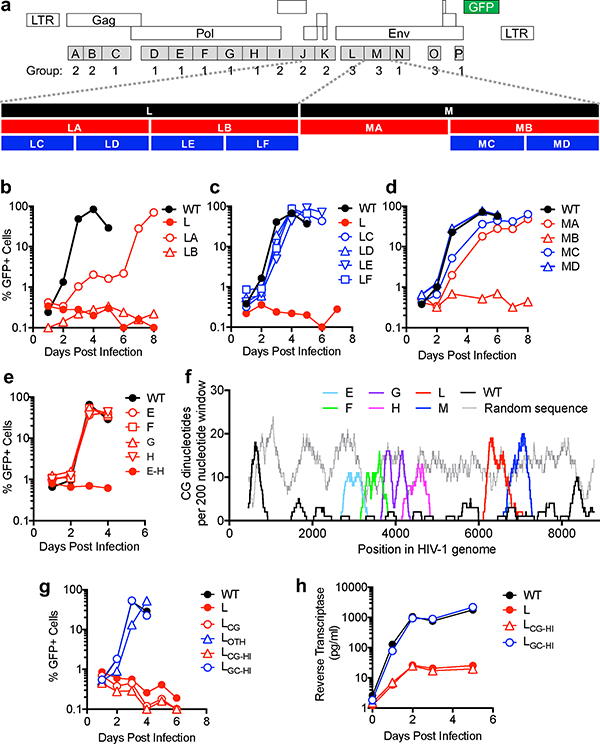
To discover cis-acting RNA elements within the HIV-1 genome that are important for its replication, we generated a mutant HIV-1 sequence containing the maximum number of synonymous mutations in open reading frames (ORFs). Blocks of mutations (mean of ~125 mutations/block) were represented in 16 proviral plasmids (A through P) containing a gfp reporter (Fig. 1a). Group 1 mutants displayed near-normal viral replication and Group 2 mutants were defective, exhibiting severe splicing defects (unpublished observations). Group 3 mutants yielded near normal infectious titers when proviral plasmids were transfected in 293T cells and lacked an obvious splicing defect, but were defective in spreading replication assays (Extended data Fig. 1a, Fig. 1b, c,).
Figure 1. Synonymous mutagenesis reveals inhibitory effects of CG dinucleotides on HIV-1 replication.
a, Representation of HIV-1NHG GFP provirus, indicating synonymous mutant blocks, and corresponding phenotypes (see text). b–e, Replication of HIV-1 mutants in MT4 cells, as measured by FACS enumeration of infected cells. f, Number of CG dinucleotides in a 200 nucleotide sliding window in viral and random sequences. g, Replication of HIV-1 mutants in MT4 cells, measured as in b. h, Replication of HIV-1 mutants in primary lymphocytes, measured by supernatant reverse transcriptase activity.
Mapping experiments employing derivatives of the defective group 3 mutant viruses L and M, revealed that their replication defects were not caused by perturbation of a single discrete element. Indeed, mutants LC, LD, LE, LF, MA, MC, and MD, that contained smaller mutant segments collectively representing all mutations in L and M, each replicated with near HIV-1WT kinetics (Fig 1a,b,c,d). Moreover, when the mutations in four replication-competent pol mutants (E though H, Fig. 1a) were combined, the resulting mutant virus (EH) was defective (Fig. 1e). Thus, HIV-1 replication defects were induced by cumulative effects of synonymous mutations in pol or env.
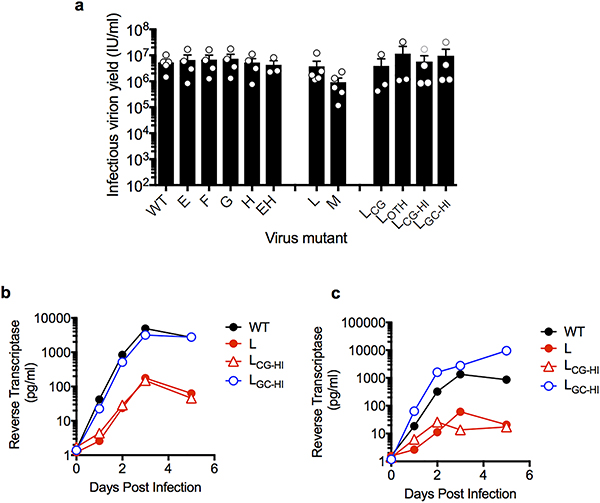
The HIV-1 genome is sparse in C mononucleotides8 and, like many vertebrate viruses2–4, is particularly deficient in CG dinucleotides, (Fig. 1f). Our synonymous mutagenesis coincidentally increased the CG dinucleotide content in mutant segments, to a level similar to that of random sequence (Fig. 1f). We generated derivatives of mutant L, termed LCG and LOTH, respectively, containing only mutations that generated new CG dinucleotides (37/145 original mutations) or the 108 other mutations (Supplementary data 1). We also generated mutants that maximized the CG or, as a further control, GC dinucleotide content in the same segment (LCG-HI and LGC-HI) (Extended Data Table 1). These proviral plasmids each yielded similar levels of infectious virus following transfection of 293T cells (Extended data Fig 1a). However, LCG and LCG-HI were defective in MT4 cells, while LOTH and LGC-HI replicated with near HIV-1WT kinetics (Fig. 1g). Mutants L and LCG-HI also replicated at ~100-fold lower levels than HIV-1WT and LGC-HI in primary lymphocytes (Fig. 1h, Extended Data Fig. 1b, c). Thus, suppression of CG but not GC dinucleotides appears essential for HIV-1 replication.
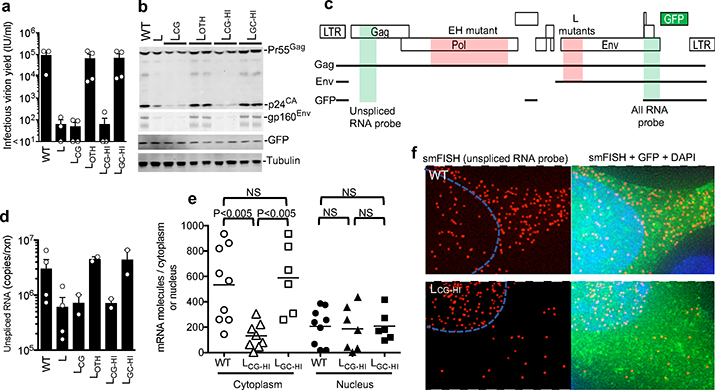
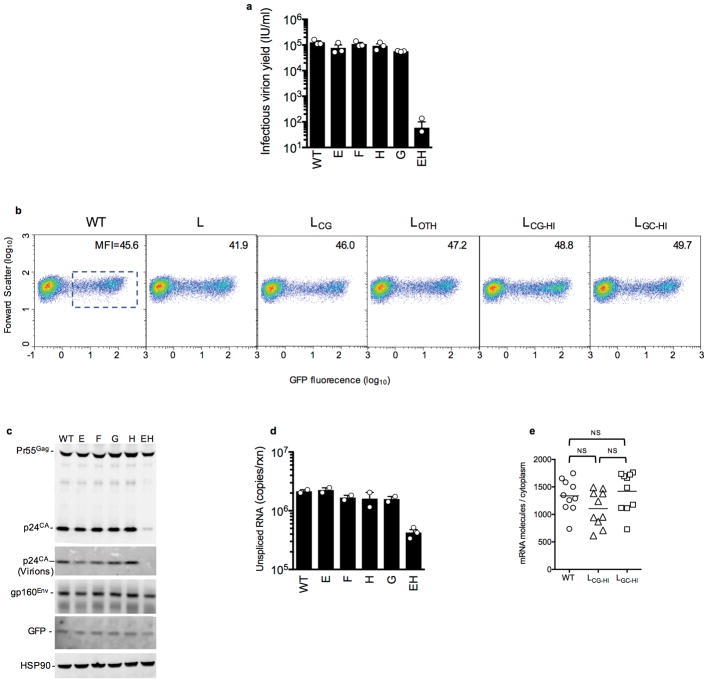
To understand the basis for replication defects in the CG-enriched HIV-1 mutants, we infected MT4 cells with equal titers of each virus in single-cycle replication experiments. Notably L, LCG and LCG-HI infected cells generated ~1000-fold fewer infectious progeny virions than LOTH and LGC-HI infected cells (Fig. 2a). Infectious virion yields from EH infected cells were similarly reduced (Extended data Fig. 2a). Western blot analyses revealed reduced levels of Gag and Env proteins in cells infected with L, LCG and LCG-HI, but HIV-1WT levels for LOTH and LGC-HI (Fig. 2b). Expression of the gfp reporter that was embedded in the nef gene and therefore expressed via an mRNA from which the L segment is removed by splicing (Fig 2c) was equivalent for each virus, (Fig 2b, Extended data Fig. 2b). A deficit in Gag protein levels also occurred in EH infected cells. However, normal levels of both Env and GFP proteins, whose spliced mRNAs lack the CG-enriched EH segment, were generated (Extended Data Fig. 2c).
Figure 2. CG dinucleotides cause depletion of cytoplasmic RNA.
a, Single-cycle infectious virus yield, following infection of MT4 cells with equal titers of HIV-1WT and mutants (mean ± sem n=3 independent experiments). b, Western blot analysis 48h after a single-cycle infection of MT4 cells with WT and mutant HIV-1, representative of 3 experiments. c, Location of salient exons (black lines), mutated segments (red shading) and smFISH probes (green shading) in HIV-1 mRNAs. d, Q-RT-PCR quantification of unspliced RNA in MT4 cells in a single-cycle infection assay (mean ± sem n= 2 or 4 independent experiments). e, Quantification of unspliced RNA (fluorescent spots) by smFISH in cytoplasm and nucleus of infected HOS/CD4-CXCR4 cells. Each symbol represents an individual cell nucleus or cytoplasm. Horizontal lines = mean. P-values determined using Mann-Whitney test, n=6, 8 or 9 individual cells. NS = not significant. f, Examples of smFISH analysis of an HIV-1WT and mutant infected cell (red=smFISH gag probe, green=GFP, blue=Hoescht dye). Blue line indicates nucleus/cytoplasm boundary. Representative of 3 independent experiments.
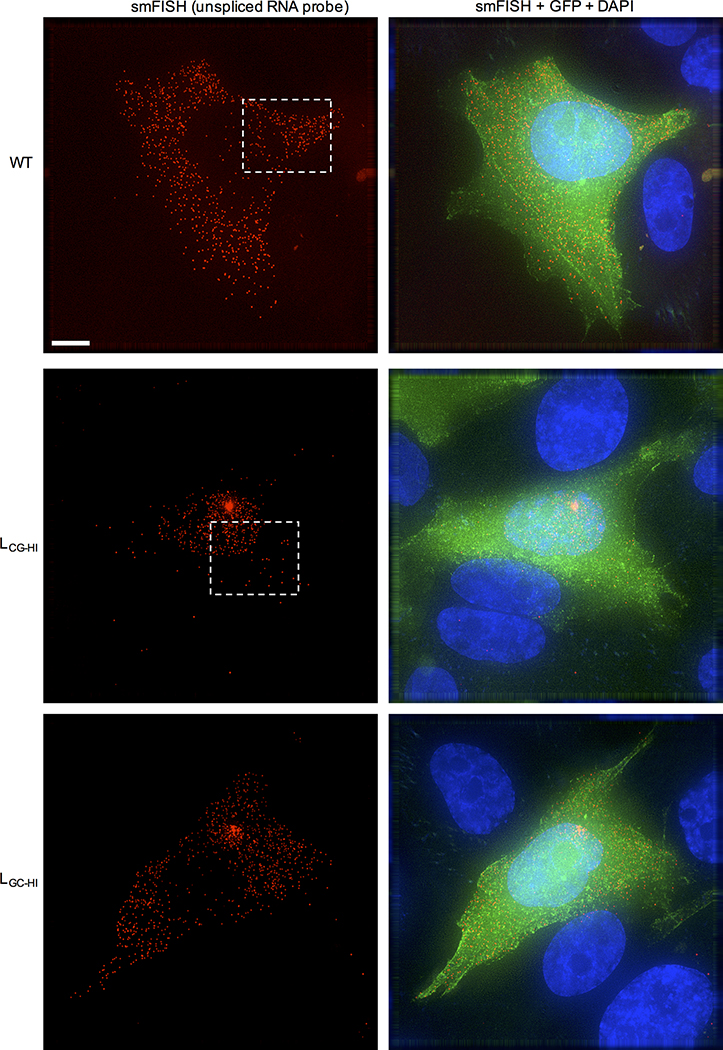
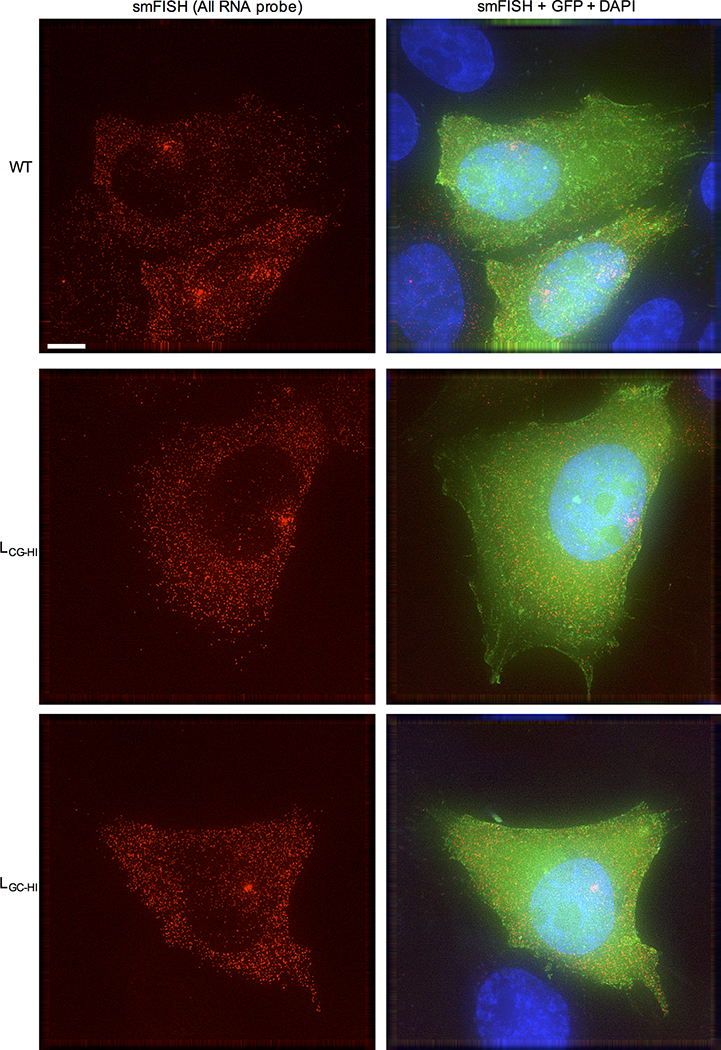
Unspliced viral RNA levels, measured by RT-PCR, in single-cycle infected MT4 cells were 5-to 10-fold lower in L, LCG, LCG-HI and EH infected cells and at HIV-1WT levels for LOTH, LGC-HI, E, F, G, or H infected cells (Fig. 2d, Extended Data Fig. 2d). Single molecule fluorescence in situ hybridization (smFISH) experiments using a gag probe revealed that the deficit in unspliced viral RNA occurred specifically in the cytoplasm in LCG-HI infected cells, while levels of unspliced RNA in the nucleus were equivalent for WT, LCG-HI and LGC-HI (Fig. 2e,f, Extended data Fig. 3). Similar smFISH experiments employing a probe that detected all spliced and unspliced viral RNAs (Fig. 2c) revealed a marginal, statistically ambiguous deficit for LCG-HI (Extended data Fig. 2e, 4), Thus, incompletely spliced RNAs (that represent only a subset of total HIV-1 RNAs)9 appeared selectively depleted in in LCG-HI infected cells.
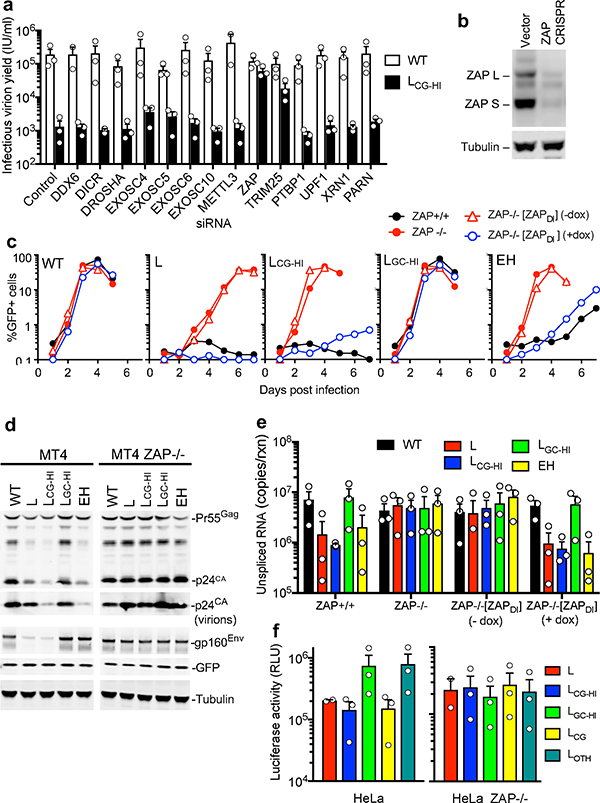
Because a deficit in levels of CG-containing RNA and their protein products was the foundational defect in cells infected with the defective viral mutants, we conducted a focused siRNA screen targeting proteins involved RNA degradation pathways (e.g. microRNA, nonsense mediated decay, and RNA exosome pathways) (Fig 3a, Extended Data Fig. 5a). Single-cycle replication experiments revealed that knockdown of zinc finger antiviral protein (ZAP)7 nearly completely restored infectious virion yield from LCG-HI infected cells (Fig. 3a). Knockdown of TRIM25, which enhances ZAP activity10,11, also increased viral yield.
Figure 3. ZAP specifically inhibits CG-enriched HIV-1 replication.
a, Single-cycle infectious HIV-1WT and LCG-HI yield from siRNA transfected Hela cells (mean ± sem, n=3 independent experiments). b, Western blot analysis of MT4 cells following CRISPR mutation of ZAP exon 1. Representative of 3 experiments. c, Replication of HIV-1 mutants in ZAP+/+, ZAP−/− and doxycycline-inducible ZAP (ZAPDI) reconstituted ZAP−/− MT4 cells, as measured by FACS enumeration of infected cells. d, Western blot analysis of cells and virions 48h after a single-cycle infection of ZAP+/+ and ZAP−/− MT4 cells with WT and mutant HIV-1. e, Q-RT-PCR quantification of unspliced RNA in MT4 cells in a single-cycle infection assay (mean ± sem n=3 independent experiments). f, Luciferase expression following transfection of Hela or HeLa ZAP−/− cells with reporter plasmids incorporating HIV-1 RNA segments as 3′UTRs (mean ± sem n=3 independent experiments).
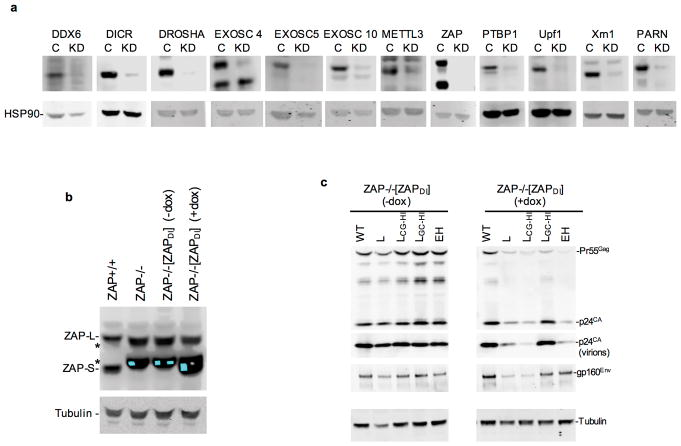
We generated ZAP−/− MT4 cells lacking both major ZAP isoforms (ZAP-L and ZAP-S, Fig. 3b) using CRISPR/Cas9. While previous work has indicated that an overexpressed ZAP fragment can inhibit HIV-1 infection12, knockout of endogenous ZAP in MT4 cells did not affect HIV-1WT or LGC-HI replication (Fig. 3c). Strikingly, LCG-HI and EH that were defective in unmanipulated MT4 cells, replicated indistinguishably from HIV-1WT in ZAP−/− MT4 cells (Fig. 3c). Deficits in viral protein levels observed in CG-enriched virus-infected cells were abolished in ZAP−/− cells (Fig. 3d). Reconstitution of ZAP−/− MT4 cells with a CRISPR-resistant, doxycycline-inducible ZAP-S construct [ZAPDI] enabled doxycycline-dependent inhibition of CG-enriched virus replication, and protein expression in single cycle assays, but did not affect HIV-1WT (Fig. 3c, Extended Data Fig. 5b,c). Moreover, the deficit in unspliced viral RNA, evident in CG-enriched virus-infected cells, was abolished in ZAP−/− cells and reinstated in a doxycycline-dependent manner in [ZAPDI] reconstituted ZAP−/− cells (Fig. 3e).
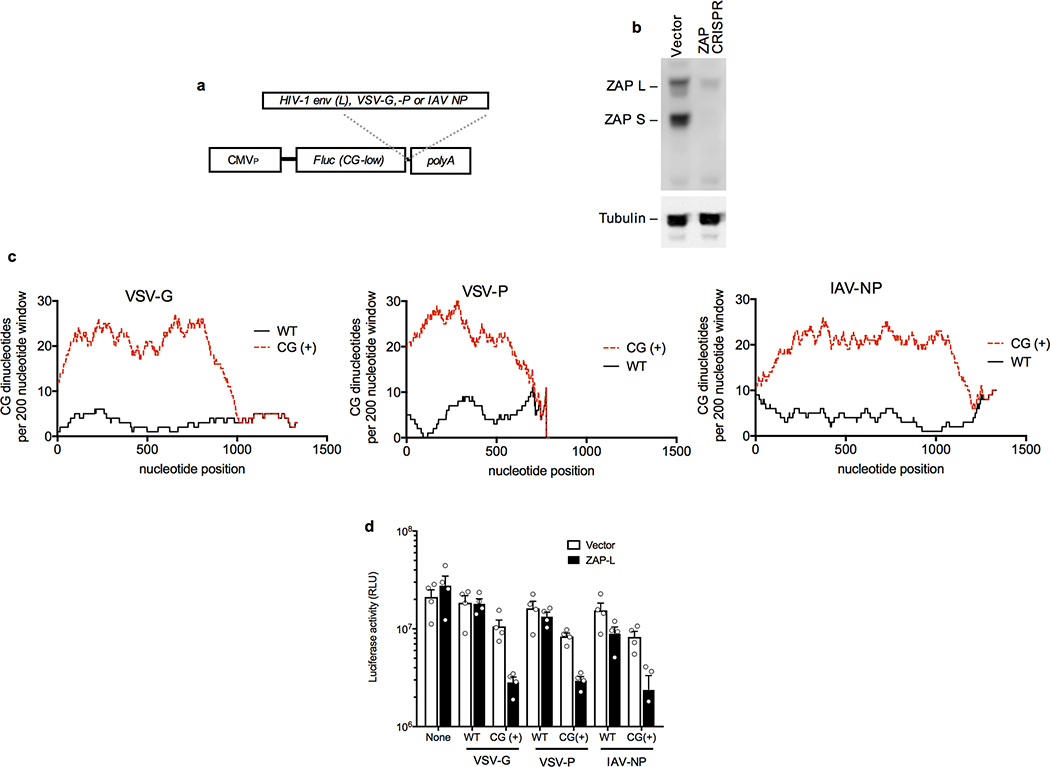
We transferred the L-mutant segment and its derivatives into the 3′UTR of a reporter construct encoding a synthetic CG-depleted fluc gene (Extended Data Fig. 6a). The CG-enriched L-derived elements inhibited luciferase expression by ~5-fold in this context, in a simple plasmid transfection assay (Fig 3f). These inhibitory effects were abolished when ZAP−/− HeLa cells were transfected (Fig. 3f Extended data Fig. 6b). Similar constructs containing fragments from naturally CG-suppressed vesicular stomatitis virus or influenza virus-derived RNA sequences4,5 (Extended Data Fig. 6a, c) revealed that elevating the CG-dinucleotide content of these sequences conferred sensitivity to ZAP-L in cotransfection assays (Extended data Fig. 6d).
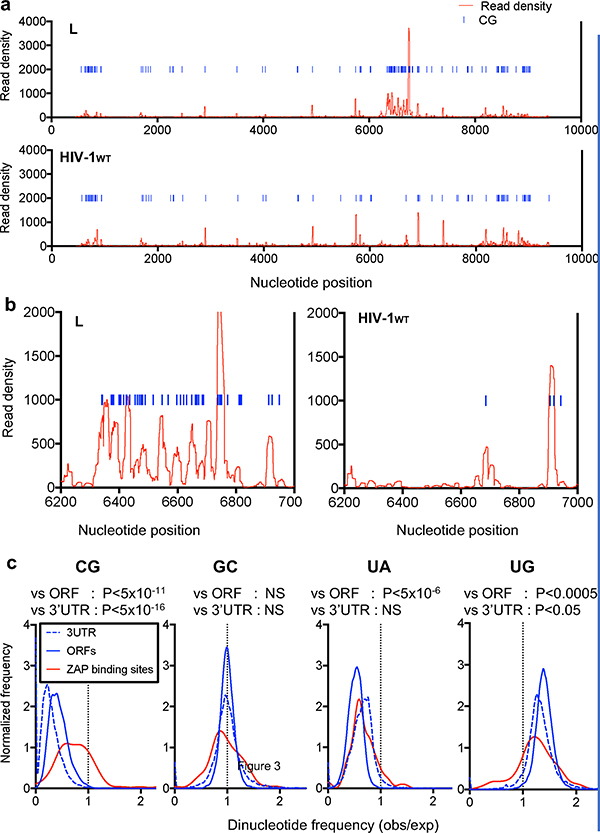
ZAP has been reported to bind RNA, but no shared features of its target sequences are evident13–16. To determine the RNA binding specificity of ZAP, we used crosslinking-immunoprecipitation-sequencing (CLIP-seq) assays in cells infected with HIV-1WT or mutant L. Remarkably, ZAP bound to the HIV-1 genome predominantly at a location that precisely coincided with the CG-enriched segment in mutant L (Fig. 4a, b). Conversely, ZAP bound less frequently to HIV-1WT and the unaltered portions of the L genome. Infrequent ZAP binding sites in the HIV-1 genome almost always coincided with rarely occurring CG dinucleotides (Fig. 4a, Extended Data Fig 7a).
Figure 4. ZAP binds directly and preferentially to CG dinucleotide-containing RNA.
a, CLIP analysis of the frequency with which L mutant and HIV-1WT RNA sequences are bound to ZAP in infected cells, versus their position in the viral genome. CG dinucelotides are indicated as blue lines. The L-mutant segment occupies positions 6307 to 6805. b, Expanded views of the ‘L’ portion of the CLIP graphs in a. c, Frequency distributions of CG, GC, UA and UG dinucleotide observed/expected frequencies in human ORFs, 3′UTRs and the top 100 ZAP-binding sites. P-values for ZAP binding sites (n=100) versus ORFs (n=35170) or 3′UTRs (n=135557) calculated using Welch’s unequal variance t-tests.
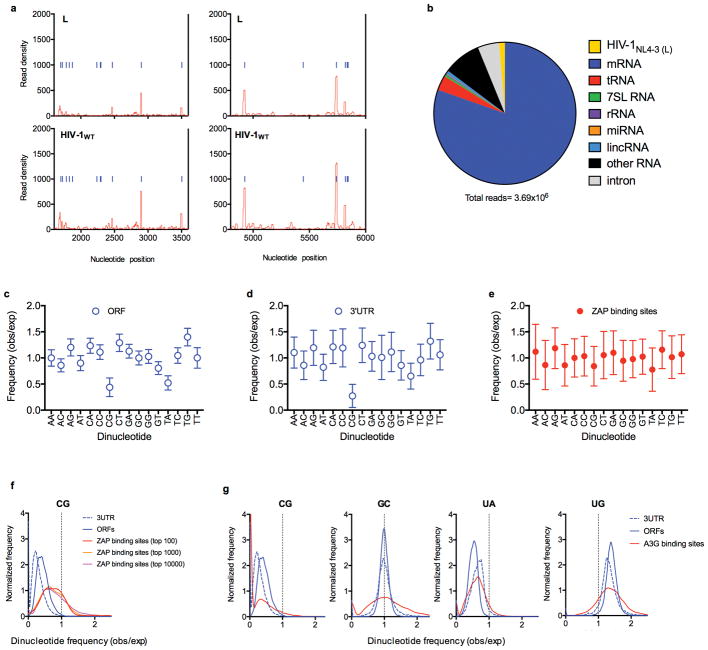
Although the L mutant genome was the single most frequently bound RNA in infected cells, ZAP also bound cellular mRNAs (Extended Data Fig. 7b). CG-suppression is marked in human mRNA ORF and 3′UTR sequences1 but was absent in the subset of these sequences that represented preferred ZAP binding sites (Extended data Fig 7c–e). A more detailed analysis of dinucleotides that are underrepresented (CG and UA) or overrepresented (UG) in ORFs and 3′UTRs as well as an inverted control dinucleotide (GC), revealed that ZAP binding sites were highly CG-enriched (Fig 4c, Extended data Fig. 7f). Conversely, UA, UG or GC dinucleotides were present in preferred ZAP binding elements at frequencies similar to those of ORFs and 3′UTRs (Fig. 4c), A control RNA binding protein (APOBEC3G) did not exhibit a preference for CG-enriched elements (Extended data Fig. 7g).
The replication of several, but not all, RNA and reverse-transcribing viruses was previously reported to be inhibited by overexpressed or endogenous ZAP7,12,14,17–24. Inspection of the dinucleotide composition of these viral genomes revealed that the degree of CG-suppression was generally predictive of ZAP resistance (Extended data Fig. 8a). Moreover, the degree to which previously mapped viral RNA elements confer sensitivity to ZAP in reporter assays was also generally predicted by the product of their length and the degree to which CG-nucleotides were suppressed (Extended data Fig. 8b).
CG suppression in ORFs is synonymous with codon-pair bias6,25–27. However, the CG- and ZAP-dependent inhibition of HIV-1 protein expression occurred when CG-enriched elements were incorporated into exonic (but not intronic) translated or 3′UTR portions of the corresponding pre-mRNAs. Thus, CG-dinucleotides exert effects post transcriptionally but independent of codon-pair translation efficiency. Rather, direct ZAP recognition causes cytoplasmic depletion of RNAs with high CG-content. While ZAP can also regulate the levels of certain host mRNAs (e.g. TRAILR4) 28, this activity requires the C-terminal PARP domain that is absent in ZAP-S (which exhibits antiviral activity) and most cellular mRNAs are unaffected by ZAP28. Thus, it appears that the major targets of ZAP are non-self, viral RNAs in which CG-suppression is incomplete. Manipulating CG content in viruses25,26 and ZAP expression in cells could enable adjustable levels of viral attenuation or recombinant gene expression, with many possible applications.
Methods
Plasmid constructs
A synonymously mutated HIV-1 sequence was designed that contained a maximum number of substitutions in open reading frames. Mutations were designed to maximize the probability of disrupting secondary structure by incorporating transversion mutations (purine to pyrimidine or vice versa) where possible. No new AG or GU dinucleotides were introduced to avoid the creation of new splice acceptors and donors. Sequences encoding overlapping open reading frames were not altered, and all known cis-acting elements that control HIV-1 splicing, gene expression and other aspects of HIV-1 replication9 were intact in the mutant viral genome. This designed HIV-1 sequence contained 1,976 synonymous mutations. This was divided into 150–500 nucleotide blocks (A through P), which were synthesized (Genewiz) and introduced in place of native sequence into HIV-1NHG, a proviral plasmid containing a reporter GFP embedded in nef, or HIV-1NL4-3, using restriction sites proximal to the mutated regions. Supplementary Data 1 contains a codon by codon list of the mutations made in segment L, Supplementary Data 2 and 3 contains alignments of WT and mutant EH and L segments (Fasta format). A complete characterization of the virus mutants not described in detail in this manuscript will be published elsewhere (MT, SJS, DBM, and PDB). Division (L, M) or combination (EH) of the original mutants blocks into derivative mutants was achieved using overlap extension PCR based approaches with mutant and WT templates.
A ZAP exon 1-targeting guide sequence: 5′-GGCCGGGATCACCCGATCGGTGG-3′ was inserted into a lentiviral based CRISPR plasmid from Addgene (52961) to generate ZAP−/− cells. A ZAP-S cDNA that was rendered resistant to the CRISPR resistant through introduction of synonymous mutations in the guide target sequence was generated by overlap extension PCR and inserted into a tetracycline inducible HIV-1 based vector (pLKO.dCMV.TetO/R). An epitope tagged (ZAP-3xHA) cDNA used for CLIP was inserted into the MLV expression vector, LHCX. A Firefly luciferase cDNA (fluc) was designed to remove CG dinucleotides through synonymous substitution, reducing the bringing the total number of CG dinucleotides from 97 to 8. This CG-low fluc cDNA was inserted into the expression vector pCR3.1 using EcoRI and NotI. Various sequences were then inserted 3′ to the fluc cDNA using NotI and XhoI. Specifically, sequences from the Indiana strain of VSV-G and P, and the Influenza A/WSN/1933 NP open reading frames were inserted, as were derivatives with synonymous mutations that maximized CG-dinucleotide content. A CXCR4-2A-CD4 cassette was generated by overlap-extension PCR and inserted into LHCX using HindIII and HpaI.
Cells
The adherent cells 293T, HOS and HeLa were obtained from the ATCC were grown in DMEM with 10% fetal bovine serum. MT4 cells were obtained from the NIH AIDS reagent repository and cultured in RPMI supplemented with 10% fetal bovine serum. Identity of cell lines was routinely confirmed by visual inspection by an experienced scientist and cells were not routinely tested form mycoplasma contamination. Primary lymphocytes were isolated from human blood by Ficoll-Paque gradient centrifugation and removal of the plastic adherent fraction. Cells were activated with phytohaemagglutinin (Sigma, 5 μg ml−1) and cultured in the presence of interleukin-2 (50 U ml−1) in RPMI with 10% fetal bovine serum.
ZAP-deficient cells were generated by transduction with the lenti-CRISPR vector followed by selection in 5 μg ml−1 blasticidin. Single-cell clones were derived by limiting dilution and maintained in the appropriate media with 5 μg ml−1 blasticidin. Loss of ZAP protein and gene was confirmed by PCR amplification and sequencing the genomic locus and by western blotting. In some CRISPR knockout clones, protein species that reacted with an anti-ZAP antibody arose after extended passage and likely represent truncated forms of ZAP-L whose translation initiated at methionine codons 3′ to the CRISPR target site (that was near the ZAP N-terminus). The appearance of these protein species did not affect the ability of the cells to support replication of WT or mutant viruses. Doxycycline-inducible ZAP-S expression in MT4 cells was reconstituted by stable transduction with the LKO ZAP-S expression vector followed by selection in 2.5 μg ml−1 puromycin. These reconstituted cells were used as a pool. Cells (293T) stably expressing either ZAP-S 3xHA or ZAP-L 3xHA were generated by transduction with the LHCX vector containing followed by selection in 50 μg ml−1 hygromycin. A single cell clone was derived by limiting dilution and maintained in DMEM with 50 μg ml−1 hygromycin. HOS cells were stably transduced with LHCX CXCR4-2A-CD4 followed by selection in 25 μg/ml hygromycin. A single cell clone was derived by limiting dilution and maintained in the appropriate media with 25 μg/ml hygromycin.
Viruses
All HIV-1 virus stocks were generated by transfection of 293T cells 10cm dishes with 10μg of proviral plasmid using polyethyleneimine (Polysciences). HIV-1WT and mutant viruses usually contained a GFP reporter and were generated by transfection with HIV-1NHG-derived proviral plasmids. The yields of infectious virus from transfected 293T cells for each of the mutants was similar, despite their differing properties in spreading replication assays. This is very likely due to gross overexpression of the viral genome in transfected 293T cells. Viruses used in primary lymphocyte replication and CLIP assays were generated by transfection with HIV-1NL4-3. Viruses used to infect CD4-negative HeLa cells in the single cycle replication siRNA screen, or 293T cells in the CLIP assays, were generated by transfection with 10μg of proviral plasmid and 1μg of VSV-G expression plasmid.
Infection Assays
Titers of viral stocks were determined by performing 3-fold serial dilutions in a 96 well plate and infecting 5×10⁴ MT4 cells per well. At 16–18 hours post infection, dextran sulfate was added to each well at a concentration of 50 μg ml−1 to prevent reinfection by nascent virions. At 48 hours after infection, cells were fixed in 4% PFA and enumerated by FACS analysis using a CyFlow Space cytometer (Partec) coupled to a Hypercyte Autosampler (Intellicyt).
For spreading replication assays with GFP reporter viruses, viral stocks generated from transfected 293T cells were adjusted to the same number of single cycle infectious units (determined on MT4 cells as described above). Thereafter, 2×10⁵ MT4 cells were infected at an MOI of 0.002 in 2 mL of RPMI. Aliquots of infected cells were withdrawn each day, fixed in 4% PFA and the proportion of infected cells determined by FACS analysis of GFP expression. For spreading replication assays in PBMCs, cells were infected at an MOI of 0.001. At 18 hours post infection the cells were washed four times with PBS and cultured in RPMI with 50 U ml−1 interleukin-2. Supernatants were collected every 24 hours. Viral particle release was determined by measuring the reverse transcriptase activity with a PCR based assay.
For single cycle replication MT4 cells were infected at an MOI of 1.0, with HIV-1NHG-derived viruses, washed three times with PBS 18 hours post infection, and resuspended in RPMI with 50 μg ml−1 of dextran sulfate to prevent reinfection. At 48 hours post infection, cells and supernatants were collected for analysis. Half of the cells were lysed in SDS sample buffer for western blot analysis and half allocated for RNA extraction and to determine levels of unspliced RNA as described below. The supernatants were filtered with a 0.22 μm filter. An aliquot of filtered supernatant was used to determine infectious viron yield by titration on MT4 cells. The remaining supernatant was centrifuged over a 20% sucrose cushion at 14,000 rpm at 4° C for 90 minutes. Pelleted virions were resuspended in SDS sample buffer for western blot analysis.
Quantitative RT-PCR analysis
RNA was collected from infected cells using the Nucleospin RNA kit (Macherey Nagel). The RNA concentration was determined using a NanoDrop 2000c (ThermoFisher). Equal amounts of RNA were reverse transcribed using SuperScript III reverse transcriptase with random hexamer priming (ThermoFisher). The cDNA was used as a temple for quantitative real-time PCR using a StepOnePlus RT-PCR machine (Applied Biosystems). Unspliced viral RNA was detected by a TaqMan probe spanning the major splice donor D1, using the Fast Start TaqMan Probe master-mix. Serial tenfold dilutions of known copy numbers of HIV-1NHG plasmid was used to generate a standard curve. The sequence of the TaqMan probe and primers were: D1 probe: 5′-GGGCGGCGACTGGTGAGT-3′; forward primer: 5′-GGACTTGAAAGCGAAAGGGA-3′; reverse primer: 5′-TCTCTCTCCTTCTAGCCTCCG-3′.
Western blot analyses and antibodies
Cells were counted, normalized for cell number, lysed in SDS sample buffer, separated by electrophoresis on NuPage 4–12% Bis-Tris gels (Novex) and blotted onto nitrocellulose membranes (GE Healthcare). Antibodies for PTBP1 (ab5642), Drosha (ab12286), DICR (ab14601), EXOSC6 (ab50910), EXOSC10 (ab50558), and PARN (ab188333) were obtained from Abcam. Antibodies for Upf1 (A300-036A), METTL3 (A301-567A), EXOSC4 (A303-775A), EXOSC5 (A303-887A), and Xrn1 (A300-443A) were obtained from Bethyl Labs. The antibody against ZAP (16820-1-AP) was obtained from Proteintech. The HIV-1 capsid antibody (183-H12-5C) was obtained from the NIH AIDS reagent repository. The GFP (G1546) antibody was obtained from Sigma. The HIV Env (12-6205-1) antibody was obtained from American Research Products. The HA (HA.11) antibody used in the CLIP assays was obtained from Biolegend.
Single molecule fluorescence in-situ hybridization
HOS CXCR4-2A-CD4 were seeded onto gelatin coated glass bottom 24 well plates (MatTek) and infected at an approximate MOI of <1 with HIV-1WT, LCG-HI, or LGC-HI. Twenty-eight hours after infection the cells were washed with PBS and fixed with 4% paraformaldehyde (Thermo) in PBS for 30 min at RT. After permeabilization with 70% ethanol for 2hr at RT the cells were briefly washed with Stellaris RNA-FISH wash buffer A for 5 min at room temperature. The cells were then incubated with custom Stellaris smFISH probes targeting HIV-1 gag or all viral mRNAs (Biosearch Technologies) at a concentration of 0.125 μM in Stellaris RNA FISH hybridization buffer for 16–18 hr at 37°C. The cells were then washed two times for 30 min at 37°C in Stellaris RNA FISH wash buffer A. The second wash contained Hoechst dye at 1 μg/ml. After a 5 minute wash with Stellaris RNA FISH wash buffer B cells were rinsed three times with PBS and imaged by deconvolution microscopy (Deltavision). Image stacks were generated by maximum intensity projection using the Z project function in ImageJ (Version 2.0.0-rc-59/1.51n). RNA spots were counted using Find Maxima function in ImageJ.
RNA interference screen
Cells were transfected with 50 pmol of siRNA SMART pool (Dharmacon) using RNAiMAX (Thermo Fisher) in a 6 well plate seeded with 2×10⁵ HeLa cells per well. At 24 hours post transfection, cells were infected with either wildtype HIV-1NHG or LCG-HI. At 48 hours post-transfection the cells were washed three-times with PBS and suspended in DMEM. The cells and supernatant were collected at 72 hours post-transfection to determine knockdown efficiency levels and the yield of infectious virions.
CLIP-seq
The CLIP method used in this study has been previously described29 In brief, RNA and proteins were cross linked by feeding cells overnight with 4-thiouridine irradiating them at 0.15 J/cm2 UV (λ = 365 nm) in a Stratalinker 2400 UV crosslinker (Stratagene). Thereafter ZAP-3xHA was immunopurified using Protein G-conjugated magnetic Dynabeads and a mouse monoclonal anti-HA antibody, and the RNA was radiolabeled with 0.5 μCi/μl γ-32P[ATP] ATP. Protein-RNA adducts were separated by SDS-PAGE, transferred to nitrocellulose and detected by autoradiography. Next, sequential 3′ and 5′ adaptor ligations were performed as previously described attaching a known sequence that contains primer binding sites for reverse transcription and PCR-amplification of the cDNA library. Sequencing of the cDNA library was done on an Illumina HiSeq 2000 platform.
The analysis pipeline used in this study has previously been described. Processing of raw reads was performed with the FASTX toolkit (http://hannonlab.cshl.edu/fastx_toolkit/), excluding reads with fewer than 15 nucleotides. Reads were then aligned to the human genome (hg38) concatenated with the HIV-1NL4-3 genome or to the viral genome alone. Cluster analysis was performed using PARalyzer30.
Statistical information
HIV-1 replication experiments were done at least three times representative data is shown. CLIP experiments were done four times and representative data is shown. Statistical analysis of smFISH data was done using the Mann Whitney U test. Statistical analysis of variation in dinucleotide frequencies between ORFs, 3′UTRs and CLIP-derived ZAP-binding sequences and the human databases of ORFs and 3′UTRs were performed using Welch’s unequal variance t-test implemented using R. All other experiments yielding quantitative data, were done at least three times and mean values ± standard deviations are plotted.
Data availability statement
The HIV-1 L mutant sequence has been submitted to Genbank (accession code MF687717) the CLIP-seq data has been deposited in the NCBI GEO data repository with accession code GSE102843 (GSM2747099 and GSM2747100)
Extended Data
Extended data Figure 1. CG-enriched HIV-1 clones yield near WT levels of virus from transfected 293T cells but are attenuated in replication in primary lymphocytes.
a, Yield of infectious virus from proviral plasmid transfected 293T cells, as measured by infection of MT4 cells (mean ± sem, n=3, 4 or 5 independent experiments)
b, c, Spreading replication of HIV-1 mutants in primary lymphocytes from two additional donors as measured by reverse transcriptase activity in the supernatant of infected cells over time.
Extended data Figure 2. Effects of CG dinucleotides on HIV-1 infectious virion yield, RNA and protein levels in single-cycle replication assays.
a, Yield of infectious virus, in a single-cycle of replication following infection of MT4 cells with equal titers of HIV-1WT and pol mutants (mean ± sem n=3 independent experiments). b, expression of gfp in MT4 cells, as measured by flow cytometry, 48h after infection with equal titers of the indicated viruses. Numerical values are mean fluorescent intensity (MFI) of infected cells (indicated by the dotted box). c, Western blot analysis (anti-Gag, anti-Env, anti-GFP and anti-HSP90) of viral, reporter and cellular protein expression, 48h after a single-cycle infection of MT4 cells with WT and synonymous pol mutant HIV-1. Representative of 3 experiments. d, Q-RT-PCR quantification of unspliced RNA in MT4 cells in a single-cycle infection assay with WT and synonymous pol mutant HIV-1 (mean ± sem n=2 or 3 independent experiments). e. Quantification of RNA molecules (fluorescent spots) by smFISH in cytoplasm using a probe targeting all spliced and unspliced HIV-1 RNA species after infection of HOS/CD4-CXCR4 cells. Each symbol represents an individual cell. Horizontal lines represent mean values, p-values were determined using Mann-Whitney test (n=10).
Extended data Figure 3. smFISH quantification of unspliced HIV-1 RNA in infected cells.
Examples of smFISH analysis of WT and synonymous mutant HIV-1 infected cells (red=smFISH gag probe (see Fig 2c), green=GFP, blue=Hoescht dye). The boxed areas indicate regions selected for expanded views in Fig. 2f. Clusters of RNA molecules in the nuclei of some infected cells may represent sites of proviral integration. Representative of 3 independent experiments. Scale bar = 5μm.
Extended data Figure 4. smFISH quantification of total HIV-1 RNA in infected cells.
Examples of smFISH analysis of WT and synonymous mutant HIV-1 infected cells (red=smFISH probe targeting all viral mRNA species (see Fig 2c), green=GFP, blue=Hoescht dye) Clusters of RNA molecules in the nuclei of some infected cells may represent sites of proviral integration. Representative of 3 independent experiments. Scale bar = 5μm.
Extended data Figure 5. ZAP mediates deleterious effects of CG-dinucleotides on HIV-1 replication.
a, Western blot analyses, using the indicated antibodies, following transfection of HeLa cells with the corresponding siRNAs, or control siRNAs, in the single-cycle replication assays described in Fig. 3a. Representative of 2 experiments. b, Western blot analysis of ZAP expression in control, CRISPR knockout MT4 cells and doxycycline-inducible ZAP-S reconstituted MT4 cells. Asterisks indicate protein species that appeared in some CRISPR knockout clones, reacted with an anti-ZAP antibody and arose after extended passage. These likely represent truncated forms of ZAP-L whose translation initiated at methionine codons 3′ to the CRISPR target site (that was near the ZAP N-terminus) Representative of 3 experiments. c, Western blot analysis (anti-Gag, anti-Env anti-GFP and anti-Tubulin) of viral, and cellular protein levels in cells and virions, 48h after a single-cycle WT and mutant HIV-1infection of ZAP−/− MT4 cells that had been reconstituted with a doxycycline-inducible ZAP-S expression construct (ZAPDI) and left untreated or treated with doxycycline. Representative of 3 experiments.
Extended data Figure 6. CG dinucleotides in 3′UTRs confer sensitivity to inhibition by ZAP.
a, Schematic representation of a reporter construct encoding a CG-dinucleotide depleted fluc cDNA into which were inserted the indicated sequences as 3′UTRs. b, Western blot analysis of ZAP expression following CRISPR mutation of ZAP exon 1 in HeLa cells. Representative of 3 experiments. c, Number of CG dinucleotides present in a 200-nucleotide sliding window in the indicated viral cDNA sequences that were left unmanipulated (WT), or recoded with synonymous mutations to contain the maximum number of CG dinucleotides (CG+). d, Luciferase expression following transfection of 293T ZAP−/− cells with CG-dinucleotide depleted fluc reporter plasmids incorporating the indicated VSV or influenza A virus (IAV) RNA sequences as 3′UTRs, in the presence or absence of a cotransfected ZAP-L expression plasmid (mean ± sem n=4 independent experiments).
Extended data Figure 7. Dinucleotide composition of ORFs, 3′UTRs, and preferred ZAP binding sites in cellular mRNAs.
a, Expanded views of the portion of the CLIP graphs in Fig4. a corresponding to unmutated portions of the viral genome b, Sources of RNA reads bound to ZAP in a typical CLIP-seq experiment, done using HIV-1 infected cells c-e, Ratio of the observed frequency to the expected frequency (obs/exp, based on mononucleotide composition) for each of the 16 possible dinucleotides, in ORFs (c), 3′ UTR (d) sequences as well as the 100 sites in cellular mRNAs that were most frequently bound by ZAP, based on CLIP read numbers (e). Plotted values are mean ± sd of all ORF (n=35170) and 3′UTRs (n=135557) in the respective libraries (n=?) or the most preferred ZAP binding sites (n=100). f, Frequency distributions of CG dinucleotide observed/expected frequencies in human ORFs, 3′UTRs and top 100, top 1000 and top 10000 ZAP-binding sites in CLIP experiments. The top 100, top 1000 and top 10000 ZAP-binding sites account for 6.7%, 18.9% and 46.7% of total reads. g, Frequency distributions of CG, GC, UA and UG dinucleotide observed/expected frequencies in human ORFs, 3′UTRs and the top 100 APOBEC3G-binding sites in CLIP assays.
Extended data Figure 8. Analysis of CG-suppression in previously reported ZAP-sensitive and ZAP-resistant viruses and ZAP-sensitizing elements.
a, CG suppression in RNA and reverse transcribing viruses previously reported to be ZAP sensitive (n=9, open symbols) and ZAP resistant (n=4, filled symbols) 7,17–20. The viruses included in the analysis and their degrees of CG suppression (CG observed/expected) are: ZAP-sensitive: Sinbis virus (0.90), Semliki forest Virus (0.89), Venezuelan equine encephalitis virus (0.76), Ebolavirus (0.60), Hepatitis B virus (0.52), Moloney Murine Leukemia Virus (0.51), Marburg virus (0.53), Alphavirus M1 (0.89), Ross River Virus (0.82); ZAP-insensitive: HIV-1 (0.21), Yellow fever virus (0.38) Vesicular stomatitis virus (0.48) Poliovirus (0.54). The p value was calculated using the students T-test (2-sided, n=9 ZAP sensitive viruses and n=4 ZAP resistant viruses). Influenza virus (CG obs/exp = 0.44) that has been reported to be ZAP-resistant due to the presence of an antagonist24 and ZAP-L sensitive via an entirely distinct protein interaction based mechanism23 was excluded from this analysis. b, Analysis of previous published data on ZAP inhibition of reporter gene expression. Each RNA element derived from the indicated RNA viruses was placed in a 3′UTR of a luciferase reporter plasmid and fold inhibition by coexpressed ZAP is plotted against the product of CG suppression (CG observed/expected) and length for each RNA element. A data point that is a quantitative outlier from the general trend (indicated in red) is from the Sinbis (SINV) genome, but is nevertheless included in the linear regression analysis, P value was calculated using the F-test (2-sided, n=32 data points) Data are from references13 and18.
Extended Data Table 1.
Mutations in the HIV-1 L mutant and its derivatives
| Virus | Mutations | CG dinucleotides added | CG dinucleotides total | GC dinucleotides total |
|---|---|---|---|---|
| WT | none | 0 | 2 | 18 |
| L | 145 synonymous mutations | 37 | 39 | 25 |
| LCG | 37 mutations (subset of L mutations that generate new CG dinucleotides) | 37 | 39 | 27 |
| LOTH | 108 mutations (subset of L mutations that do not generate new CG dinucleotides) | 0 | 2 | 19 |
| LCG-HI | 41 mutations | 41 | 43 | 18 |
| LGC-HI | 9 mutations | 0 | 2 | 27 |
Supplementary Material
Acknowledgments
We thank Tony Kueck for primary lymphocytes and Sebastian Giese for assistance with smFISH. This work was supported NIH grants R01AI50111 and P50GM103297 (to PDB)
Footnotes
Author contributions. MAT performed all experiments unless otherwise stated and wrote the paper. DGC performed some of the luciferase reporter experiments and bioinformatic analyses. TMZ performed smFISH experiments. AY performed some of the CLIP experiments. DBM generated the mutant sequence in silico. SJS constructed and characterized the 16 original mutant HIV-1 strains. PDB conceived the study, supervised the work and wrote the paper.
The Authors declare that they have no competing financial interests.
Supplementary Information is linked to the online version of the paper at www.nature.com/nature.
References
- 1.Karlin S, Mrazek J. Compositional differences within and between eukaryotic genomes. Proc Natl Acad Sci U S A. 1997;94:10227–10232. doi: 10.1073/pnas.94.19.10227. [DOI] [PMC free article] [PubMed] [Google Scholar]
- 2.Karlin S, Doerfler W, Cardon LR. Why is CpG suppressed in the genomes of virtually all small eukaryotic viruses but not in those of large eukaryotic viruses? J Virol. 1994;68:2889–2897. doi: 10.1128/jvi.68.5.2889-2897.1994. [DOI] [PMC free article] [PubMed] [Google Scholar]
- 3.Rima BK, McFerran NV. Dinucleotide and stop codon frequencies in single-stranded RNA viruses. J Gen Virol. 1997;78(Pt 11):2859–2870. doi: 10.1099/0022-1317-78-11-2859. [DOI] [PubMed] [Google Scholar]
- 4.Greenbaum BD, Levine AJ, Bhanot G, Rabadan R. Patterns of evolution and host gene mimicry in influenza and other RNA viruses. PLoS Pathog. 2008;4:e1000079. doi: 10.1371/journal.ppat.1000079. [DOI] [PMC free article] [PubMed] [Google Scholar]
- 5.Cheng X, et al. CpG usage in RNA viruses: data and hypotheses. PLoS One. 2013;8:e74109. doi: 10.1371/journal.pone.0074109. [DOI] [PMC free article] [PubMed] [Google Scholar]
- 6.Futcher B, et al. Reply to Simmonds, et al.: Codon pair and dinucleotide bias have not been functionally distinguished. Proc Natl Acad Sci U S A. 2015;112:E3635–3636. doi: 10.1073/pnas.1507710112. [DOI] [PMC free article] [PubMed] [Google Scholar]
- 7.Gao G, Guo X, Goff SP. Inhibition of retroviral RNA production by ZAP, a CCCH-type zinc finger protein. Science. 2002;297:1703–1706. doi: 10.1126/science.1074276. [DOI] [PubMed] [Google Scholar]
- 8.van Hemert F, van der Kuyl AC, Berkhout B. On the nucleotide composition and structure of retroviral RNA genomes. Virus Res. 2014;193:16–23. doi: 10.1016/j.virusres.2014.03.019. [DOI] [PubMed] [Google Scholar]
- 9.Karn J, Stoltzfus CM. Transcriptional and posttranscriptional regulation of HIV-1 gene expression. Cold Spring Harb Perspect Med. 2012;2:a006916. doi: 10.1101/cshperspect.a006916. [DOI] [PMC free article] [PubMed] [Google Scholar]
- 10.Li MM, et al. TRIM25 Enhances the Antiviral Action of Zinc-Finger Antiviral Protein (ZAP) PLoS Pathog. 2017;13:e1006145. doi: 10.1371/journal.ppat.1006145. [DOI] [PMC free article] [PubMed] [Google Scholar]
- 11.Zheng X, et al. TRIM25 Is Required for the Antiviral Activity of Zinc Finger Antiviral Protein. J Virol. 2017;91 doi: 10.1128/JVI.00088-17. [DOI] [PMC free article] [PubMed] [Google Scholar]
- 12.Zhu Y, et al. Zinc-finger antiviral protein inhibits HIV-1 infection by selectively targeting multiply spliced viral mRNAs for degradation. Proc Natl Acad Sci U S A. 2011;108:15834–15839. doi: 10.1073/pnas.1101676108. [DOI] [PMC free article] [PubMed] [Google Scholar]
- 13.Guo X, Carroll JW, Macdonald MR, Goff SP, Gao G. The zinc finger antiviral protein directly binds to specific viral mRNAs through the CCCH zinc finger motifs. J Virol. 2004;78:12781–12787. doi: 10.1128/JVI.78.23.12781-12787.2004. [DOI] [PMC free article] [PubMed] [Google Scholar]
- 14.Zhu Y, Gao G. ZAP-mediated mRNA degradation. RNA Biol. 2008;5:65–67. doi: 10.4161/rna.5.2.6044. [DOI] [PubMed] [Google Scholar]
- 15.Chen S, et al. Structure of N-terminal domain of ZAP indicates how a zinc-finger protein recognizes complex RNA. Nat Struct Mol Biol. 2012;19:430–435. doi: 10.1038/nsmb.2243. [DOI] [PubMed] [Google Scholar]
- 16.Huang Z, Wang X, Gao G. Analyses of SELEX-derived ZAP-binding RNA aptamers suggest that the binding specificity is determined by both structure and sequence of the RNA. Protein Cell. 2010;1:752–759. doi: 10.1007/s13238-010-0096-9. [DOI] [PMC free article] [PubMed] [Google Scholar]
- 17.Bick MJ, et al. Expression of the zinc-finger antiviral protein inhibits alphavirus replication. J Virol. 2003;77:11555–11562. doi: 10.1128/JVI.77.21.11555-11562.2003. [DOI] [PMC free article] [PubMed] [Google Scholar]
- 18.Muller S, et al. Inhibition of filovirus replication by the zinc finger antiviral protein. J Virol. 2007;81:2391–2400. doi: 10.1128/JVI.01601-06. [DOI] [PMC free article] [PubMed] [Google Scholar]
- 19.Mao R, et al. Inhibition of hepatitis B virus replication by the host zinc finger antiviral protein. PLoS Pathog. 2013;9:e1003494. doi: 10.1371/journal.ppat.1003494. [DOI] [PMC free article] [PubMed] [Google Scholar]
- 20.Lin Y, et al. Identification and characterization of alphavirus M1 as a selective oncolytic virus targeting ZAP-defective human cancers. Proc Natl Acad Sci U S A. 2014;111:E4504–4512. doi: 10.1073/pnas.1408759111. [DOI] [PMC free article] [PubMed] [Google Scholar]
- 21.Goodier JL, Pereira GC, Cheung LE, Rose RJ, Kazazian HH., Jr The Broad-Spectrum Antiviral Protein ZAP Restricts Human Retrotransposition. PLoS Genet. 2015;11:e1005252. doi: 10.1371/journal.pgen.1005252. [DOI] [PMC free article] [PubMed] [Google Scholar]
- 22.Moldovan JB, Moran JV. The Zinc-Finger Antiviral Protein ZAP Inhibits LINE and Alu Retrotransposition. PLoS Genet. 2015;11:e1005121. doi: 10.1371/journal.pgen.1005121. [DOI] [PMC free article] [PubMed] [Google Scholar]
- 23.Liu CH, Zhou L, Chen G, Krug RM. Battle between influenza A virus and a newly identified antiviral activity of the PARP-containing ZAPL protein. Proc Natl Acad Sci U S A. 2015;112:14048–14053. doi: 10.1073/pnas.1509745112. [DOI] [PMC free article] [PubMed] [Google Scholar]
- 24.Tang Q, Wang X, Gao G. The Short Form of the Zinc Finger Antiviral Protein Inhibits Influenza A Virus Protein Expression and Is Antagonized by the Virus-Encoded NS1. J Virol. 2017;91 doi: 10.1128/JVI.01909-16. [DOI] [PMC free article] [PubMed] [Google Scholar]
- 25.Coleman JR, et al. Virus attenuation by genome-scale changes in codon pair bias. Science. 2008;320:1784–1787. doi: 10.1126/science.1155761. [DOI] [PMC free article] [PubMed] [Google Scholar]
- 26.Tulloch F, Atkinson NJ, Evans DJ, Ryan MD, Simmonds P. RNA virus attenuation by codon pair deoptimisation is an artefact of increases in CpG/UpA dinucleotide frequencies. Elife. 2014;3:e04531. doi: 10.7554/eLife.04531. [DOI] [PMC free article] [PubMed] [Google Scholar]
- 27.Kunec D, Osterrieder N. Codon Pair Bias Is a Direct Consequence of Dinucleotide Bias. Cell reports. 2016;14:55–67. doi: 10.1016/j.celrep.2015.12.011. [DOI] [PubMed] [Google Scholar]
- 28.Todorova T, Bock FJ, Chang P. PARP13 regulates cellular mRNA post-transcriptionally and functions as a pro-apoptotic factor by destabilizing TRAILR4 transcript. Nat Commun. 2014;5:5362. doi: 10.1038/ncomms6362. [DOI] [PMC free article] [PubMed] [Google Scholar]
- 29.Kutluay SB, et al. Global changes in the RNA binding specificity of HIV-1 gag regulate virion genesis. Cell. 2014;159:1096–1109. doi: 10.1016/j.cell.2014.09.057. [DOI] [PMC free article] [PubMed] [Google Scholar]
- 30.Corcoran DL, et al. PARalyzer: definition of RNA binding sites from PAR-CLIP short-read sequence data. Genome Biol. 2011;12:R79. doi: 10.1186/gb-2011-12-8-r79. [DOI] [PMC free article] [PubMed] [Google Scholar]
Associated Data
This section collects any data citations, data availability statements, or supplementary materials included in this article.
Supplementary Materials
Data Availability Statement
The HIV-1 L mutant sequence has been submitted to Genbank (accession code MF687717) the CLIP-seq data has been deposited in the NCBI GEO data repository with accession code GSE102843 (GSM2747099 and GSM2747100)


