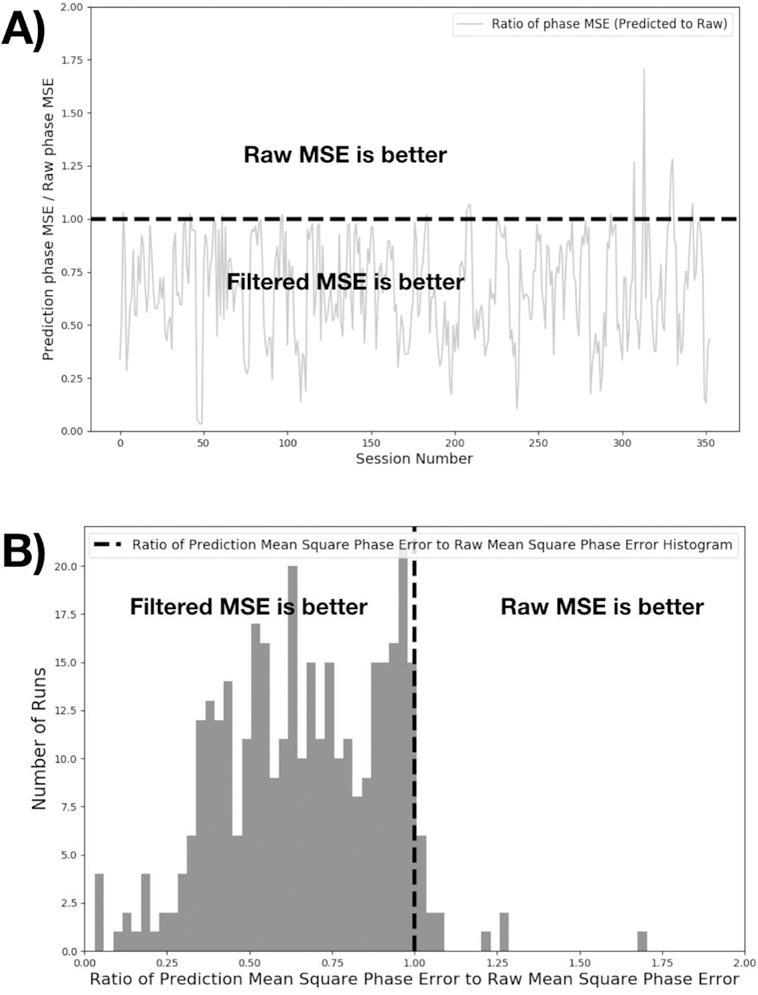
Figure 4.

This figure shows phase error comparison of CNN versus the raw cardiac signal. For 353 sessions, we calculated the phase error for both CNN and raw cardiac signals. Analytic phase projection algorithm can result in outliers in some period of the time sequence. We include datapoints up to the 99.9th percentile of the phase errors to exclude outliers in the data. Mean square phase errors relative to the ground truth plethysmogram are calculated and presented as a ratio. In the majority of the cases, phase calculated from CNN output was better compared to Stage 2 output. A) shows the error ratios for individual runs, B) presents the same data as a histogram. The top 2 outliers were found to be high frequency plethysmogram data (cardiac rate of ~120 BPM) which was outside of the typical training range of the dataset.
