Abstract
Background and Purpose:
To compare time-dependent changes in lung parenchyma of early-stage non-small cell lung carcinoma (NSCLC) patients after stereotactic body radiation therapy with protons (SBPT) or photons (SBRT).
Materials and Method:
We retrospectively identified NSCLC patients treated with SBPT and matched each one with a SBRT patient by patient, tumor, and treatment characteristics. Lung parenchyma on serial post-treatment chest computer tomography (CT) scans was deformably registered with the treatment plan to analyze lung density changes as function of dose, quantified by Houndsfield Unit (HU)/Gy. A thoracic radiologist also evaluated the CTs using an established grading system.
Results:
We matched 23 SBPT/SBRT pairs, including 5 patients treated with both modalities (internally matched cohort). Normal lung response following SBPT significantly increased in the early time period (CTs acquired <6 months, median 3 months) post-treatment, and then did not change significantly in the later time period (CTs acquired 6–14 months, median 9 months). For SBRT, the normal lung response was similar to SBPT in the early time period, but then increased significantly from the early to the late time period (p=0.007). These differences were most pronounced in sensitive (response >6 HU/Gy) patients and in the internally matched cohort. However, there was no significant difference in the maximum observed response in the entire cohort over all time periods, median 3.4 [IQR, 1.0–5.4] HU/Gy (SBPT) versus 2.5 [1.6–5.2] HU/Gy (SBRT). Qualitative radiological evaluation was highly correlated with the quantitative analysis (p<0.0001).
Conclusion:
While there was no significant difference in maximum response after SBPT versus SBRT, dose-defined lung inflammation occurred earlier after proton irradiation. Further investigation is warranted into the mechanisms of inflammation and therapeutic consequences after proton versus photon irradiation.
Keywords (standardized Medical Subject Headings): Proton Therapy, Radiation Pneumonitis, Radiosurgery, Dose-Response Relationship
Introduction
Proton beam therapy holds promise in several cancer types due to its superior dosimetric properties compared to standard photon radiation therapy (RT) [1]. In the clinic, proton beam therapy has been based on the use of a generic, constant, and spatially invariant relative biological effectiveness (RBE) of 1.1 compared to standard radiation both for cancers and normal tissues [2]. However, the biological effects of protons have been vastly understudied [3]. There is emerging evidence that protons may be associated with enhanced tumor cell kill in defined genotypes, and also unexpected normal tissue reactions or toxicity in subsets of patients [3–8]. A randomized phase II clinical study of proton versus photon radiation therapy with concurrent chemotherapy in locally advanced non-small cell lung carcinoma (NSCLC) demonstrated numerically higher rates of pulmonary toxicity though this was not statistically significant [9]. We recently reported that proton therapy leads to significantly larger computed tomography (CT) density changes in normal lung compared to conventional photon RT in the treatment of post-mastectomy breast cancer patients [10]. The effects seen in the lung parenchyma were possibly the result of an increased RBE at the end of range of a single passively scattered proton beam that was used to treat the chest wall in these patients. Observations were possibly more pronounced in the setting of low dose fractions in these patients [2]. In contrast, the effects of protons when using hypo-fractionated conformal treatment approaches that give high total doses to the normal lung remain undefined, and the time and dose dependence of such changes are unknown.
Stereotactic body radiation therapy (SBRT) is a safe and effective treatment option for early-stage NSCLC, providing excellent local control and low rates of symptomatic pulmonary toxicity [11]. Lately, SBRT and SBRT-like regimens have also been used to treat metastatic patients receiving immune checkpoint inhibitors (ICI), in an effort to increase the low overall response rates of ICI in NSCLC [12, 13]. This has renewed concern about overlapping toxicities, as immune-related adverse events with ICIs include pneumonitis [14].
Therefore, the purpose of this study was to investigate the lung density changes in a unique institutional cohort of patients that received stereotactic body proton therapy (SBPT) for early-stage NSCLC, paired with a matched photon-based SBRT cohort. We sought to quantitatively evaluate lung density changes and their dynamics on serial post-treatment chest CT scans, as they have been shown to be a valid biomarker [15] for damage to the normal lung tissue and reveal time kinetics that can differentiate early, inflammatory responses from late fibrotic changes [16].
Methods and materials
Patient population
We retrospectively reviewed the records of early-stage NSCLC patients who received SBPT as part of standard care at the treating physician’s discretion or on a terminated clinical trial (NCT01525446) at Massachusetts General Hospital between July 2008 and November 2017. We matched each SBPT patient to a patient treated with SBRT during the same time period based on age, gender, smoking status, chronic obstructive pulmonary disease, tumor stage, tumor type, tumor location, and radiation dose regimen. A single investigator who was blinded to subsequent analyses performed matching of SBPT and SBRT patients. This study was performed with approval of the institutional review board. Informed consent for this minimal risk study was waived.
Treatment techniques
Patients in the SBPT cohort were treated with 3D conformal, passively-scattered proton beams while patients in the SBRT cohort were treated with 3D conformal RT, intensity-modulated RT, or volumetric modulated arc therapy. Image guidance employed daily cone beam CT for SBRT and an in-house digital imaging positioning system with/without fiducials for SBPT. Simulations were performed with customized immobilization and included helical free-breathing CT and 4D CT, resorted into 10 phases. Gating was typically performed if respiratory target motion exceeded 0.5–1.0 cm, using the Varian RPM system. The average intensity projection from the 4D CT was used for treatment planning, unless gating was applied, in which case the exhale phase (50% phase) from the 4D CT was used. For photons the planning target volume (PTV) was defined by a 5 mm margin around the internal or gross target volume (ITV/GTV). ITV was defined as motion of the gross target volume (GTV) across all 4D phases. Details of margins and planning considerations for SBPT have been reported previously [17] and are outlined in the supplementary material. Tumors included in this study were treated to a prescribed dose of 42–60 Gy in 3–5 fractions of 10–16 Gy per fraction.
Follow-up CT scans
Follow-up visits within the first year were typically scheduled at 3, 6 and 12 months from the day when RT ended and chest CT scans with 2 mm slice thickness were obtained at each follow up visit. We pragmatically grouped follow-up CTs into two time points: early (first visit, <6 months post treatment) and late (from 6 months up to 14 months after treatment).
Quantitative analysis
Each follow-up CT was registered to the radiation planning CT via deformable image registration (DIR) using plastimatch [18] and additionally checked visually to assure consistent registration quality. Dose calculation algorithms used were pencil beam based in XiO (CMS) for SBPT cases and convolution superposition in RayStation (RaySearch) for SBRT cases. In our dose response analysis, we used the physical dose corrected for RBE with a fixed value of 1.1, so all instances of dose in this manuscript can be interpreted as GyRBE for proton irradiation.
We limited our dose response analyses to the irradiated ipsilateral lung excluding the GTV/ITV. To ensure only inclusion of normal lung, we excluded the boundary region 5 mm away from the lung contour and 2 mm away from the ITV/GTV contour, to capture the majority of the high-dose region around the tumor. Based on the dose received, voxels were grouped into dose bins starting from 0 Gy to the maximum dose in 5 Gy increments, and the mean Hounsfield Unit differences (ΔHU) between the follow-up and the planning CT were obtained for these bins. Assuming negligible density change in lung voxels receiving dose <5 Gy, the mean ΔHU in this first dose bin was used to normalize the scans [16]. Individual dose response curves (DRC) were generated by plotting radiographic changes as a function of the dose received by the normal lung tissue based on data from each individual follow up CT.
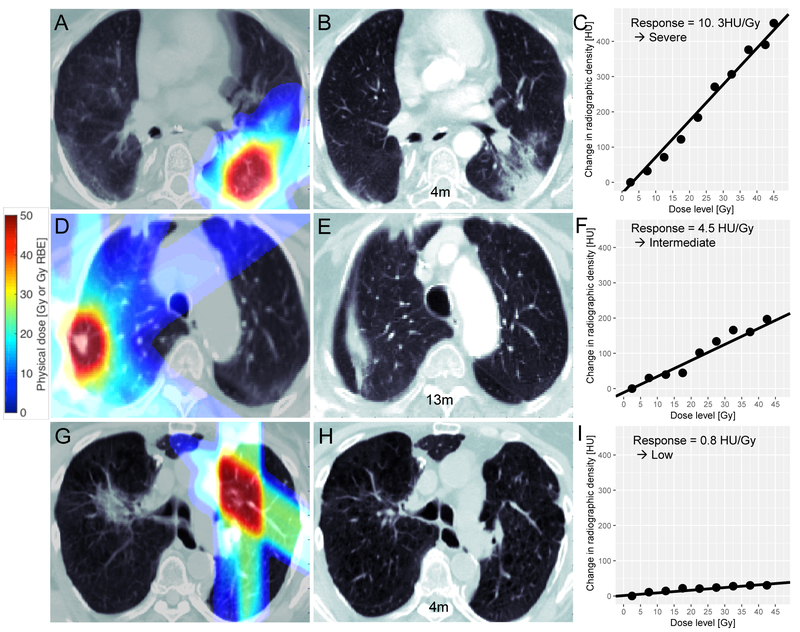
To assess the strength of the dose-response relationship for each time period, we used voxelweighted linear regression on the individual DRC, which yielded a quantitative measure of CT density change in the normal lung (unit: HU/Gy), similar to other studies [16, 19, 20]. Representative examples of individual DRCs and their linear fit can be found in Figure 1, demonstrating arbitrarily defined low (<2 HU/Gy), intermediate (2–6 HU/Gy), and severe (>6 HU/Gy) normal lung responses. To study the time dependence of the DRC, we then binned the follow-up scans into two time periods, 0–6 and 6–14 months.
Fig 1.
Illustration of SBPT (top and bottom row) and SBRT (middle row) treatment plans and assessment of lung parenchyma responses. Left column (A, D, G) planning chest CTs with dose map overlaid; Middle column (B, E, H): Example follow up CTs; Right column (C, F, I): dose response curves with linear fit showing severe, intermediate and low normal lung response; the dots represent change in radiographic change obtained from comparing the follow up CT with the planning CT and the lines represent the linear regression fit to the dose response curves. Linear regression was voxel-weighted, i.e. each point in a dose bin was weighted by the number of its constituent voxels.
We used Wilcoxon signed rank tests to assess for statistically significant differences in the DRC between paired SBPT and SBRT patients and different time periods within the same patient cohort and Spearman rank correlation for correlating the severity of response as expressed by the DRC with the qualitative radiology assessment. All tests were two-sided. All quantitative data analysis including data processing, linear regressions and statistical tests were performed using Matlab R2014b (The Mathworks Inc., Natick, MA).
Qualitative analysis
In parallel to the quantitative DIR-based analysis, a qualitative analysis of serial post treatment chest CT examinations was performed by a board-certified fellowship trained radiologist with 10 years of experience in thoracic imaging. The classification system described by Lind et al [21] was applied, dividing the lung into three regions: apical-lateral, central-parahilar, and basal-lateral. For each region, parenchymal changes were graded as either 0/no change; 1/low opacity in linear streaks; 2/moderate opacity; 3/complete opacification; and summed over all regions to determine a total score. The radiologist was aware of the tumor location but blinded to the treatment protocol and all other analyses. Routine axial 2–3 mm thick CT images obtained with a standard soft tissue reconstruction kernel were reviewed on a clinical workstation (Agfa IMPAX, Agfa Healthcare, Canton, MA) using lung windows. All findings were compared to baseline CT images obtained before treatment.
Results
We identified a total of 23 patients treated with SBPT to 42–60 Gy in 3–5 fractions. Of these, 18 patients were matched to SBRT patients treated in the same time period based on pre-defined patient, tumor, and treatment factors. An additional 5 patients had received both SBRT and SBPT sequentially to distinct, contralateral lung tumors. These patients were not matched to other SBRT patients but rather the different treatment courses were regarded as an internally matched cohort. For characteristics of both externally and internally matched cohorts, see Table 1. The most important features including current smoker status and disease stage were exactly matched except for two internal pairs in which disease stage differed. Detailed matching information is shown in Table S1 in the supplemental material.
Table 1.
Patient cohort; NSCLC = Non-Small Cell Lung Cancer, COPD = chronic obstructive pulmonary disease, MLD = mean lung dose, V20 calculation of the biological effective dose is based on α/β =4.
| SBPT patients | SBRT patients | |
|---|---|---|
| Median Age [IQR] | 70.6 [64–76] | 75.8 [71–80] |
| Sex | ||
| Male | 6 | 7 |
| Female | 17 | 16 |
| Tumor Histology | ||
| Adenocarcinoma | 15 | 11 |
| Squamous Cell | 2 | 1 |
| Unspecified NSCLC | 6 | 11 |
| Lobe | ||
| Upper | 16 | 16 |
| Lower | 7 | 7 |
| Tumor Stage | ||
| T1a | 19 | 17 |
| T1b | 2 | 3 |
| T2a | 2 | 3 |
| Lung Disease | ||
| None | 8 | 10 |
| COPD, no home O2 | 9 | 10 |
| COPD, with home O2 | 6 | 3 |
| Current Smoker | ||
| Yes | 5 | 5 |
| No | 18 | 18 |
| Radiation Regimen | ||
| 48 Gy/4 fractions | 13 | 15 |
| 42 Gy/3 fractions | 3 | 0 |
| 48 Gy/3 fractions | 5 | 0 |
| 45 Gy/3 fractions | 1 | 0 |
| 50 Gy/5 fractions | 1 | 4 |
| 60 Gy/5 fractions | 0 | 3 |
| 45 Gy/5 fractions | 0 | 1 |
| Median MLD [IQR] | 2.0 Gy [1.7–2.8] | 2.6 Gy [1.8–3.4] |
| Median V20 [IQR] | 0.065 [0.06–0.09] | 0.062 [0.03–0.10] |
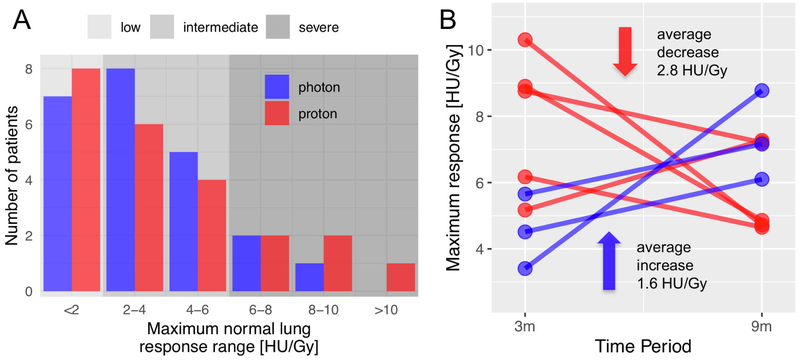
We analyzed a total of 150 CT scans over the first year after completion of RT. We binned lung changes as early (median post-RT CT interval of 3 months) and late (median of 9 months). Figure 2A shows the distribution of the maximum severity of lung density changes in the SBPT and SBRT cohorts over all time points. There was large inter-patient variability, with about one third of the patients (8 SBPT and 7 SBRT) showing no distinct or low responses in the normal lung (defined as <2 HU/Gy). Notably, only SBPT, but not SBRT, caused a severe response with a lung density change greater than 10 HU/Gy.
Fig 2.
A: histogram of maximum normal lung Maximum normal lung response range [HU/Gy] response for all time points for all individual patients showing high inter-patient variability in severity of inflammation; B: Response dynamics in severe responders (>6 HU/Gy), the maximum normal lung responses at two time points (median, 3 versus 9 months) only for patients with severe inflammation (>6 HU/Gy).
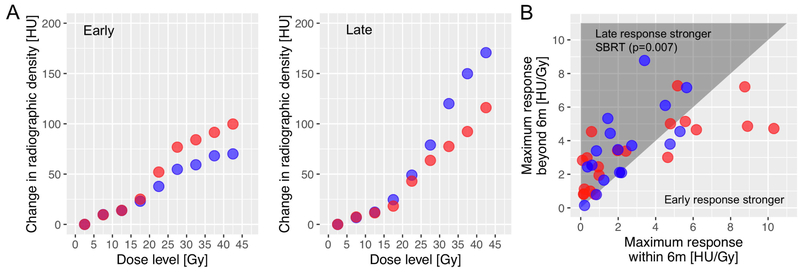
When we evaluated the response kinetics we observed that SBPT led to an accelerated time course of normal lung response. This was pronounced in seven patients who showed severe inflammation, i.e., a response > 6 HU/Gy (Figure 2B), where the early severe response decreased at the next follow-up in four out of five SBPT patients by an average of 2.8 HU/Gy but increased in the three SBRT patients by an average of 1.6 HU/Gy. This difference was significant in the whole cohort: Figure 3B illustrates that a strong normal lung response often peaked early, especially in SBPT patients (cf. right side of graph). Following SBRT, however, the severity of response kept increasing beyond 6 months (p=0.007). After SBPT on the other hand, the response decreased for the severe responders, and was generally unchanged in the whole population (p=0.2). The voxel weighted average of the DRCs as illustrated in Figure 3A also reveals this difference.
Fig 3.
A: Comparison of the normal lung response of the SBPT vs SBRT cohort in terms of the voxel weighted average HU difference for each dose bin as a function of center dose of each dose bin for the early/late (left/right plot in the panel) time point; B: the late normal lung response (9 months) plotted against the early response (3 months) for all individual SBPT (red) and SBRT (blue) patients, SBRT shows significant increase of late vs early response (p=0.007).
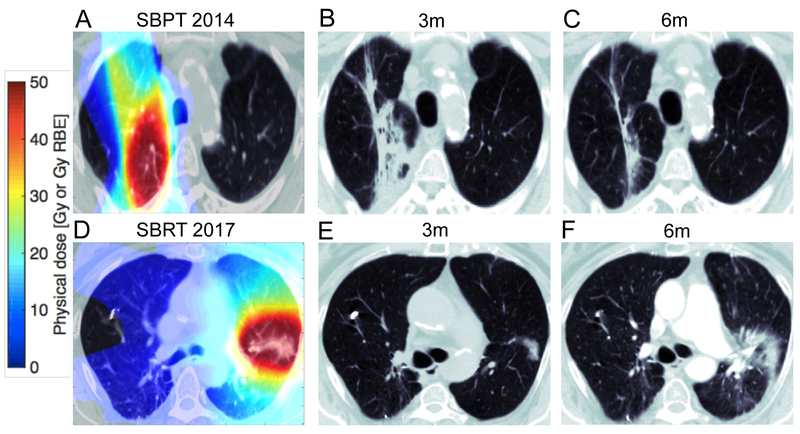
This differential dynamic was especially pronounced in the internal cohort, i.e., the patients who received sequential treatment with SBPT and SBRT to separate lesions. Figure 4 shows examples of the same patient treated first with SBPT (Figure 4A–C) to the right lung, leading to a severe inflammatory response at 3 months (Figure 4B, 8.4 HU/Gy) that quickly resolved after just 6 months (Figure 4C, 4.4 HU/Gy). After being treated with SBRT to the left lung 3 years later, normal lung showed distinctly less inflammation (0.4 HU/Gy at 3 months vs. 2.4 HU/Gy at 6 months) with a different time course (see Figure 4, lower panel).
Fig 4.
Comparison of one internally matched patient A/D: planning CT overlaid with the dose map for SBPT (A) and SBRT (B); B/C/E/F: The follow-up CT at the early/late time point for this patient; Bottom panels is the corresponding data from the same patient treated with SBRT 3 years later.
We found a high correlation between the qualitative radiology grade and the quantitative response extracted from the HU changes (p<0.0001), validating our analysis. The maximum quantitative response (median[IQR]) of the patient cohort was 3.4 [1.0–5.4] HU/Gy (SBPT) versus 2.5 [1.6–5.2] HU/Gy (SBRT) over all time points, the median of the difference between patient pairs for the early time period was 1.0 HU/Gy.
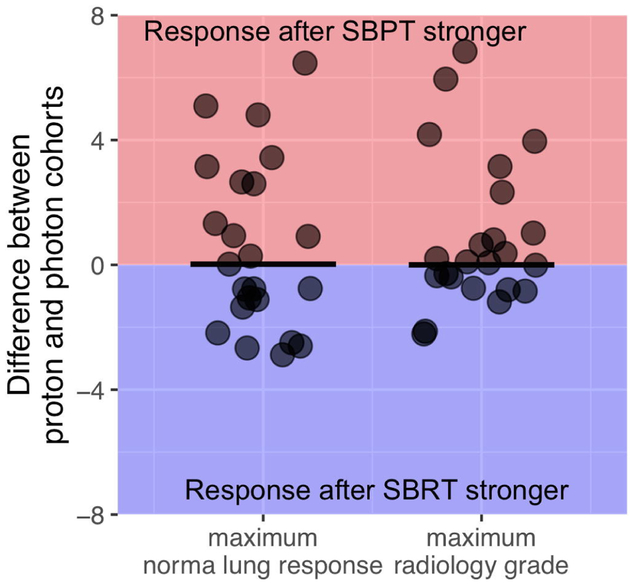
Figure 5 shows the distribution of differences in maximum lung response for all patient pairs, i.e. subtracting the maximum radiographic response (left) and radiology grade (right) of a SBPT patient from its paired SBRT counterpart. Even though the distribution shows a clear tail towards a stronger response post-SBPT, the difference in this paired analysis using non-parametric tests did not reach statistical significance.
Fig 5.
Maximum normal lung response (left) and radiology grade (right) for the whole cohort with the bars representing the median difference, which is close to 0. The average difference is 0.57 for the maximum normal lung response and 0.91 for the maximum radiology score.
To test the hypothesis that the relative difference in lung density change between protons and photons is potentially higher for lower doses, as observed in our other study analyzing smaller fraction sizes [10], we restricted our analysis to the areas of the lung receiving only low doses (0–15 Gy total physical dose, not corrected for fractionation), and compared it to the analysis using the entire dose range. The analysis shows a weak trend towards a higher differential for the SBPT versus SBRT dose response in the low-dose region (p=0.1).
Discussion
The time and dose-dependence of radiographic changes in normal lung after hypo-fractionated proton compared to photon RT have not been investigated before. Our analysis revealed a differential dynamic between NSCLC patients who received SBPT versus SBRT. Specifically, SBPT patients showed slightly more severe inflammatory responses (5 SBPT vs 3 SBRT patients, defined as > 6HU/Gy), and the slopes of the early responses were larger, though not significantly so. For SBRT on the other hand, the severity of response significantly increased from early to late time periods of follow-up. Studies investigating radiation-induced lung injury usually differentiate between radiation pneumonitis (RP) and radiation fibrosis (RF), even though they are often seen as distinct parts of the same continuous process [22, 23]. RP is an early inflammatory response that usually resolves quickly while RF is a late effect associated with fibroblast proliferation, collagen accumulation and chronic reduced lung function. Even though symptomatic pulmonary toxicity in this patient population is generally low [11], our data suggests that SBPT could induce more (asymptomatic) inflammation than SBRT.
We speculate that a more pronounced inflammatory response associated with SBPT could affect studies aiming to combine proton beam therapy with ICI. A higher inflammatory response could yield higher synergy with checkpoint inhibition, as the recruitment and activation of dendritic cells and tumor-specific T cells plays a large role in the synergy between the radiation and checkpoint inhibition [24]. A fast onset of such an inflammatory response could further increase this synergy, as it occurs closer to the release of tumor-associated antigens from irradiated tumor cells.
In general, the overall range of the lung response (HU/Gy) in our study is similar to published results from patients receiving SBRT [19]. SBPT led to a similar, linear increase in lung density change with dose for the early time period of follow-up. For the later time period, the doseresponse curve bent to reveal a supra-linear relationship similar to other studies investigating normal lung response after large doses per fraction [25]. Although the normal lung response in the SBPT cohort is numerically higher and skewed towards more severe responses, the inter-patient variability is large, and this difference is therefore not statistically significant. The difference in radiographic changes between SBRT and SBPT are larger if analyzed only the internal cohort (n=5) and in the patients showing severe responses (see Figure 2B), but here the numbers are too small to draw definitive conclusions. This high variability in normal lung response among patients has been noted by other groups as well [16, 19].
Assuming the same magnitude of difference between SBPT and SBRT patients that we have observed for the early time period (median difference between matched pairs: 1.0 HU/Gy, standard deviation of the difference: 3.5 HU/Gy) one would need to compare 99 proton patients to their matched photon equivalents to have an 80% probability to show a significant difference. Including only very early CT scans (<3 months) could yield larger differences and reduce the required number of patients.
Notably, slightly higher rates of RP have been observed after proton beam therapy for locally-advanced NSCLC [9, 26], possibly indicating a higher inflammatory response. However, these differences were not statistically significant, fraction sizes were lower, and results were confounded by concurrent chemotherapy.
Limitations of our study include its retrospective nature and the large inter-patient variability in response. The extensive matching process was intended to address some of these issues. SBPT was selected as part of a clinical pilot trial (NCT01525446) and at the discretion of the treating physician. While selection bias cannot be ruled out, we feel that patient, tumor, and dosing characteristics are fairly typical for medically inoperable patients with early-stage NSCLC. We restricted ourselves to up to about 1 year of follow-up as anatomical changes have been shown to stabilize after 12 months [16]. Furthermore, photon treatments included VMAT, IMRT and 3Dconformal techniques, leading to additional heterogeneity. While we are confident that our voxelweighted analysis, which takes the underlying dose distribution explicitly into account, addresses this issue to a large extent, we recommend that future studies focus on more homogeneously treated photon patients.
In summary, our results indicate no significant difference in the overall severity of normal lung response after SBPT compared to SBRT in our study population, but a difference in time course. This warrants further investigation into the mechanisms of inflammation after proton and photon irradiation in lung. The large inter-patient variability presents the main barrier to further study, which suggests two promising avenues for further research: either the use of animal models to produce a more consistent environment, or the analysis of patients receiving multiple courses of hypo-fractionated treatments using both protons and photons sequentially. Under which conditions the more pronounced inflammatory response after proton beam therapy may translate into symptomatic pulmonary or chest wall toxicity also warrants further study.
Supplementary Material
Highlights.
Unique cohort of lung cancer patients treated with SBPT and matched to SBRT patients
Lung inflammation increased linear with dose with no difference in maximum response
Lung inflammation kept increasing late after SBRT, more pronounced early after SBPT
Financial Support:
This work was supported in part by the National Cancer Institute Grant U19CA21239 (H.P., H.W.)
Footnotes
Publisher's Disclaimer: This is a PDF file of an unedited manuscript that has been accepted for publication. As a service to our customers we are providing this early version of the manuscript. The manuscript will undergo copyediting, typesetting, and review of the resulting proof before it is published in its final citable form. Please note that during the production process errors may be discovered which could affect the content, and all legal disclaimers that apply to the journal pertain.
Conflicts of interest: None of the authors declare related conflicts of interest.
References
- [1].Allen AM, Pawlicki T, Dong L, Fourkal E, Buyyounouski M, Cengel K, et al. An evidence based review of proton beam therapy: The report of ASTRO,Äôs emerging technology committee. Radiotherapy and Oncology. 2012;103:8–11. [DOI] [PubMed] [Google Scholar]
- [2].Harald P Relative biological effectiveness (RBE) values for proton beam therapy. Variations as a function of biological endpoint, dose, and linear energy transfer. Physics in Medicine & Biology. 2014;59:R419. [DOI] [PubMed] [Google Scholar]
- [3].Willers H, Allen A, Grosshans D, McMahon SJ, von Neubeck Cr, Wiese C, et al. Toward A variable RBE for proton beam therapy. Radiotherapy and Oncology. 2018;128:68–75. [DOI] [PubMed] [Google Scholar]
- [4].Chaudhary P, Marshall TI, Currell FJ, Kacperek A, Schettino G, Prise KM. Variations in the Processing of DNA Double-Strand Breaks Along 60-MeV Therapeutic Proton Beams. International Journal of Radiation Oncology*Biology*Physics. 2016;95:86–94. [DOI] [PMC free article] [PubMed] [Google Scholar]
- [5].Cuaron JJ, Chang C, Lovelock M, Higginson DS, Mah D, Cahlon O, et al. Exponential Increase in Relative Biological Effectiveness Along Distal Edge of a Proton Bragg Peak as Measured by Deoxyribonucleic Acid Double-Strand Breaks. International Journal of Radiation Oncology*Biology*Physics. 2016;95:62–9. [DOI] [PMC free article] [PubMed] [Google Scholar]
- [6].Peeler CR, Mirkovic D, Titt U, Blanchard P, Gunther JR, Mahajan A, et al. Clinical evidence of variable proton biological effectiveness in pediatric patients treated for ependymoma. Radiotherapy and Oncology. 2016;121:395–401. [DOI] [PMC free article] [PubMed] [Google Scholar]
- [7].Saager M, Peschke P, Brons S, Debus Jr, Karger CP. Determination of the proton RBE in the rat spinal cord: Is there an increase towards the end of the spread-out Bragg peak? Radiotherapy and Oncology. 2018;128:115–20. [DOI] [PubMed] [Google Scholar]
- [8].Sorensen BS, Bassler N, Nielsen S, Horsman MR, Grzanka L, Spejlborg H, et al. Relative biological effectiveness (RBE) and distal edge effects of proton radiation on early damage in vivo. Acta Oncologica. 2017;56:1387–91. [DOI] [PubMed] [Google Scholar]
- [9].Liao Z, Lee JJ, Komaki R, Gomez DR, O,ÄôReilly MS, Fossella FV, et al. Bayesian Adaptive Randomization Trial of Passive Scattering Proton Therapy and Intensity-Modulated Photon Radiotherapy for Locally Advanced Non,ÄìSmall-Cell Lung Cancer. Journal of Clinical Oncology. 2018;36:1813–22. [DOI] [PMC free article] [PubMed] [Google Scholar]
- [10].Underwood TSA, Grassberger C, Bass R, MacDonald SM, Meyersohn NM, Yeap BY, et al. Asymptomatic Late-phase Radiographic Changes Among Chest-Wall Patients Are Associated With a Proton RBE Exceeding 1.1. International Journal of Radiation Oncology*Biology*Physics. 2018;101:809–19. [DOI] [PubMed] [Google Scholar]
- [11].Sebastian NT, Xu-Welliver M, Williams TM. Stereotactic body radiation therapy (SBRT) for early stage nonsmall cell lung cancer (NSCLC): contemporary insights and advances. Journal of Thoracic Disease; Vol 10, Supplement 21 (August 2018): Journal of Thoracic Disease (Advances in Radiation Oncology for Thoracic Malignancies). 2018. [DOI] [PMC free article] [PubMed] [Google Scholar]
- [12].Ngwa W, Irabor OC, Schoenfeld JD, Hesser Jr, Demaria S, Formenti SC. Using immunotherapy to boost the abscopal effect. Nature Reviews Cancer. 2018;18:313. [DOI] [PMC free article] [PubMed] [Google Scholar]
- [13].Taunk NK, Rimner A, Culligan M, Friedberg JS, Brahmer J, Chaft J. Immunotherapy and radiation therapy for operable early stage and locally advanced non-small cell lung cancer. Translational Lung Cancer Research; Vol 6, No 2 (April 2017): Translational Lung Cancer Research (Combining Radiation Therapy and Immunotherapy for Thoracic Malignancies). 2017. [DOI] [PMC free article] [PubMed] [Google Scholar]
- [14].Hwang WL, Niemierko A, Hwang KL, et al. Clinical outcomes in patients with metastatic lung cancer treated with pd-1/pd-l1 inhibitors and thoracic radiotherapy. JAMA Oncology. 2018;4:253–5. [DOI] [PMC free article] [PubMed] [Google Scholar]
- [15].Veiga C, Landau D, Devaraj A, Doel T, White J, Ngai Y, et al. Novel CT-Based Objective Imaging Biomarkers of Long-Term Radiation-Induced Lung Damage. International Journal of Radiation Oncology* Biology* Physics. 2018;102:1287–98. [DOI] [PubMed] [Google Scholar]
- [16].Bernchou U, Schytte T, Bertelsen A, Bentzen SrM, Hansen O, Brink C. Time evolution of regional CT density changes in normal lung after IMRT for NSCLC. Radiotherapy and Oncology. 2013;109:89–94. [DOI] [PubMed] [Google Scholar]
- [17].Westover KD, Seco J, Adams JA, Lanuti M, Choi NC, Engelsman M, et al. Proton SBRT for medically inoperable stage I NSCLC. Journal of thoracic oncology : official publication of the International Association for the Study of Lung Cancer. 2012;7:1021–5. [DOI] [PMC free article] [PubMed] [Google Scholar]
- [18].Sharp GL, R & Wolfgang John & Chen G & Peroni Marta & Spadea Maria& Mori Shinichiro & Zhang J & Shackleford J & Kandasamy Nagarajan. PLASTIMATCH– AN OPEN SOURCE SOFTWARE SUITE FOR RADIOTHERAPY IMAGE PROCESSING. 2010.
- [19].Diot Q, Kavanagh B, Schefter T, Gaspar L, Stuhr K, Miften M. Regional Normal Lung Tissue Density Changes in Patients Treated With Stereotactic Body Radiation Therapy for Lung Tumors. International Journal of Radiation Oncology*Biology*Physics. 2012;84:1024–30. [DOI] [PubMed] [Google Scholar]
- [20].Vinogradskiy Y, Diot Q, Kavanagh B, Schefter T, Gaspar L, Miften M. Spatial and dose,Äìresponse analysis of fibrotic lung changes after stereotactic body radiation therapy. Medical Physics. 2016;40:081712. [DOI] [PubMed] [Google Scholar]
- [21].Lind PARM, Svane G, Gagliardi G, Svensson C. Abnormalities by pulmonary regions studied with computer tomography following local or local-regional radiotherapy for breast cancer. International Journal of Radiation Oncology*Biology*Physics. 1999;43:489–96. [DOI] [PubMed] [Google Scholar]
- [22].Graves PR, Siddiqui F, Anscher MS, Movsas B. Radiation Pulmonary Toxicity: From Mechanisms to Management. Seminars in Radiation Oncology. 2010;20:201–7. [DOI] [PubMed] [Google Scholar]
- [23].Tsoutsou PG, Koukourakis MI. Radiation pneumonitis and fibrosis: Mechanisms underlying its pathogenesis and implications for future research. International Journal of Radiation Oncology*Biology*Physics. 2006;66:1281–93. [DOI] [PubMed] [Google Scholar]
- [24].Kanegasaki S, Matsushima K, Shiraishi K, Nakagawa K, Tsuchiya T. Macrophage Inflammatory Protein Derivative ECI301 Enhances the Alarmin-Associated Abscopal Benefits of Tumor Radiotherapy. Cancer Research. 2014;74:5070. [DOI] [PubMed] [Google Scholar]
- [25].Diot Q, Marks LB, Bentzen SM, Senan S, Kavanagh BD, Lawrence MV, et al. Comparison of Radiation-Induced Normal Lung Tissue Density Changes for Patients From Multiple Institutions Receiving Conventional or Hypofractionated Treatments. International Journal of Radiation Oncology*Biology*Physics. 2014;89:626–32. [DOI] [PubMed] [Google Scholar]
- [26].Shusharina N, Liao Z, Mohan R, Liu A, Niemierko A, Choi N, et al. Differences in lung injury after IMRT or proton therapy assessed by 18FDG PET imaging. Radiotherapy and Oncology. 2018;128:147–53. [DOI] [PubMed] [Google Scholar]
Associated Data
This section collects any data citations, data availability statements, or supplementary materials included in this article.


