Abstract
Aim
Experiments have indicated that skin perfusion in mice is sensitive to reductions in environmental O2 availability. Specifically, a reduction in skin-surface PO2 attenuates transcutaneous O2 diffusion, and hence epidermal O2 supply. In response, epidermal HIF-1α expression increases and facilitates initial cutaneous vasoconstriction and subsequent nitric oxide-dependent vasodilation. Here, we investigated whether the same mechanism exists in humans.
Methods
In a first experiment, eight males rested twice for 8 h in a hypobaric chamber. Once, barometric pressure was reduced by 50%, while systemic oxygenation was preserved by O2-enriched (42%) breathing gas (HypoxiaSkin), and once barometric pressure and inspired O2 fraction were normal (Control1). In a second experiment, nine males rested for 8 h with both forearms wrapped in plastic bags. O2 was expelled from one bag by nitrogen flushing (AnoxiaSkin), whereas the other bag was flushed with air (Control2). In both experiments, skin blood flux was assessed by laser Doppler on the dorsal forearm, and HIF-1α expression was determined by immunohistochemical staining in forearm skin biopsies.
Results
Skin blood flux during HypoxiaSkin and AnoxiaSkin remained similar to the corresponding Control trial (P = 0.67 and P = 0.81). Immuno-histochemically stained epidermal HIF-1α was detected on 8.2 ± 6.1 and 5.3 ± 5.7% of the analysed area during HypoxiaSkin and Control1 (P = 0.30) and on 2.3 ± 1.8 and 2.4 ± 1.8% during AnoxiaSkin and Control2 (P = 0.90) respectively.
Conclusion
Reductions in skin-surface PO2 do not affect skin perfusion in humans. The unchanged epidermal HIF-1α expression suggests that epidermal O2 homoeostasis was not disturbed by HypoxiaSkin/AnoxiaSkin, potentially due to compensatory increases in arterial O2 extraction.
Keywords: altitude, hypoxia-inducible factor-1α, nitric oxide, skin blood flow, vasoconstriction, vasodilation
Systemic hypoxia induces mild vasodilation in the non-glabrous skin of humans (Leuenberger et al. 1999, Weisbrod et al. 2001, Minson 2003, Simmons et al. 2007). In hypoxic environments, this effect may be modified by a direct vasomotor response to the reduced oxygen tension (PO2) on the skin surface. The O2 demand of the human skin to a depth of ~0.4 mm is almost exclusively covered by transcutaneous O2 diffusion, which is driven by the transcutaneous PO2 gradient and hence decreases in hypoxic environments (Stucker et al. 2002). In mice, the resulting reduction in O2 supply to epidermal cells seems to facilitate the stabilization of hypoxia-inducible factor-1α (HIF-1α) (Boutin et al. 2008, Hamanaka et al. 2016). Epidermal HIF-1α, in turn, appears to induce a bipartite cutaneous vasomotor response, consisting of initial vasoconstriction and subsequent nitric oxide (NO)-mediated vasodilation. In the animal model, the resulting changes in skin blood flow had important systemic implications as they influenced arterial pressure, and modulated the erythropoietin response to systemic hypoxia by channelling arterial O2 delivery first towards and then away from kidneys and liver (Boutin et al. 2008).
Whether a reduction in skin-surface PO2 has a similar effect on skin perfusion in humans is barely explored. Rasmussen et al. (2012) observed similar increases in skin blood flow during either exposure to hypobaric hypoxia or inhalation of a hypoxic gas mixture through a mouthpiece, that is with a normoxic PO2 on the skin surface. Nevertheless, systemic hypoxia facilitated pronounced (~120%) increases in skin blood flow in both conditions, which could have masked a vasomotor response to the reduced skin-surface PO2 in hypobaric hypoxia.
In this study, we aimed to isolate a potential skin blood flow response to reductions in skin-surface PO2 from the cutaneous vasodilatory effect of systemic hypoxia. Two experiments were conducted: in the first experiment, eight subjects were exposed for 8 h to hypobaric hypoxia, while the inspired O2 fraction was increased to preserve systemic oxygenation (HypoxiaSkin). Based on animal experiments (Boutin et al. 2008), we hypothesized HypoxiaSkin to first reduce and subsequently increase skin blood flow. We further expected this response to be accompanied by increased epidermal HIF-1α expression and, in the later phase of exposure, circulating NO. In the second experiment, we increased the stimulus by exposing one forearm of nine subjects for 8 h to anoxia (AnoxiaSkin). Again, we hypothesized AnoxiaSkin to first reduce and subsequently increase skin blood flow as well as enhance epidermal HIF-1α expression.
Materials and methods
This study was approved by the Human Ethics Committee of Stockholm (ref 2015-315-31-4) and conducted in accordance with the Declaration of Helsinki.
Subjects
Eight healthy males (27 ± 8 years, 182 ± 8 cm, 76.1 ± 7.8 kg) were included as study subjects in the HypoxiaSkin experiment, and nine healthy males (28 ± 5 years, 183 ± 5 cm, 87.9 ± 16.2 kg) in the AnoxiaSkin experiment. All subjects gave written informed consent to participation. None had travelled to altitudes >1000 m during the 4 weeks preceding the experiments.
HypoxiaSkin experiment
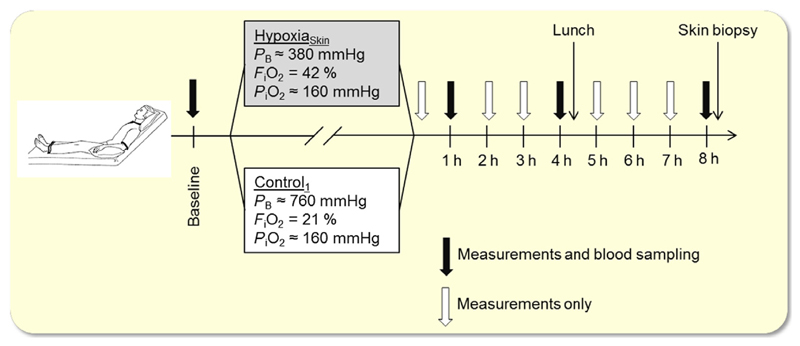
The protocol of the HypoxiaSkin study is summarized in Figure 1. Subjects reported to the laboratory on 2 days, separated by at least 1 week, wearing a short-sleeved T-shirt and shorts. After insertion of a catheter into an antecubital vein, subjects were placed semirecumbent in a hypobaric chamber, in which ambient air was controlled at thermoneutral temperature (~27 °C). Following instrumentation (~20 min), baseline measurements of the variables specified below were performed. Thereafter, the barometric pressure was, on 1 day, reduced by ~50% (to 380 mmHg, corresponding to ~5500 m altitude) for Hypoxiaskin and maintained on the other day (Control1). The order of HypoxiaSkin and Control1 was randomized between subjects. To blind the subjects, barometric pressure was repeatedly slightly increased and decreased at the onset of both trials. Subjects wore a face mask that was connected on the inspiratory side to a Douglas bag. During HypoxiaSkin, this Douglas bag was filled with a hyperoxic gas mixture (42% O2 in N2) so that inspired PO2 remained normal. During Control1, the Douglas bag was filled with normal air. Both breathing gases were bubbled through a water container for humidification before entering the Douglas bag. Throughout both trials, capillary oxyhaemoglobin saturation was continuously monitored by pulse oximetry (Radical-7; Masimo®, Irvine, CA, USA) on the subjects’ ear lobes.
Figure 1.
Protocol of the HypoxiaSkin study. PB, barometric pressure; FiO2, O2 fraction in the inspired gas mixture; PiO2, inspired partial pressure of O2.
When the final barometric pressure was reached, subjects remained still in the semirecumbent position for 8 h while watching movies. To assess the efficiency of the blinding process, they filled out a questionnaire immediately after the final barometric pressure was reached, as well as after four and 8 h of exposure, reporting whether they believed that barometric pressure was reduced or not. After 4 h, a sandwich was provided. To avoid inspiration of chamber air, subjects removed the masks only to take a bite and put it back on for chewing and swallowing. Drinking water was provided ad libitum throughout the day employing the same mask procedure.
After 8 h, a circular skin biopsy with a diameter of 3 mm was obtained under local anaesthesia (1% lidocaine) from the dorsal forearm, using a biopsy punch (Miltex, York, PA, USA). Samples were mounted in an embedding compound (Tissue-Tek O.C.T., Sakura Finetek, Alphen aan den Rijn, the Netherlands) and immediately frozen on dry ice. Subsequently, the barometric pressure was restored (if applicable), again, performing repeated increases and decreases in both conditions.
Measurements
The following measurements were conducted during baseline, after 10 min, and thereafter at every hour of exposure: Changes in skin blood flux were measured at a rate of 10 Hz on the dorsal side of the forearm by laser Doppler flowmetry (VMS-LDF2; Moor Instruments, Axminster, UK) using an optic probe (VP1/7; Moor Instruments). To examine whether HypoxiaSkin differently affects glabrous skin, we also monitored skin blood flux on the tip of the index finger of the same arm. Due to the variability of the microvasculature, laser Doppler-assessed skin blood flux depends on the sampling location (Obeid et al. 1990). Accordingly, the sensors were stabilized with a flexible probe (PH1-V2, Moore) that was firmly connected to the skin with double-sided adhesive tape and were not moved throughout the entire exposure. Although only the data collected at the measurement periods specified above were used for the analysis, skin blood flux was monitored continuously throughout the exposure to detect deteriorations in signal quality. Laser Doppler signal stability over extended periods of continuous measurement has previously been confirmed (Sundberg 1984). Both laser Doppler probes were calibrated before each trial against Brownian motion with a standardized colloidal suspension of polystyrene microspheres.
Arterial pressure was measured at a sampling rate of 200 Hz using the volume-clamp method (Finometer PRO; Finapres Medical Systems B.V., Amsterdam, the Netherlands), with the pressure cuff placed around the middle phalanx of the middle finger, and the reference pressure transducer placed at the vertical level of the heart. The pressure cuff was removed after each measurement period for subject comfort, and the Finometer was recalibrated at the onset of the next measurement period.
Heart rate was derived from the arterial pressure curves as the inverse of the interbeat interval.
An index of cardiac stroke volume was determined by a three-element model of arterial input impedance (Modelflow, Finometer PRO) incorporating age, sex, height and weight from the arterial pressure waveform (Wesseling et al. 1993).
Cardiac output was calculated by multiplication of stroke volume with heart rate.
All these measurements were performed over a period of 10 min at each measurement time point (except after 10 min of exposure, where the measurement period was only 5 min). Unfiltered raw data were visually inspected for artefacts and then averaged over the respective measurement period for analysis.
Venous blood sampling
During baseline, as well as after 1, 4 and 8 h of exposure, we collected 15 mL of venous blood. Nitrite () concentration was assessed as a marker for circulating NO (Lauer et al. 2001) by chemiluminescence (NOA 280i; GE Analytical Instruments, Boulder, CO, USA) in plasma obtained from these samples. Concentrations of erythropoietin and vascular endothelial growth factor (VEGF), a recognized HIF-1α target, were quantified in serum by sandwich ELISA (Human Quantikine ELISA Kit, DVE00 and DEP00, respectively, R&D systems, Minneapolis, MN, USA). All samples were assayed in duplicate by a blinded investigator. The techniques and materials used in this analysis were in accordance with the protocol provided by the company. Optical density was quantified on a VersaMax microplate reader using softmax Pro 6.3 Software (Molecular Devices, Wokingham, UK).
Epidermal HIF-1α expression
Frozen sections (8 μm) of skin biopsies were placed on glass slides and fixed in ice-cold acetone for 10 min, followed by incubation with 1% hydrogen peroxide (H2O2) in phosphate-buffered saline (PBS) for inactivation of endogenous peroxidase activity. After incubation with PBS containing 3% bovine serum albumin (BSA) for 1 h at room temperature, a murine anti-human HIF-1α antibody (NB 100-131; Novus Biologicals, Littleton, CO, USA) diluted 1 : 100 in PBS with 1% BSA was applied to the sections and incubated overnight at 4 °C. For negative control stainings, the primary antibody was substituted with 1% BSA. Resultant antigen–antibodyenzyme complex was visualized using diaminobenzidine (DAB) as chromogenic substrate for peroxidase. As a control, nuclei were counterstained with haematoxylin. The sections were mounted with Faramount Aqueous Mounting Medium (DAKO A/S). With an Axio Imager M2 (Zeiss, Oberkochen, Germany), 40× pictures of dermal and epidermal regions were taken, and stained areas were quantified using imagej software (National Institutes of Health, Bethesda, MD, USA). The stained fraction of the analysed area was used for the quantification of epidermal HIF-1α expression (Rizzardi et al. 2012, Cowburn et al. 2013).
AnoxiaSkin experiment
Subjects reported to the laboratory on 1 day and were placed in the same position as in the HypoxiaSkin experiment. They were dressed in shorts and T-shirt, and the room air temperature was controlled at ~27 °C. A plastic bag was placed over each forearm with an opening at the bottom at wrist level, so that the hands were free. The bag was loosely tightened around the arm at elbow and wrist levels with elastic tape. A small hole was cut into each bag, through which a plastic hose was inserted. The holes were then sealed around the hose with tape. One hose was connected to a cylinder containing pure N2 (AnoxiaSkin), and the other to a cylinder containing normal air (Control2). Gas flow from both cylinders was then started and regulated so that there was a slight overpressure in each bag, with gas flowing out at the openings at the elbows and wrists. The continuous inflow of N2 rapidly washed out any residual O2 from the AnoxiaSkin bag, as confirmed on several occasions (Datex Normocap 200 Oxy; Instrumentarium Corp., Helsinki, Finland). After initiation of the gas flow, subjects remained still while watching movies. A sandwich was provided after 4 h. After 8 h, another hole was cut into each plastic bag, through which skin biopsies were obtained as described above. During the biopsy procedure, the gas flow into the bags was increased to prevent inflow of room air. After the biopsies were obtained, the gas flow was stopped and the plastic bags were removed.
Measurements
In the AnoxiaSkin experiment, we measured changes in skin blood flux on the dorsal side of both forearms with laser Doppler after each hour of exposure. Epidermal HIF-1α expression was assessed in the biopsies as described above.
Statistics
Statistical analyses were performed using statistica 8.0 (StatSoft, Tulsa, OK, USA). All data are reported as mean ± SD. Normal distribution of the data was confirmed by Shapiro–Wilk tests. Subsequently, a two-way (condition × time) general linear model repeated measures anova was used to examine the differences in all variables. Mauchly’s test was conducted to assess for sphericity, and the Greenhouse–Geisser ε correction was used to adjust the degrees of freedom, when the assumption of sphericity was not satisfied. When anova revealed significant F-ratio for interaction, pairwise comparisons were performed with Tukey honestly significant difference post hoc test to assess differences between single measurement points. The alpha level of significance was set a priori at 0.05.
Results
HypoxiaSkin experiment
Methodological evaluation
Continuous pulse oximetry confirmed normal (~97%) capillary oxyhaemoglobin saturation throughout both the HypoxiaSkin and Control1 trials, hence excluding inspiration of hypoxic air during HypoxiaSkin.
Subjects replied 48 times whether they believed that barometric pressure was reduced or not (three times per subject and trial). They were indecisive 38 times and guessed correctly twice and incorrectly eight times, hence confirming efficient blinding.
Skin blood flux
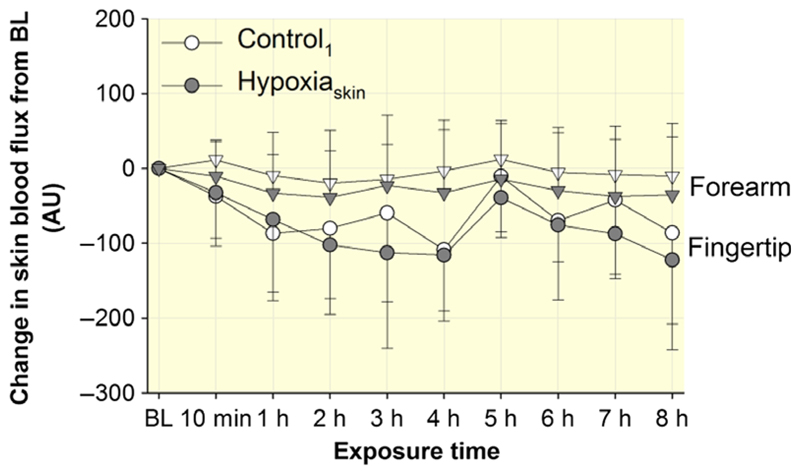
At baseline before the start of HypoxiaSkin and Control1, skin blood flux on the forearm was 137 ± 89 and 123 ± 61 arbitrary units (AU; P = 0.60), whereas skin blood flux on the fingertip was 376 ± 85 and 353 ± 125 AU (P = 0.74) respectively. Changes in skin blood flux from these baseline values are illustrated in Figure 2; they were similar in HypoxiaSkin and Control1 for both the forearm (P = 0.67) and the fingertip (P = 0.78).
Figure 2.
Effect of HypoxiaSkin on skin blood flux. Skin blood flux was measured in arbitrary units (AU) before (baseline, BL), after 10 min and then after every hour of exposure on the dorsal forearm (triangles) and on the index fingertip (circles). Results are presented as changes from the BL values. Data points represent means ± SD. No significant differences were observed between Control1 and HypoxiaSkin.
Epidermal HIF-1α expression
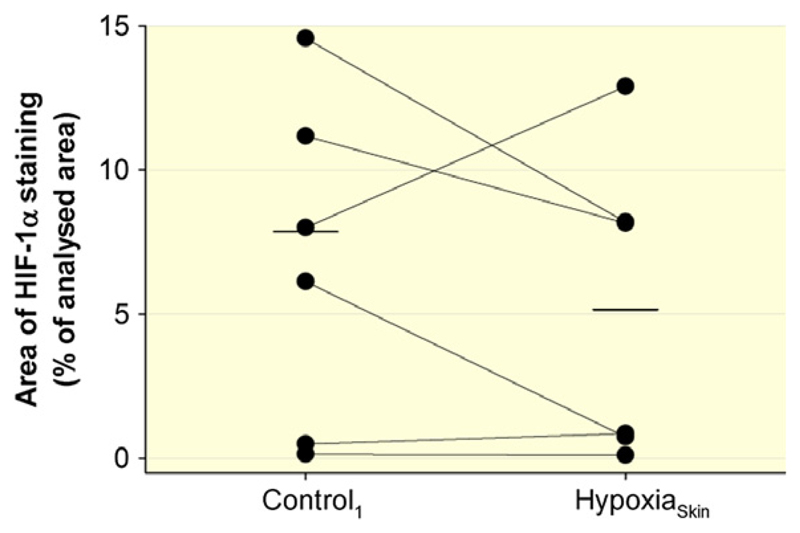
In two subjects, the biopsy obtained during HypoxiaSkin could not be analysed due to technical problems. Epidermal HIF-1α expression in the other six subjects is illustrated in Figure 3; no difference was observed between HypoxiaSkin and Control1 (P = 0.30).
Figure 3.
Effect of HypoxiaSkin on epidermal HIF-1α expression. HIF-1α expression was assessed by immunohistochemical staining in skin biopsies obtained from the dorsal forearm. The biopsies of two subjects could not be analysed for technical reasons, and the data points illustrate the individual results for the remaining six subjects. Short, horizontal lines represent the average values during Control1 and HypoxiaSkin respectively. No significant difference was observed between Control1 and HypoxiaSkin.
Circulating
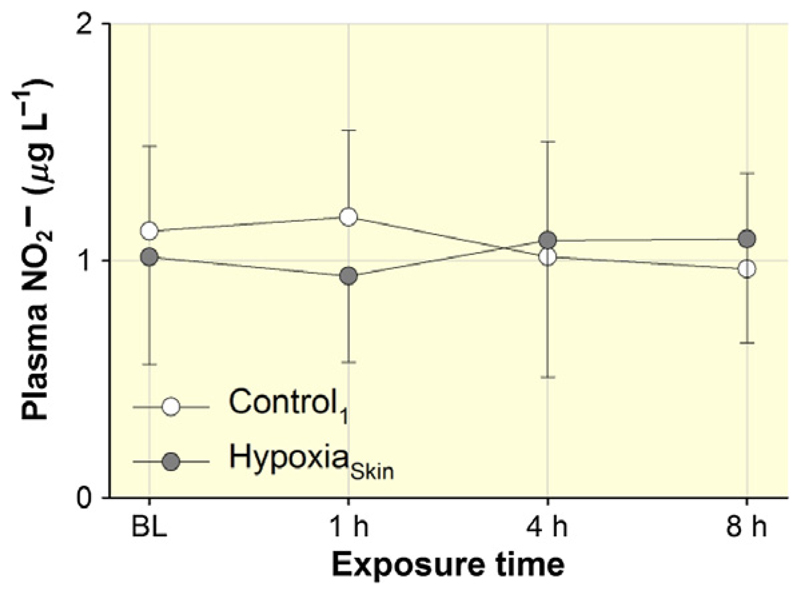
In one subject, venous concentration considerably exceeded the expected physiological range in both conditions, and these data were hence excluded from the figure and the statistics. As illustrated in Figure 4, venous concentration remained similar throughout HypoxiaSkin and Control1 (P = 0.34) in the remaining seven subjects.
Figure 4.
Effect of HypoxiaSkin on circulating was measured as a marker for NO before (baseline, BL), as well as after 1, 4 and 8 h of exposure. Data points represent means ± SD. No significant differences were observed between Control1 and HypoxiaSkin.
Systemic response
Markers of the systemic response to HypoxiaSkin and Control1 are presented in Table 1. For simplicity, we only present results obtained during baseline, as well as after 10 min, 1, 4 and 8 h of exposure. Systolic (P = 0.59) and diastolic (P = 0.62) arterial pressure, cardiac stroke volume (P = 0.69) and cardiac output (P = 0.34) remained similar throughout HypoxiaSkin and Control1. In contrast, HR was differently affected by HypoxiaSkin and Control1 (P < 0.009). The subsequent post hoc test could, however, not identify any significant differences between single measurement points.
Table 1. Systemic response to HypoxiaSkin.
| Baseline | 10 min | 1 h | 4 h | 8 h | ||
|---|---|---|---|---|---|---|
| Systolic arterial pressure (mmHg) | Control1 | 126 ± 15 | 126 ± 15 | 128 ± 11 | 133 ± 7 | 138 ± 7 |
| HypoxiaSkin | 121 ± 7 | 128 ± 12 | 123 ± 8 | 130 ± 12 | 131 ± 10 | |
| Diastolic arterial pressure (mmHg) | Control1 | 71 ± 11 | 71 ± 7 | 72 ± 6 | 71 ± 3 | 75 ± 6 |
| HypoxiaSkin | 70 ± 9 | 73 ± 9 | 69 ± 4 | 69 ± 7 | 71 ± 8 | |
| Heart rate (beats min–1)* | Control1 | 64 ± 8 | 59 ± 5 | 57 ± 4 | 57 ± 4 | 61 ± 4 |
| HypoxiaSkin | 60 ± 8 | 60 ± 8 | 58 ± 8 | 58 ± 7 | 63 ± 7 | |
| Stroke volume (mL) | Control1 | 113 ± 10 | 114 ± 14 | 115 ± 13 | 122 ± 16 | 111 ± 13 |
| HypoxiaSkin | 113 ± 14 | 110 ± 17 | 108 ± 17 | 119 ± 18 | 113 ± 17 | |
| Cardiac output (L min–1) | Control1 | 7.2 ± 1.1 | 6.6 ± 0.7 | 6.6 ± 1.0 | 6.9 ± 1.1 | 6.8 ± 0.9 |
| HypoxiaSkin | 6.7 ± 1.1 | 6.1 ± 1.3 | 6.2 ± 1.1 | 6.8 ± 0.9 | 7.1 ± 1.2 |
Measurements were obtained before (baseline), after 10 min and then after every hour of exposure. Results obtained after 2, 3, 5, 6 and 7 h are omitted for simplicity. Values are means ± SD.
P < 0.05 for comparison between the responses to Control1 and HypoxiaSkin. No significant differences between single measurement points were identified by post hoc testing.
Circulating VEGF and erythropoietin
Vascular endothelial growth factor and erythropoietin concentrations measured in venous blood are summarized in Table 2; both remained similar throughout exposure to HypoxiaSkin and Control1 (VEGF, P = 0.27 and erythropoietin, P = 0.76).
Table 2. Effect of HypoxiaSkin on circulating erythropoietin and vascular endothelial growth factor.
| Baseline | 1 h | 4 h | 8 h | ||
|---|---|---|---|---|---|
| Erythropoietin (U L−1) | Control1 | 10.9 ± 2.5 | 11.2 ± 2.5 | 11.3 ± 3.0 | 10.2 ± 3.3 |
| HypoxiaSkin | 12.7 ± 4.4 | 13.1 ± 4.4 | 13.1 ± 5.7 | 11.3 ± 4.7 | |
| VEGF (μmol L−1) | Control1 | 36.6 ± 13.8 | 45.6 ± 12.7 | 47.8 ± 18.8 | 43.4 ± 15.4 |
| HypoxiaSkin | 44.9 ± 14.9 | 41.4 ± 13.3 | 45.6 ± 11.9 | 41.0 ± 4.3 |
Erythropoietin and vascular endothelial growth factor (VEGF) concentrations were measured in venous blood that was obtained before (baseline) as well as after 1, 4 and 8 h of exposure. Values are means ± SD. No significant differences were observed between the responses to Control1 and HypoxiaSkin.
AnoxiaSkin experiment
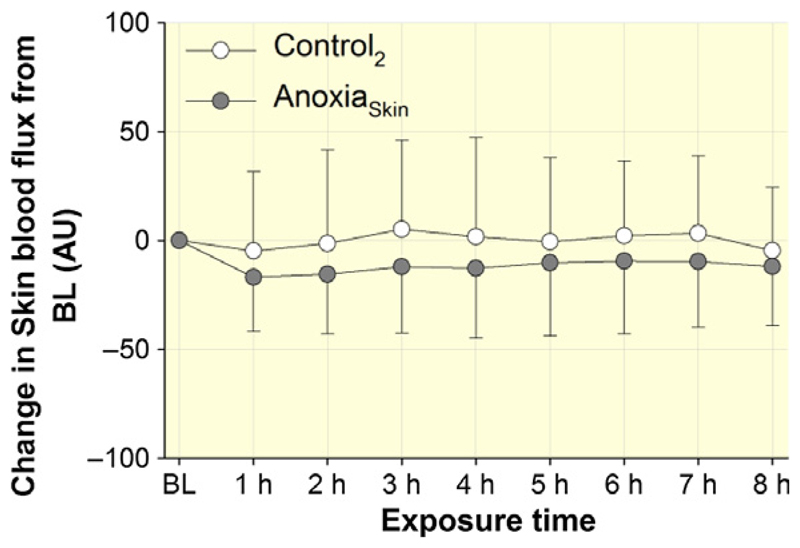
Figure 5 illustrates the changes from baseline for forearm skin blood flux throughout AnoxiaSkin and Control2. No significant difference between AnoxiaSkin and Control2 was detected (P = 0.81).
Figure 5.
Effect of AnoxiaSkin on skin blood flux. Skin blood flux was measured in arbitrary units (AU) before (baseline, BL) and then after every hour of exposure on the dorsal forearm. Results are presented as changes from the BL values. Data points represent means ± SD. No significant differences were observed between Control2 and AnoxiaSkin.
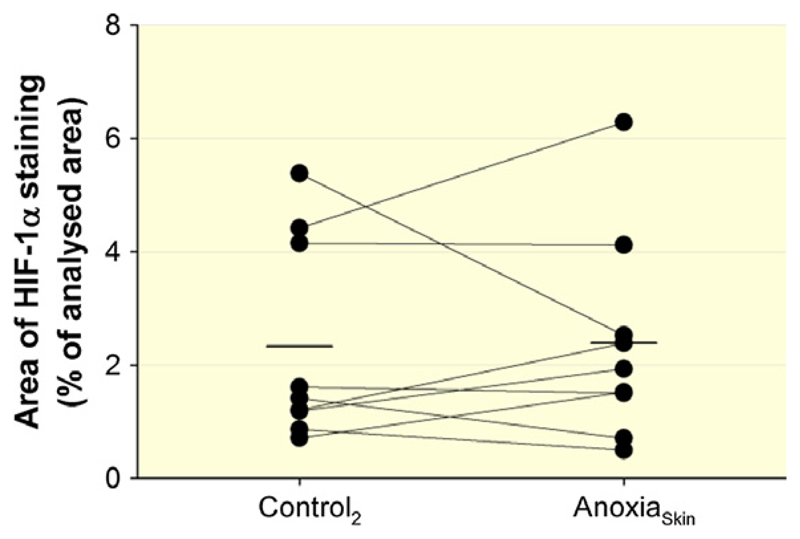
Figure 6 presents the individual responses of epidermal HIF-1α expression, where no differences were observed between AnoxiaSkin and Control2 (P = 0.90).
Figure 6.
Effect of AnoxiaSkin on epidermal HIF-1α expression. HIF-1α expression was assessed by immunohistochemical staining in skin biopsies obtained from the dorsal forearm. Data points illustrate individual results, and short, horizontal lines represent the average values during Control2 and AnoxiaSkin respectively. No significant difference was observed between Control2 and AnoxiaSkin.
Discussion
Our main findings are that neither a reduction in skin-surface PO2 nor the absence of O2 at the skin surface had an effect on skin blood flow, or on epidermal HIF-1α expression. Furthermore, HypoxiaSkin had no effect on NO metabolism.
Our hypotheses were based on a study exposing mice with epidermis-specific knockout of the HIF-1α gene to hypoxia (Boutin et al. 2008). Comparison to wild-type mice indicated that epidermal HIF-1α expression in hypoxia facilitates initial constriction and subsequent dilation of the cutaneous vasculature. Reducing the inspired PO2, while preserving the PO2 surrounding the body, subsequently revealed that epidermal HIF-1α expression and the resulting cutaneous vasomotor responses occur as a consequence of the low PO2 on the skin surface, rather than in the arterial blood. To test whether reductions in skin-surface PO2 exert a similar effect in humans, we first conducted the HypoxiaSkin experiment, which involved a reduction in skin-surface PO2 that may occur during normal human life. Exposure of the whole body surface to the reduced PO2 furthermore allowed investigating the systemic effects of a potential skin blood flow response. As we observed no effect of HypoxiaSkin, we conducted the AnoxiaSkin experiment, in which the stimulus was maximized by complete removal of O2 from the skin surface. Together, the results of the two experiments strongly contradict that the human cutaneous vasculature is responsive to reductions in skin-surface PO2. The unchanged epidermal HIF-1α expression furthermore implies that neither HypoxiaSkin nor AnoxiaSkin disturbed epidermal O2 homoeostasis. This is surprising, as PO2-driven transcutaneous O2 diffusion represents the principal O2 source for epidermal cells (Stucker et al. 2002). A potential explanation could be that arterial O2 delivery replaced transcutaneous O2 diffusion during HypoxiaSkin and AnoxiaSkin. To distinguish any potential effect of a reduced skin-surface PO2 on skin blood flow from the cutaneous vasodilatory response to systemic hypoxia, we reduced the PO2 on the skin surface while preserving arterial PO2. Accordingly, if transcutaneous O2 diffusion decreased or even ceased during HypoxiaSkin and AnoxiaSkin, the resulting reduction in epidermal PO2 enhanced the PO2 gradient from the capillary blood, which may have accelerated O2 diffusion from the blood into the epidermis. A balance between O2 diffusion into the epidermis from the blood and from the skin surface is supported by the observation that experimentally induced changes in arterial O2 delivery to the skin lead to opposing changes in transcutaneous O2 diffusion (Stucker et al. 2000). In this context, the thermoneutral environment in our study could have played a role as in a cold environment, thermoregulatory cutaneous vasoconstriction (Elstad et al. 2014) might have reduced arterial O2 delivery to the skin. In contrast to our study, the animals in the mouse study were breathing a hypoxic gas mixture when the PO2 on the skin surface was manipulated (Boutin et al. 2008). The low arterial PO2 may have prevented a compensatory increase in arterial O2 extraction when transcutaneous O2 diffusion decreased, leading to more pronounced disturbance of epidermal O2 homoeostasis.
Taken together, our results contradict the notion that a decrease in skin-surface PO2 independently affects skin blood flow in humans. Whether the combination of a reduced PO2 in the inspired air and on the skin surface stimulates epidermal HIF-1α expression remains to be determined, although the consequence on skin blood flow may be difficult to isolate from the cutaneous vascular response to systemic hypoxia in such a set-up.
The cutaneous vasomotor response to a reduction in skin-surface PO2 in mice was bipartite, consisting of vasoconstriction within the first 5 h and subsequent vasodilation (Boutin et al. 2008). While the mechanism underlying the vasoconstriction remains speculative, the vasodilation was linked to stimulation of NO synthase expression in skin cells (Cowburn et al. 2013). We did not detect an effect of HypoxiaSkin on circulating ; however, as epidermal HIF-1α remained unchanged, its proposed regulatory role regarding cutaneous NO metabolism is neither supported, nor challenged. Interestingly, epidermal HIF-1α-induced stimulation of NO synthase expression and the resulting cutaneous vasodilation in mice were associated with a reduction in arterial pressure (Boutin et al. 2008, Cowburn et al. 2013). If epidermal HIF-1α stimulates NO metabolism also in humans, a similar reduction in arterial pressure could be expected given the extensive vascularization of the human skin and the important role of NO in the regulation of cutaneous vascular tone (Clough 1999). A negative correlation between epidermal HIF-1α expression and arterial pressure was indeed observed in humans ranging from normo- to hypertensive (Cowburn et al. 2013). These augural findings are not expanded by the present results, again, as epidermal HIF-1α was unaffected by HypoxiaSkin. Nevertheless, given the possible implication for the pathophysiology of hypertension, the potential role of epidermal HIF-1α in arterial pressure regulation deserves further attention.
We acknowledge that during both HypoxiaSkin and AnoxiaSkin, the forearm skin blood flux tended to be slightly lower than in the respective Control trials. The small subject number hereby constitutes a study limitation as it provides us with insufficient statistical power to rule out a type II error. Still, even if the skin blood flux data from the two experiments are pooled, there is no significant difference between HypoxiaSkin/AnoxaSkin and Control1/Control2 (P = 0.16), and there was also no effect of HypoxiaSkin on the perfusion of the glabrous skin of the fingertip. Furthermore, none of the variables that were hypothesized to mediate the cutaneous vasomotor response to reductions in skin-surface PO2 were affected. Finally, no systemic consequences of HypoxiaSkin were observed, indicating that even if a slight cutaneous vasomotor response to reductions in skin-surface PO2 was overlooked, it would have been too minor to have notable physiological consequences.
There are further limitations to this study: first, as only male subjects were included, an effect of reductions in skin-surface PO2 cannot be ruled out in females. Second, due to the short half-life of NO in blood (Liu et al. 1998), we used as marker for circulating NO. Nevertheless, accurately reflects changes in NO synthase activity (Lauer et al. 2001), and our measurement method has both high accuracy and precision (Nagababu & Rifkind 2007). Third, we cannot exclude that HypoxiaSkin or AnoxiaSkin affected a variable that was not monitored. Indeed, preliminary findings suggest that anoxia on the skin surface of humans might affect cerebral blood flow regulation and autonomic control (Pucci et al. 2012), although this remains to be confirmed with more direct measurement methods.
In conclusion, the present study does not support that the skin perfusion of healthy men responds to changes in skin-surface PO2. As neither HypoxiaSkin nor AnoxiaSkin affected epidermal HIF-1α expression, a different experimental model will have to be used to investigate whether epidermal HIF-1α plays a role in the regulation of NO metabolism, skin perfusion and arterial pressure in humans.
Acknowledgments
The authors thank Björn Johannesson for technical support. This study was funded by the Gösta Fraenckel Foundation.
Footnotes
Conflict of interest
None of the authors has a conflict of interest to declare.
References
- Boutin AT, Weidemann A, Fu Z, Mesropian L, Gradin K, Jamora C, Wiesener M, Eckardt KU, Koch CJ, Ellies LG, et al. Epidermal sensing of oxygen is essential for systemic hypoxic response. Cell. 2008;133:223–234. doi: 10.1016/j.cell.2008.02.038. [DOI] [PMC free article] [PubMed] [Google Scholar]
- Clough GF. Role of nitric oxide in the regulation of microvascular perfusion in human skin in vivo. J Physiol. 1999;516(Pt 2):549–557. doi: 10.1111/j.1469-7793.1999.0549v.x. [DOI] [PMC free article] [PubMed] [Google Scholar]
- Cowburn AS, Takeda N, Boutin AT, Kim JW, Sterling JC, Nakasaki M, Southwood M, Goldrath AW, Jamora C, Nizet V, Chilvers ER, et al. HIF isoforms in the skin differentially regulate systemic arterial pressure. Proc Natl Acad Sci USA. 2013;110:17570–17575. doi: 10.1073/pnas.1306942110. [DOI] [PMC free article] [PubMed] [Google Scholar]
- Elstad M, Vanggaard L, Lossius AH, Walloe L, Bergersen TK. Responses in acral and non-acral skin vasomotion and temperature during lowering of ambient temperature. J Therm Biol. 2014;45:168–174. doi: 10.1016/j.jtherbio.2014.09.003. [DOI] [PubMed] [Google Scholar]
- Hamanaka RB, Weinberg SE, Reczek CR, Chandel NS. The mitochondrial respiratory chain is required for organismal adaptation to hypoxia. Cell Rep. 2016;15:451–459. doi: 10.1016/j.celrep.2016.03.044. [DOI] [PMC free article] [PubMed] [Google Scholar]
- Lauer T, Preik M, Rassaf T, Strauer BE, Deussen A, Feelisch M, Kelm M. Plasma nitrite rather than nitrate reflects regional endothelial nitric oxide synthase activity but lacks intrinsic vasodilator action. Proc Natl Acad Sci USA. 2001;98:12814–12819. doi: 10.1073/pnas.221381098. [DOI] [PMC free article] [PubMed] [Google Scholar]
- Leuenberger UA, Gray K, Herr MD. Adenosine contributes to hypoxia-induced forearm vasodilation in humans. J Appl Physiol (1985) 1999;87:2218–2224. doi: 10.1152/jappl.1999.87.6.2218. [DOI] [PubMed] [Google Scholar]
- Liu XP, Miller MJS, Joshi MS, Sadowska-Krowicka H, Clark DA, Lancaster JR. Diffusion-limited reaction of free nitric oxide with erythrocytes. J Biol Chem. 1998;273:18709–18713. doi: 10.1074/jbc.273.30.18709. [DOI] [PubMed] [Google Scholar]
- Minson CT. Hypoxic regulation of blood flow in humans – skin blood flow and temperature regulation. Adv Exp Med Biol. 2003;543:249–262. doi: 10.1007/978-1-4419-8997-0_18. [DOI] [PubMed] [Google Scholar]
- Nagababu E, Rifkind JM. Measurement of plasma nitrite by chemiluminescence without interference of S-, N-nitroso and nitrated species. Free Radic Biol Med. 2007;42:1146–1154. doi: 10.1016/j.freeradbiomed.2006.12.029. [DOI] [PMC free article] [PubMed] [Google Scholar]
- Obeid AN, Barnett NJ, Dougherty G, Ward G. A critical review of laser Doppler flowmetry. J Med Eng Technol. 1990;14:178–181. doi: 10.3109/03091909009009955. [DOI] [PubMed] [Google Scholar]
- Pucci O, Qualls C, Battisti-Charbonney A, Balaban DY, Fisher JA, Duffin J, Appenzeller O. Human skin hypoxia modulates cerebrovascular and autonomic functions. PLoS ONE. 2012;7:e47116. doi: 10.1371/journal.pone.0047116. [DOI] [PMC free article] [PubMed] [Google Scholar]
- Rasmussen P, Nordsborg N, Taudorf S, Sorensen H, Berg RM, Jacobs RA, Bailey DM, Olsen NV, Secher NH, Moller K, Lundby C. Brain and skin do not contribute to the systemic rise in erythropoietin during acute hypoxia in humans. FASEB J. 2012;26:1831–1834. doi: 10.1096/fj.11-191692. [DOI] [PubMed] [Google Scholar]
- Rizzardi AE, Johnson AT, Vogel RI, Pambuccian SE, Henriksen J, Skubitz APN, Metzger GJ, Schmechel SC. Quantitative comparison of immunohistochemical staining measured by digital image analysis versus pathologist visual scoring. Diagn Pathol. 2012;7:42. doi: 10.1186/1746-1596-7-42. [DOI] [PMC free article] [PubMed] [Google Scholar]
- Simmons GH, Minson CT, Cracowski JL, Halliwill JR. Systemic hypoxia causes cutaneous vasodilation in healthy humans. J Appl Physiol (1985) 2007;103:608–615. doi: 10.1152/japplphysiol.01443.2006. [DOI] [PubMed] [Google Scholar]
- Stucker M, Struk PA, Hoffmann K, Schulze L, Rochl-ing A, Lubbers DW. The transepidermal oxygen flux from the environment is in balance with the capillary oxygen supply. J Invest Dermatol. 2000;114:533–540. doi: 10.1046/j.1523-1747.2000.00911.x. [DOI] [PubMed] [Google Scholar]
- Stucker M, Struk A, Altmeyer P, Herde M, Baumgartl H, Lubbers DW. The cutaneous uptake of atmospheric oxygen contributes significantly to the oxygen supply of human dermis and epidermis. J Physiol. 2002;538:985–994. doi: 10.1113/jphysiol.2001.013067. [DOI] [PMC free article] [PubMed] [Google Scholar]
- Sundberg S. Acute effects and long-term variations in skin blood flow measured with laser Doppler flowmetry. Scand J Clin Lab Invest. 1984;44:341–345. doi: 10.3109/00365518409083817. [DOI] [PubMed] [Google Scholar]
- Weisbrod CJ, Minson CT, Joyner MJ, Halliwill JR. Effects of regional phentolamine on hypoxic vasodilatation in healthy humans. J Physiol. 2001;537:613–621. doi: 10.1111/j.1469-7793.2001.00613.x. [DOI] [PMC free article] [PubMed] [Google Scholar]
- Wesseling KH, Jansen JR, Settels JJ, Schreuder JJ. Computation of aortic flow from pressure in humans using a nonlinear, three-element model. J Appl Physiol (1985) 1993;74:2566–2573. doi: 10.1152/jappl.1993.74.5.2566. [DOI] [PubMed] [Google Scholar]


