Abstract
Synapses, highly specialized membrane junctions between neurons, connect presynaptic neurotransmitter release sites and postsynaptic ligand-gated channels. Neurexins (Nrxns), a family of the presynaptic adhesion molecules, have been characterized as major regulators of synapse development and function. Via their extracellular domains, Nrxns bind to different postsynaptic proteins, generating highly diverse functional readouts through their postsynaptic binding partners. Not surprisingly given these versatile protein interactions, mutations and deletions of Nrxn genes have been identified in patients with autism spectrum disorders, intellectual disabilities and schizophrenia. Therefore, elucidating the expression profiles of the Nrxns in the brain is of high significance. Here, using chromogenic and fluorescence in situ hybridization, we characterize the expression patterns of Nrxn isoforms throughout the brain. We found that each Nrxn isoform displays a unique expression profile in a region-, cell type- and sensory system-specific manner. Interestingly, we also found that αNrxn1 and αNrxn2 mRNAs are expressed in non-neuronal cells, including astrocytes and oligodendrocytes. Lastly, we found diverse expression patterns of genes that encode Nrxn binding proteins, such as Neuroligins (Nlgns), Leucine-rich repeat transmembrane neuronal protein (Lrrtms) and Latrophilins (Adgrls), suggesting that Nrxn proteins can mediate numerous combinations of trans-synaptic interactions. Together, our anatomical profiling of Nrxn gene expression reflects the diverse roles of Nrxn molecules.
Keywords: brain, in situ hybridization, mice, Neurexin, synapse, trans-synaptic adhesion, RRIDs: RRID SCR_003070, RRID AB_840257, RRID AB_514500
Graphical Abstract
INTRODUCTION
Neurexin (Nrxn) is a presynaptic cell adhesion molecule that was originally identified as an α-latrotoxin receptor (Ushkaryov et al., 1992). In mammals, three Nrxn genes (Nrxn1, Nrxn2, and Nrxn3) are transcribed as longer alpha (αNrxn1, αNrxn2, αNrxn3), shorter beta (βNrxn1, βNrxn2, βNrxn3), and Nrxn1-specific gamma (γNrxn1) isoforms from two different promoters (Tabuchi and Sudhof, 2002; Sterky et al., 2017). The longer isoforms, αNrxns, have six extracellular laminin/neurexin/sex-hormone-binding globulin (LNS) domains, three interspersed epidermal growth factor-like repeats, an O-linked sugar modification sequence, a cysteine loop, a transmembrane region, and a short intracellular carboxyl terminal. Shorter isoforms, βNrxns, contain a unique β isoform-specific domain with the sixth LNS and intracellular domain of αNrxns (Sudhof, 2017). Nrxn isoforms also have six alternative splicing sites, resulting in thousands of potential Nrxn variants (Puschel and Betz, 1995; Ullrich et al., 1995; Gorecki et al., 1999; Schreiner et al., 2014; Treutlein et al., 2014).
The diversity of the Nrxn isoforms are thought to encode synapse specification (Sudhof, 2017). In fact, they can bind to various postsynaptic binding partners at different extracellular sites in the presence or absence of splicing sites (Boucard et al., 2005; Reissner et al., 2008; Koehnke et al., 2010). Neuroligins (Nlgns) (Ichtchenko et al., 1995; Ichtchenko et al., 1996), LRRTMs (leucine rich repeat transmembrane neuronal protein) (de Wit et al., 2009; Ko et al., 2009), GABAA receptors (Zhang et al., 2010), cerebellins (Uemura et al., 2010), SPARCL1 (secreted protein acidic and rich in cysteines 1, also referred to as Hevin) (Singh et al., 2016), and latrophilins (Boucard et al., 2012) can bind to the sixth LNS domain shared with both αNrxns and βNrxns. Emerging evidence reveals that interactions of Nrxns with Nlgns play a key role in synaptogenesis and excitatory and inhibitory synaptic transmission (Graf et al., 2004; Boucard et al., 2005; Nam and Chen, 2005; Chih et al., 2006; Futai et al., 2007; Kang et al., 2008; Futai et al., 2013). Interestingly, a variety of molecules critical for synaptogenesis have been reported to bind to specific Nrxn isoforms. For example, neurexophilins (Missler et al., 1998) and dystroglycan (Sugita et al., 2001) bind to the second LNS domain specific to αNrxns. lgSF21 can promote presynaptic differentiation of inhibitory synapses through the first LNS domain of αNrxn2 (Tanabe et al., 2017). C1ql2/3 can interact with the fifth splicing site of α/βNrxn3, and recruit kainate receptors to synaptic sites (Matsuda et al., 2016). These findings suggest isoform-specific roles of Nrxns in synapse specification.
Mutations and deletions of Nrxn loci have been associated with neuropsychiatric and neurodevelopmental disorders. Copy number alterations (Sebat et al., 2007; Szatmari et al., 2007) and deleterious (Yan et al., 2008; Zahir et al., 2008) mutations in αNrxn1 are the most commonly reported Nrxn isoform-specific modifications predisposing people to autism spectrum disorder (ASD), attention deficit hyperactivity disorder (ADHD), intellectual disability, schizophrenia, and Tourette syndrome (Kim et al., 2008; Ching et al., 2010; Clarke et al., 2012). Increasing genetic evidence, including deletions in chromosome 2p16.3 where Nrxn1 is located, reveals an overlap between ASD and schizophrenia comorbidity and symptomatology (Vinas-Jornet et al., 2014; Autism Spectrum Disorders Working Group of The Psychiatric Genomics, 2017). Mutations in Nrxn3 have also been identified in rare ASD cases (Vaags et al., 2012; RK et al., 2017). Taken together, these findings suggest that Nrxn expression should prevail in brain regions that coordinate higher cognitive functions. However, brain region- and cell type-specific expression of Nrxns is poorly understood.
The three Nrxn genes are transcribed in the brain, but display differential expression patterns, with the abundance of αNrxns exceeding that of βNrxns (Ullrich et al., 1995). Some studies have revealed cell type-specific Nrxn expression and distinct expression of Nrxn mRNA splice variants in a given cell by single cell RT-PCR or RNA-Seq (Schreiner et al., 2014; Treutlein et al., 2014). Proteomic analysis highlights the specificity of Nrxn splice isoform expression in different brain regions (Schreiner et al., 2015). However, our knowledge of Nrxn expression in different brain regions and subregions is still limited. To fill this current knowledge gap, we conducted brain-wide mapping of α and β isoforms of Nrxn1, Nrxn2, and Nrxn3 by in situ hybridization, and report region- and cell type-dependent expression of Nrxn isoforms in the mouse brain.
MATERIALS AND METHODS
Animals and section preparations
All animal protocols were approved by the Institutional Animal Care and Use Committee (IACUC) at the University of Massachusetts Medical School. C57BL6 male mice at postnatal day 28 were used, which represents the age when the expression levels of major synaptic proteins has stabilized (Gonzalez-Lozano et al., 2016). For chromogenic in situ hybridization, mice were transcardially perfused with 4% paraformaldehyde/0.1M phosphate buffer (PB, pH 7.2) under isoflurane anesthesia and postfixed for 3 days with the same fixatives. For double fluorescent in situ hybridization (FISH), brains were freshly obtained under isoflurane anesthesia and immediately frozen with powdered dry ice. Sections (20 μm) were prepared on a cryostat (CM3050S; Leica Microsystems). Fresh frozen sections were further mounted on silane-coated slides.
Plasmids
Total RNA was extracted from hippocampal primary cultures (days in vitro 14) using RNAqueous Micro Kits (Ambion) and reverse-transcribed using Superscript III kits (Invitrogen). Nrxn, tyrosine hydroxylase (Th). P2Y purinoceptor 12 (P2ry12), Nlgn, Lrrtm, and Adgrl fragments listed in Table 1 were PCR amplified and sub-cloned into the pBluescript-SK(−) vector (Stratagene). We obtained the Nlgn3 probe from Dr. Tanaka (Tanaka et al., 2010). All Nrxn probes were designed for the coding regions and/or 5’-untranslated regions (5’-UTRs) to detect all splice variants for each Nrxn isoform.
Table 1.
List of cRNA probes used in the present study.
| Molecule | Sequence | Accession # (Genebank or NCBI) | Dilution | Hybridization Temperature (°C) | Reference |
|---|---|---|---|---|---|
| αNrxn 1#1 | 186–631 | NM_020252.3 | 1:1,000 | 63.5 | this study |
| AAGGGGAATAACCAGGCAGATTTCTGAGTTCTTATAAACGTCAAAATAAAATCAAAATGCATCACCAACATACAACCAACTGACATGCTGGAGTCTTAGGGTG GCCTTGCAGAGACAGAAAAAAGAAGAGTTTGAGGGATTGATTTCACCATCTAACAGCTTCTGGCTACTTCACAGCAGGGTTTGAGACCTACCTACAGGGCTC CTAAACATAAAGCGAATCAGCCTGGGAGGGCATGCACAGGAAATTTGGCCTTGGCTTTAGTGGTGCTGGAAGCCCATGATATGACAGAAGTAGGCCTCTGA AGCTATTCTGGTGTCTCACTCTGTCCTTTCTCCTTCTGTGCTTGGAGCCAACATCTGGAGGGGCCTCGAGGCCTGCCAAGCAGCCAAAGATCCTGGCTCAGT GTTGACTTCGTGTTCCTCTCCGAGAAAAGTGTGTTTCT |
|||||
| αNrxn1#2 | 631–1132 | NM 020252.3 | 1:10,000 | 63.5 | this study |
| TTCCGATTCTGCTCTCCTACTGCTGGCACCGCGCCGGTGGTACTTTGAAGGTTTTGGTCCTGGGATAGTTGAAGTACCTGTTGGTGCCACAGATGCCCTCAC TTAAACATCATCGGATGCAAATGGATCAGTGATCGCTCTTGAGCCTCGGTGGCCCTCTTTTTCAGAACGTTGCCTCCAAAGTGTATCCCCCCTTTGGCCTGG AAGTTCTGCAGCTATCCCATAGGACTGGGGTCTCCGCTTTCCAGTTGGAAGGAGACTACTGGGAGAGAGGAAGGGGCTGCTGGAAGAGAAGAAGAAGGAA AAAAGAGCTGAAGGAGGGTGCGCCCCTCCCACTGCCGCCTCCCCCCTCCCTCCCACTCCTCTGCGGACCCCCATTTCTCTGTGAAGGTGTCCAGGACCGC TTCGACCCTGTCGCCCCCGGCTCCCCCCCGCCGCACCCCAGCCCCGAGCATGGGGACGGCGCTGGTCCAGCGCGGGGGCTGCTGTCTCCTCTGCCTGT |
|||||
| βNrxn1#1 | 379–824 | XM 006523818.2 | 1:10,000 | 75 | this study |
| GCTCTTTCATCTGCCCCTGCTTTTCCTCCGCTCGCTTTCCCCAGTTCGATCCCTGCTGTCTTCACGAGGGTGCCCACTTCCCTCTGAACCCATCGTCGGGCG TAGTGTCAGGAGGCGGCGGACTCGGAGATTGCCTCTGGAGCAGGCGATGCGCGCCGCTGCTCTGCGCGCTGCCCGGGTGAGGCTGGCGGGAGCTGGAG AGCTGGCCAGGGCTGAATGGAGGGACAGGGTGCCTTGCGTCCATGGGGTCTGCTTCTTTCCTGAAAGGAGGCTGGACCGGCGAAGTGGTCTCCCAGTTCC CCGCGCACAATGCTAAATGGATTTACCTAGTGGATTCCCGGTGGATGGCTGTCATGTAGAAGTGAAGACCCTCCGGGAGGAGCTTTAAACAATTTCCAGGCT CCCCAACCCCGGCACACACTCTCGCCCGAAACTCTTGGGGAGTA |
|||||
| βNrxn1#2 | 882–1490 | XM 006523818.2 | 1:10,000 | 75 | this study |
| TGTTCTTCGGGTCTGCTTTTCCGGACAAGTCCTCCGGCCAGCTACATTCACCTCGGCTATGTTTCGGATTGTTTGGGGTACTGTTGTAGGGCACTGCAGACT CCAGGACCCTGAGAAGACTGTCCGAAGGAGGGAGAGGATGGCTGCCCTGGCGCGGTAAGGCGGCCAATCCAGCAGCCAACCGCGAGCCGCCCGATCCC CGGCTTCCTCTTCTCTTCTTGTGCCCCAAACTTTGCCTCCCGCGGCGGCTGCCCCTTGGCGGGCGCCCCGCCATGTACCAGAGGATGCTTCGGTGCGGCG CCGATCTGGGATCGCCCGGGGGCGGCAGTGGCGGCGGCGCAGGGGGGCGCCTGGCCCTGATCTGGATAGTCCCGCTCACCCTCAGCGGCCTCCTAGGA GTGGCCTGGGGGGCATCCAGTTTGGGAGCGCACCACATCCACCATTTCCATGGCAGCAGCAAGCATCATTCAGTGCCTATTGCAATCTACAGGTCACCAGC ATCCTTGCGAGGCGGACACGCTGGGACAACATATATCTTTAGCAAAGGTGGTGGACAGATTACATATAAGTGGCCTCCCAATGACCGCCCCAGTACACGAG CAGACAGGC |
|||||
| αNrxn2#1 | 120–370 | NM 001205234 | 1:1,000 | 63.5 | this study |
| GACCAGGAGGCGCGAGGCAGCCGATATCGCTGGCCCAGGATCTGTTACCTGCCGTAGACCCAGCGGTCTCTAGGCTCGGATCCCTACCCTTCAGCTCCTG GCGCCCCCAAAACCAGGCGTCCCTCCCCCACCTTCCATACGAGCCCGCCGCGGGGGAGGGGCTCCACCACCGCAGCCGCCGTCGTTGCCTTCCGGGGAC GTGGACACGTGAGCCCCGGCTACTGAGTCCATGGCACTGTGAATCGGCGAGG |
|||||
| αNrxn2#2 | 894–1209 | NM_001205234 | 1:1,000 | 63.5 | this study |
| TCAAAGCGGCGCGAGATGCAGGTGGCCAGCGACCTGTTCGTGGGCGGCATCCCTCCCGACGTGCGCCTATCTGCACTCACGCTCAGCACCGTCAAGTACG AGCCGCCTTTCCGCGGCCTTCTGGCCAACCTGAAGCTGGGCGAGCGGCCGCCGGCGCTGCTGGGTAGCCAGGGTCTGCGCGGTGCGGCCGCCGACCCT CTGTGTGCGCCTGCGCGCAATCCCTGCGCCAACGGCGGTCTCTGCACCGTGCTAGCCCCCGGCGAGGTGGGCTGCGACTGCAGCCACACTGGATTTGGC GGCAAGTTCTGCAGTGAAG |
|||||
| βNrxn2#1 | 188–375 | AK163904.1 | 1:1,000 | 63.5 | this study |
| TGAGGGGGGACCCCTAGCCGCCCGCGATGGATCCAGGCTTCACGGACCTTGGCCTTCCCGCTGCGCGTACCCCGGATTCCCCGGCGGGATCCAGTTGAT TTGCTTGGCTCCGGACTGAGGCTCGGGCTCTGGTTTTCCTTCGCTTCACCCCTACCCCCCTCTCGGAGCTCGCAACCGGAGGGGGGCTT |
|||||
| βNrxn2#2 | 543–714 | AK163904.1 | 1:1,000 | 63.5 | this study |
| TTCTGCTGGGGCTGCTGCTGCTGCTGGGGGCGGCTGAGGGGGCCCGGGTCTCGTCCAGCCTCAGCACCACCCACCACGTCCACCACTTCCACAGCAAGC ACGGCACCGTGCCCATCGCCATCAACCGCATGCCCTTCCTCACCCGCAGCGGGCACGCTGGGACCACATACAT |
|||||
| αNrxn3#1 | 207–795 | NM 001198587 | 1:1,000 | 63.5 | this study |
| CCTCCCGATTACTCCTCCTCCATTACAGCACCCTGAGCCCCAGCCCTGTCCTTGGTCTTCCTGGCTAGGACGCATTTGCCGGGAGGAAGACATTACGGAAG GCTTATTCCCACCCTGGGCTCCTTCTCCTCCTTGAATCAAGGCCTCCGGATCCACATGGATAGCTGAGATCTTTTCTTGGAGAAAGATACTTCTTCCTCGCCT CATCCCTGATTTGCCTCACCCGACAAATCCCCTGTCTGTTTCGTCTCCCTCTTTATGGGATTTCTTGCTTGTGTGCCTATCTAGGGCCGTGTTGTCCTTTTTCC TCTCCTTCCCCTTTCCTCCTAACATTCCTGTGTGTGTTCTTCTTGTGTCTTCTCTTGTACCACTCTGTTTTCCCTCTTTGCCCTCACAATCACCTATCCCCTGCC TCCCGCTCCCACGGCTGATACCTGGCCTACCTGCTCCTCTGTGCTCTGACCCAGCAGGCACCATGAGCTTTACCCTCCACTCAGTTTTCTTCACCTTGAAGG TGAGCATCTTTCTGGGCTCCCTGGTGGGGCTTTGCCTGGGTCTGGAGTTCATGGGCCTTCCTAACCAGTGGGCC |
|||||
| αNrxn3#2 | 796–1782 | NM 001198587 | 1:1,000 | 63.5 | this study |
| CGCTACCTGCGTTGGGATGCAAGCACGCGCAGTGACCTGAGCTTCCAGTTCAAGACCAATGTTTCCACTGGGCTGCTCCTGTATTTGGATGATGGTGGTGT CTGTGACTTCCTCTGTCTCTCCCTGGTGGATGGCCGCGTTCAGCTCCGCTTTAGCATGGACTGTGCCGAGACCACTGTGCTATCCAACAAGCAGGTGAACG ACAGCAGTTGGCACTTCCTCATGGTGAGCCGTGATCGTGTGCGCACTGGGCTGGTGATTGATGGTGAGGGCCAGTCTGGAGAGCTACGGCCCCAGCGGCC TTATATGGATGTGGTCAGTGATTTGTTCCTCGGTGGCGTCCCCGCTGACATTCGACCTTCTGCCCTGACCCTCGATGGAGTACAGAGCATGCCTGGCTTTAA GGGATTAATGCTGGATCTCAAGTATGGCAACTCGGAACCTCGGCTTCTGGGGAGCCAGAGCGTCCAGTTAGAAGCAGAGGGACCCTGTGGCGAGCGTCCC TGTGAAAATGGTGGGATCTGCTTCCTCTTGGATGGTCATCCCACCTGTGACTGTTCTACCACTGGCTATGGTGGCACACTCTGCTCAGAAGATGTCAGTCAA GGTCCAGGCCTCTCCCATCTTATGATGAGTGAACAAGCACGAGAGGAGAACGTGGCCACCTTCCGAGGCTCAGAGTATCTGTGCTATGACCTGTCCCAGAA CCCCATCCAGAGCAGCAGCGACGAAATCACCCTTTCCTTTAAGACCTGGCAACGCAATGGGCTCATCCTCCACACTGGCAAGTCGGCCGACTATGTTAACCT GGCTCTGAAGGATGGTGCGGTCTCCTTGGTCATTAACCTGGGGTCCGGGGCCTTTGAGGCCATTGTGGAGCCAGTGAATGGGAAATTCAACGACAACGCCT GGCATGATGTCAAAGTGACACGCAATCTTCGGCAGGTGACAATCTCTGTGGATGGCATCCTAACCACAACGGGCTAC |
|||||
| βNrxn3#1 | 85–530 | NM 001252074 | 1:1,000 | 63.5 | this study |
| CTGCTCCTCTCCACCTTCTGCTACGTTGGTCTGGGTGGCTAGCTCAGTGCTGTTTCTTTTCCTCTGGCCCTTCTTGATCCCTTTCTCTGGCTACTGCTGCTGG CTGATTTTCAACCTATTGGGAACTCAGGACTTAAGGCGGCTGCACCGTGGCGCTCATCCAGGACACTCAGGGTTAACAGCCTCCGCGCCCATCCACAGAGA CTCCCGGGAGCAGAACTCTTCCACCTGCAGCCCCCTTTTGCCTGGCAGTTCTGCATTGCATCGCTTGGAAGTCGAAACAAGAAAGAAAGAAAGAAAGAAAAA TGTCCAAACTCCTTGGATGTTGGGAAAAACTAGCGTGAATTTACTTGGTTTTTTCCTGCTCTGTCTTCTCTCTCCGTTTCCACCTTTCCCCAGTGGCTTTCCAG AGTATGCAGCTAGTACATCGGACTTGAAGTACCAAG |
|||||
| βNrxn3#2 | 771–1235 | NM 001252074 | 1:1,000 | 63.5 | this study |
| TTCCCCGAAAGCTTTTATTGCTTCCCTCATCCCCAAATTGAACAACTCTTCCTCCTGCTATGATGGGCCTCTGGGCATCATGAACTTCGTTATTGCTCACTGG CTGGAATTTAAACTGCCCATCTGTAGTGGTCCAGTGCGTTGACCATGCACCTGAGAATCCACCCAAGACGGAGCCCTCCTCGCCGGCCGGCCTGGACGCTT GGGATCTGGTCCCTCTTCTGGGGATGTATCGTCAGCTCTGTGTGGAGTTCTTCTAATGTAGCCTCCTCCTCCTCTTCCTCTCCGGGATCTCACTCTCAGCAG GAACACCATTTCCACGGCAGCAAGCACCACTCTGTGCCTATTTCTATCTATCGCTCCCCTGTTTCCCTTCGAGGAGGGCACGCTGGTGCAACATACATCTTT GGGAAAAGCGGTGGCCTCATCCTCTATACCTGGCCAGCAAATGACAGACCCAGCACA |
|||||
| Vglut1 | 301–1680 | BC054462 | 1:1,000 | 63.5 | (Yamasaki et al., 2010) (Mao et al., 2018) |
| ACATGGCTCCTTTTTCTGGGGCTACATTGTCACTCAGATTCCTGGAGGATTTATCTGCCAAAAATTCGCAGCCAACAGGGTCTTTGGCTTTGCCATTGTGGCT ACCTCCACCCTAAACATGTTGATCCCTTCAGCAGCCCGCGTTCACTATGGCTGTGTCATCTTCGTGAGGATCCTTCAGGGATTGGTGGAGGGGGTCACATAC CCTGCTTGCCATGGCATCTGGAGCAAATGGGCCCCTCCCTTAGAACGGAGTCGGCTGGCAACGACAGCCTTTTGCGGTTCCTATGCTGGGGCGGTGGTTG CCATGCCCTTGGCTGGGGTCCTTGTGCAGTATTCAGGATGGAGTTCTGTCTTCTATGTCTATGGCAGCTTCGGGATCTTTTGGTACCTGTTCTGGTTGCTTGT CTCCTATGAGTCACCGGCACTGCACCCCAGCATCTCTGAGGAGGAGCGCAAATACATTGAGGATGCCATCGGGGAGAGCGCCAAGCTCATGAACCCTGTTA CGAAGTTTAACACACCCTGGAGGCGCTTCTTTACGTCCATGCCCGTCTATGCCATCATCGTTGCGAACTTTTGCCGCAGCTGGACCTTCTACCTGCTCCTCA TCTCTCAGCCCGCCTACTTTGAAGAAGTGTTCGGCTTTGAGATCAGCAAGGTGGGGCTGGTGTCGGCGCTGCCTCACCTTGTCATGACCATCATCGTACCC ATTGGAGGCCAGATCGCTGACTTTTTGCGCAGTCGTCACATAATGTCCACTACCAACGTGCGAAAGCTCATGAACTGCGGGGGTTTCGGGATGGAAGCCAC GCTGCTGCTGGTGGTCGGATACTCGCACTCCAAGGGCGTGGCCATCTCCTTCCTGGTCCTGGCTGTGGGCTTCAGTGGCTTTGCCATCTCTGGGTTTAACG TGAACCACTTGGACATCGCCCCTCGCTATGCCAGCATCTTGATGGGCATTTCCAATGGCGTGGGCACACTGTCTGGGATGGTGTGCCCCATCATCGTGGGT GCAATGACCAAGCACAAGACGCGGGAGGAGTGGCAGTACGTGTTCCTCATAGCCTCCCTGGTGCACTACGGCGGTGTCATCTTCTATGGGGTCTTTGCTTC GGGAGAGAAGCAGCCGTGGGCAGAGCCGGAGGAGATGAGCGAGGAGAAGTGTGGCTTTGTTGGCCACGACCAGCTGGCTGGCAGTGACGAAAGTGAAAT GGAGGACGAGGCTGAGCCCCCAGGGGCGCCCCCCGCGCCGCCTCCGTCCTACGGGGCCACACACAGCACAGTGCAGCCTCCGAGGCCCCCGCCCCCTG TCCGGGACTACTGACCACGGGCCTCCCACTGTGGGGCAGTTTCCAGGACTTCCACTCCATACACCTC |
|||||
| Gad1 | 1036–2015 | NM_008077 | 1:1,000 | 63.5 | (Yamasaki et al., 2010) (Mao et al., 2018) |
| GTACAGCATCATGGCTGCTCGTTACAAGTACTTCCCAGAAGTGAAGACAAAAGGCATGGCGGCTGTGCCCAAACTGGTCCTCTTCACCTCAGAACACAGTCA CTATTCCATAAAGAAAGCCGGGGCTGCGCTTGGCTTTGGAACCGACAATGTGATTTTGATAAAGTGCAATGAAAGGGGGAAGATAATTCCGGCTGATTTAGA GGCAAAAATTCTTGATGCCAAACAAAAGGGCTATGTTCCCCTTTATGTCAATGCAACCGCAGGCACGACTGTTTACGGAGCATTCGATCCAATCCAGGAAATT GCGGACATATGTGAGAAATACAACCTTTGGCTGCATGTGGATGCTGCCTGGGGTGGTGGACTGCTCATGTCCCGGAAGCACCGCCACAAACTCAGCGGCAT AGAAAGGGCCAATTCAGTCACCTGGAACCCTCACAAGATGATGGGCGTGCTGCTCCAGTGCTCTGCCATTCTGGTCAAGGAAAAGGGTATACTCCAAGGAT GCAACCAGATGTGTGCAGGCTACCTCTTCCAGCCAGACAAGCAGTATGACGTCTCCTATGACACCGGGGACAAGGCGATTCAGTGTGGCCGCCATGTGGAC ATCTTCAAGTTCTGGCTGATGTGGAAAGCAAAGGGCACCGTGGGATTTGAAAACCAGATCAACAAATGCCTGGAGCTGGCTGATTACCTCTACGCCAAGATT AAAAACAGAGAAGAGTTTGAGATGGTTTTCGATGGTGAGCCTGAGCACACAAATGTCTGTTTCTGGTACATTCCACAAAGCCTTCGAGGGGTTCCAGATAGC CCTGAGCGACGAGAAAAGCTACACAGGGTGGCTCCCAAGATCAAAGCTCTGATGATGGAGTCAGGAACAACCATGGTGGGCTACCAGCCTCAAGGGGACA AGGCCAACTTCTTCCGGATGGTCATCTCTAACCCAGCCGCCACCCAGTCTGACATCGATTTCCTCA |
|||||
| Th | 1–1025 | AY855842 | 1:1,000 | 63.5 | this study |
| ATGCCCACCCCCAGCGCCTCCTCGCCACAGCCCAAGGGCTTCAGAAGAGCCGTCTCAGAGCAGGATACCAAGCAGGCCGAGGCTGTCACGTCCCCAAGGT TCATTGGACGGCGGCAGAGTCTCATCGAGGATGCCCGCAAGGAGCGGGAGGCAGCAGCAGCTGCAGCAGCAGCAGCGGTAGCCTCCTCGGAACCTGGGA ACCCACTGGAGGTTGTGGTATTTGAGGAGAGGGATGGGAATGCTGTTCTCAACCTGCTCTTCTCCCTGAGGGGTACAAAACCCTCCTCCTTGTCTCGGGCT GTAAAAGTATTTGAGACATTTGAAGCCAAAATTCACCACTTAGAGACCCGGCCTGCCCAGAGGCCACTGGCAGGAAGCCCCCACCTGGAGTATTTTGTGCG CTTCGAGGTGCCCAGTGGAGACCTGGCTGCCCTCCTCAGCTCTGTGCGTCGGGTGTCTGACGACGTGCGCAGTGCCAGAGAGGACAAGGTCCCCTGGTTC CCAAGAAAAGTGTCGGAATTGGACAAGTGTCACCACCTGGTCACCAAGTTTGACCCTGATCTGGACCTGGACCACCCGGGCTTCTCTGACCAGGTGTATCG CCAGCGTCGGAAGCTGATTGCAGAGATTGCCTTCCAGTACAAGCACGGTGAACCAATTCCCCATGTGGACTACACAGCGGAAGAGATTGCTACCTGGAAGG AGGTATATGCCACGCTGAAGGGCCTCTATGCTACCCATGCCTGCCGGGAGCACGTGGAGGGTTTCCAGCTTCTGGAACGGTACTGTGGCTACCGAGAGGA CAGCATCCCACAGCTGGAGGACGTGTCCCGCTTCTTGAAGGAGCGGACTGGCTTCCAGCTGCGACCCGTGGCCGGTCTACTGTCCGCCCGTGATTTTCTG GCCAGTCTGGCCTTCCGCGTGTTTCAATGCACCCAGTATATCCGCCATGCCTCCTCACCTATGCATTCACCTGAGCCGGACTGCTGCCATGAGCTGTTGGG ACATGTACCCATGTTGGCTGA |
|||||
| Glast | 1571–2473 | AF330257 | 1:1,000 | 63.5 | (Yamasaki et al., 2010) (Mao et al., 2018) |
| TGAAGAACCGAGATGTTGAAATGGGGAACTCGGTGATTGAGGAGAACGAAATGAAGAAGCCGTATCAGCTGATTGCCCAGGACAATGAACCGGAGAAACCC GTGGCAGACAGCGAAACCAAGATGTAGACGGACAGAGAAGTGCTTTCTTAAGCACCAAGTGTTGGAAACTGTTCTACAATGTATCCATCTCCCTGGGCTCAC TTTCCCAGTGAGCTCCTCTTTCCTCCCTACTCTGATAGGATTGGAAAACGGCCAAACACAAAGGAGGGCTCTGCAGCAGCCCAAACCTATCGGTTTTAGCCT ACATTTGAAAATTTTAAGTCATTTCATATTATTCTTACCAAGTAAGCTACTACAATCAAACACAGTTTCGATATTACCAATTTAGGTGGCAAACGATCCTGTGCC ATTGCTCTGTAAGTAAAAGAATTAAGCAAATGATAGGCTACCGAAAAAAAAAGTTTTAAAATCAACTTTCAAGATGTAAAAATCCTTCAGAATGCAACTGAGTTT TAATCTTAAAACATTACAACTTGATGAGCAATTATCAGTTACCCATTGAGTAGCTGAGAGGTTCCCATTTCTTCTGACTCCTGCCCTGACTTTGTCAGCATCAG GGCAATCCCCACATGCACACAGCACAGCTGTGAGGAGGAGCGGAGAGTGAGGCTCCCAAATGGTCTAGAGTGAGCCTTGTCTCATCCATTGGCCTCAGTGT TCTCATCCGGAAAATGAGTGACTCCTAGACAGGCCTCTCTAGCCCAAACTTCTGGAACATCAGGAAGGACCCTGCCCCTGTACACCATGAGGATCTCAGACA GGACACTTATTGGGAATGGACATTTCTCTCTAGGGGCAGGCTGTGTGTGGCTCACTAGATCCTGGGTTCAAAATGTTCGTT |
|||||
| Plp | 1–1359 | NM_011123 | 1:1,000 | 63.5 | (Yamasaki et al., 2001) |
| CTTTTCATTGCAGGAGAAGAGGACAAAGATACTCAGAGAGAAAAAGTAAAGGACAGAAGAAGGAGACTGGAGAGACCAGGATCCTTCCAGCTGAGCAAAGT CAGCCGCAAAACAGACTAGCCAACAGGCTACAATTGGAGTCAGAGTGCCAAAGACATGGGCTTGTTAGAGTGTTGTGCTAGATGTCTGGTAGGGGCCCCCT TTGCTTCCCTGGTGGCCACTGGATTGTGTTTCTTTGGAGTGGCACTGTTCTGTGGATGTGGACATGAAGCTCTCACTGGTACAGAAAAGCTAATTGAGACCT ATTTCTCCAAAAACTACCAGGACTATGAGTATCTCATTAATGTGATTCATGCTTTCCAGTATGTCATCTATGGAACTGCCTCTTTCTTCTTCCTTTATGGGGCCC TCCTGCTGGCTGAGGGCTTCTACACCACCGGCGCTGTCAGGCAGATCTTTGGCGACTACAAGACCACCATCTGCGGCAAGGGCCTGAGCGCAACGGTAAC AGGGGGCCAGAAGGGGAGGGGTTCCAGAGGCCAACATCAAGCTCATTCTTTGGAGCGGGTGTGTCATTGTTTGGGAAAATGGCTAGGACATCCCGACAAG TTTGTGGGCATCACCTATGCCCTGACTGTTGTATGGCTCCTGGTGTTTGCCTGCTCGGCTGTACCTGTGTACATTTACTTCAATACCTGGACCACCTGTCAGT CTATTGCCTTCCCTAGCAAGACCTCTGCCAGTATAGGCAGTCTCTGCGCTGATGCCAGAATGTATGGTGTTCTCCCATGGAATGCTTTCCCTGGCAAGGTTT GTGGCTCCAACCTTCTGTCCATCTGCAAAACAGCTGAGTTCCAAATGACCTTCCACCTGTTTATTGCTGCGTTTGTGGGTGCTGCGGCCACACTAGTTTCCCT GCTCACCTTCATGATTGCTGCCACTTACAACTTCGCCGTCCTTAAACTCATGGGCCGAGGCACCAAGTTCTGAGCTCCCATAGAAACTCCCCTTTGTCTAATA GCAAGGCTCTAACCACACAGCCTACAGTGTTGTGTTTTAACTCTGCCTTTGCCACTGATTGGCCCTCTTCTTACTTGATGAGTATAACAAGAAAGGAGAGTCT TGCAGTGATTAATCTCTCTCTGTGGACTCTCCCTCTTAGTACCTCTTTTAGTCATTTTGCTCCACAGCAGGCTCCTGCTAGAAATGGGGGATGCCTGAGAAGG TGACTCCCCAGCTGCAAGTCGCAGAGGAGTGAAAGCTCTAATTGATTTTGCAAGCATCTCCTGAAGACCAGGATGTGCTTCCTTCTCAAAGGGCACTTCCAA CTGAGGAGAGCAGAACGGAAAGGTTCTCAGG |
|||||
| P2ry12 | 347–846 | NM_027571 | 1:1,000 | 63.5 | this study |
| ACTCAAGGCTGCCTTGCTGAAGTCTCTGCAGAGTCTCTATCACAGAGGGCTTTGGGAACTTATGCAAGTCACTGAGAAGAAAGCAACAGATGCCAGTCTGCA AGTTCCACTAACTAGTATTCCCGGAGACACTCATATCCTTCAGATTCAGCAGAACCAGGACCATGGATGTGCCTGGTGTCAACACCACCTCAGCCAATACCA CCTTCTCCCCTGGGACCAGCACCCTGTGCGTCAGAGACTACAAGATCACCCAGGTTCTCTTCCCATTGCTGTACACCGTCCTGTTCTTTGCTGGGCTCATCA CGAACAGCTTGGCAATGAGGATTTTCTTTCAGATCCGCAGTAAATCCAACTTCATCATTTTTCTTAAGAACACGGTCATCTCTGATCTACTAATGATTCTAACTT TTCCATTTAAAATTCTTAGTGATGCTAAACTGGGAGCCGGGCCTCTGAGAACCTTGGTGTGCCAAGTTACTTCAGTCACATTTTATTTT |
|||||
| Nlgn1 | 3098-3790 | NM_138666 | 1:1,000 | 63.5 | this study |
| CCAGAAAGACCAGCTTTATCTCCATATTGGATTAAAACCGAGAGTTAAAGAGCATTACAGAGCCAATAAGGTAAATCTCTGGCTGGAGCTGGTACCTCATCTG CATAATCTCAATGACATTTCTCAGTATACCTCGACAACAACTAAAGTGCCATCCACGGACATCACTCTCAGACCTACAAGGAAGAATTCCACACCAGTCACAT CAGCCTTTCCCACTGCCAAACAGGATGATCCCAAGCAACAACCAAGCCCCTTCTCGGTGGATCAGAGGGACTACTCCACAGAGCTAAGTGTCACTATCGCA GTGGGGGCCTCTCTGCTGTTTCTCAACATCTTGGCTTTTGCAGCCCTGTACTACAAGAAGGATAAGAGGAGACATGATGTCCACCGGAGGTGCAGCCCTCA GCGCACGACCACCAACGACCTAACCCATGCTCCAGAAGAGGAAATTATGTCTCTCCAAATGAAGCACACTGACTTGGATCACGAGTGTGAGTCCATCCATCC ACATGAGGTGGTTCTTCGGACCGCCTGTCCCCCAGATTATACTCTAGCTATGAGGAGGTCACCTGATGATATTCCACTAATGACACCTAACACCATCACAATG ATTCCCAACACTATACCAGGGATTCAGCCCTTACATACATTCAACACATTTACTGGAGGACAGAATAATACACTGCCCCA |
|||||
| Nlgn2 | 2041-2895 | NM_198862 | 1:1,000 | 75 | this study |
| ACTGGTGACCCCAACCAGCCTGTGCCACAGGACACCAAGTTCATCCACACCAAGCCCAACCGCTTTGAAGAGGTAGTGTGGAGCAAGTTCAACAGCAAGGA AAAGCAGTATCTGCACATAGGCTTGAAACCACGCGTGCGCGACAACTACCGTGCCAACAAGGTGGCCTTCTGGCTGGAGCTCGTGCCCCACCTGCACAACC TGCACACAGAGCTCTTCACCACCACCACTCGCCTGCCTCCCTATGCCACACGCTGGCCACCTCGCACACCTGGTCCTGGCACTTCCGGCACACGCCGTCCT CCCCCACCTGCCACTCTGCCACCTGAGTCTGATATTGACCTAGGCCCAAGGGCCTATGACCGCTTCCCCGGTGACTCGAGGGACTACTCCACGGAGCTAAG CGTGACTGTGGCAGTGGGTGCCTCCCTCCTCTTCCTCAACATCCTTGCCTTTGCCGCCCTCTATTACAAGCGGGACCGGCGCCAGGAGCTGCGGTGCCGG AGGCTTAGCCCACCAGGAGGCTCAGGCTCAGGTGTGCCTGGTGGGGGCCCCCTGCTTCCCACTGCTGGCCGTGAGCTACCCCCGGAGGAGGAGCTAGTA TCGCTGCAGCTGAAGCGGGGTGGTGGTGTTGGGGCGGACCCTGCTGAGGCCCTGCGCCCTGCCTGTCCACCCGACTATACCCTGGCCTTGCGCCGGGCA CCGGACGATGTGCCTCTCTTGGCCCCCGGGGCCCTAACCCTGCTGCCTAGTGGCCTGGGGCCCCCGCCCCCGCCCCCACCCCCTTCTCTCCATCCCTTTG GGCCCTTCCCACCCCCACCCCCTACTGCTACCAGCCACAACAACACGCTACCC |
|||||
| Nlan3 | 2939-3782 | NM_172932 | 1:1,000 | 63.5 | (Tanaka et al., 2010) |
| ATGCACCCGCATGTACAAAAACACAAATCCAGACGTGAACCTGAATAGGCCCTTCAAATGGGGACACATACGAGTCCTTGGTACCAAGGGCCCATGGAACA GCAGCTGGAACCAGCTCCTTGAGCCCGACCACAGACACTCCTGGGGCCCTGGAAGCCACAGCCGGACACCCCCTTGGTGCTTGCCTTCTCGGAACTGCAC CTCTACCAACTGCAGACTCGGGAGCTTTAAAGAGCAGGATAGCTCTTCCTCCCCCAGACTTGGTCTTTTCTCTGGGTCTTGTTTTTGTTGATTTTTTTCATTTT TAAATTGGAACCAATGCTTTTCCAACCCATTGAGTGCTAAGCAGCTCTGGAAGGGAGGGCTCCAAGATCAGGACGCTCTGGCTCTGGGACTCCCAATGTTCA TACAATCAGACCAAGGAGAAGGACCTTCCAAGACAGTGACAGATGGGCACAAGACTATGGGGTAAGAGGAGGAAGAGGCTAGCAATGGATGGGGCTTGAG GGCCAGCAAGGACAGAGCACCAACTGGCTCTGGGCCTCCCAGAGAGGACTACAGAGCCTACAGGGTGACCTGCTTCTGCAAAGGCCAGCAGCAGCAGCCT GCCTGGAGAAGCCTAGGTTTGATGAACTAAGTACTGTGGAGGCCCTGACCTTATTGGGCCCCTGGGTATATAATCTGGGTTCTGCCTCTGCCCTTGGGGAC ATGATATCAGAAATTTGCCCCATTTTCTTTACAGTCTCTTTGTGTCTGTCATTTCTCTTTCAAAACAACAGTGTTTTGGTTTTTTTTTTTTTTTCGGTTGTTGTTGG CTTTTTTTTTTTTTTTTTTTTTAAGAAAA |
|||||
| Lrrtml | 1286-2134 | NM_028880.3 | 1:1,000 | 75 | this study |
| AGGCGGAATAAGGTTGCCATTGTGGTCAGCTCTCTCGACTGGGTTTGGAATTTGGAGAAAATGGACTTGTCTGGGAACGAGATCGAATACATGGAGCCCCAT GTGTTCGAGACCGTTCCCTACCTGCAGACCCTGCAGCTGGACTCCAACCGCCTCACCTACATTGAGCCCCGTATTCTCAACTCCTGGAAGTCCCTTACGAGC ATCACTCTGGCCGGGAACCTGTGGGACTGCGGGCGCAACGTGTGTGCTCTAGCTTCCTGGCTCAGCAACTTCCAGGGACGTTACGATGCTAACTTGCAGTG CGCCAGCCCAGAGTACGCACAGGGCGAGGACGTCTTGGATGCAGTGTATGCTTTCCACCTGTGTGAGGATGGGGCCGAGCCCACCAGCGGCCACCTCCT GTCGGTGGCCGTCACTAACCGCAGTGACCTAACGCCCCCAGAGAGCTCAGCCACGACTCTGGTGGACGGTGGGGAGGGGCACGATGGCACGTTTGAGCC CATCACTGTGGCTCTTCCAGGCGGCGAGCACGCAGAGAACGCTGTGCAAATCCACAAAGTGGTCACTGGCACCATGGCCCTCATCTTCTCCTTCCTCATCG TGGTCCTCGTACTCTACGTATCCTGGAAGTGTTTCCCAGCCAGCCTCAGGCAGCTCAGACAGTGCTTTGTCACGCAGCGCAGGAAGCAGAAGCAGAAACAG ACCATGCATCAGATGGCTGCTATGTCTGCCCAGGAATACTATGTTGATTACAAACCTAACCACATCGAGGGGGCCCTGGTTATCATCAACGAGTACGGTTCG TGTACCTGTCACCAGCAGCCTGCGAGGGAATGCGAGGTGTGA |
|||||
| Lrrtm2 | 183-682 | NM_178005.4 | 1:1,000 | 63.5 | this study |
| TATTAACTTATAATCAAAGCCGGTTTAGGGGATCAGAGCACAGGGAAAATGACACCAGTGCTTTCCAGAGGAATATCCTAAGGGAAAAAACAATTCACCCTGA TAGACTTGAATTTTACTTGAAAAGCCTGGGGCACAGAAAACAGGAAACTGGTCAAAGGCTCCTGCATGTTAGAGCCTTTTACAGACTCACTGCGTTGAGTCTG ACAACCTCGACTGAATGCAGCCTCCAATGTGCTCAGAAGAATGGGCTTACATTTCAAGTGGCCATTAGGGGCCCCTATGCTGGCAGCAATATATGCAATGAG TGTGGTATTAAAAATGCTGCCTGCCCTGGGTATGGCGTGTCCACCTAAATGCCGCTGTGAGAAGCTGCTATTCTACTGCGACTCTCAGGGCTTCCACTCAGT GCCAAACGCCACAGACAAGGGTTCTTTGGGTCTGTCCCTGAGGCACAATCACATCACAGCGCTTGAAAGAGATCAATTTGCCAGCTTCAG |
|||||
| Lrrtm3 | 1882-2281 | NM_178678 | 1:1,000 | 63.5 | this study |
| CCGCGAGCATGAAGCAGCTGCAGCAGCGCTCCCTCATGCGAAGGCACCGGAAGAAGAAACGGCAATCGCTCAAGCAGATGACTCCAGGCACCCAGGAATT TTATGTAGATTATAAACCCACCAACACGGAGACCAGCGAGATGCTGCTGAACGGAACGGGACCCTGCACCTATAGCAAATCAGGCTCCAGGGAATGTGAGA TACCTTTATCAATGAATGTGTCAACCTTTCTGGCATATGACCAGCCCACAATAAGTTACTGTGGGGTCCATCATGAACTCCTCTCCCATAAGTCCTTTGAAACG AATGCACAGGAAGACACGATGGAAAGCCACCTAGAGACTGAGCTGGACTTGAGCACAATCACGTCAGCTGGCCGCATCAGTGACCATAAACCACA |
|||||
| Lrrtm4 | 1608-2107 | NM_001134743 | 1:1,000 | 63.5 | this study |
| CTCCGTGGCCATGATTCTCCTGGTGATCTATGTGTCTTGGAAACGGTACCCAGCCAGCATGAAACAACTCCAACAGCACTCACTTATGAAGAGGAGACGGAA AAAGGCGAGGGAGTCGGAGAGACAGATGAATTCCCCTTTACAGGAATACTACGTGGACTACAAACCGACGAACTCTGAGACCATGGATATATCGGTTAATGG ATCTGGTCCCTGCACATATACCATCTCTGGCTCCAGGGAGTGTGAGATACCCCACCATGTGAAGCCCCTGCCGTATTACAGCTATGACCAACCAGTGATTGG GTACTGCCAGGCCCACCAGCCTCTCCACATCAACAAGGCTTATGAAGCTGTGTCTATAGAACAGGATGACAGCCCCAGTTTGGAGCTTGGGAGAGACCACA GCTTCATTGCCACCATAGCCAGGTCGGCTGCACCTGCCATTTATCTGGAGAGAATAACAAACTAACAGCGAAACTAACTTCTAGATGAAGAGC |
|||||
| Adgrl1 | 2943-3392 | NM_181039 | 1:1,000 | 63.5 | this study |
| TCCTGGAGGTAACTGTGCTGAACACGGAGGGCCAAGTGCAGGAGTTGGTGTTCCCCCAAGAGTATCCCAGTGAGAACTCCATTCAGCTCTCCGCCAACACC ATCAAGCAGAACAGCCGCAACGGTGTGGTGAAAGTTGTCTTCATTCTCTACAACAACCTGGGCCTCTTCTTGTCCACGGAGAATGCCACAGTGAAGCTGGCA GGTGAGGCAGGGACAGGTGGCCCTGGAGGTGCCTCCCTGGTGGTCAACTCACAGGTCATCGCAGCATCTATCAATAAGGAGTCTAGCCGCGTCTTCCTCAT GGACCCTGTCATCTTTACTGTAGCCCACTTGGAGGCCAAGAACCACTTCAATGCAAACTGCTCCTTCTGGAACTACTCAGAGCGCTCCATGCTGGGCTACTG GTCAACCCAGGGCTGCCGATTGGTGGAGTCCAATAAGACCCATA |
|||||
| Adgrl2 | 1834-2233 | NM_001081298 | 1:1,000 | 63.5 | this study |
| GCAATTGTGGACACGGTAGACAACCTTCTGAGAGCTGAGGCTTTGGAATCCTGGAAACACATGAATTCTTCAGAGCAGGCGCACACAGCCACAATGTTGTTG GATACCTTGGAAGAAGGAGCATTCGTCCTAGCAGACAACCTTTTGGAACCAACCAGGGTCTCCATGCCAACAGAAAATATTGTTTTAGAAGTTGCTGTCCTCA GCACGGAAGGGCAGGTCCAAGACTTTAAATTCCCTCTGGGCTTAAAGGGGTTGGGCAGCTCCATCCAGCTCTCTGCCAACACGGTCAAACAGAACAGCAGG AATGGGCTGGCCAAGCTGGTATTCATCATTTACCGGAGCCTGGGACAATTCCTAAGCACTGAGAACGCAACCATAAAGCTGGGTGCAGACCTCA |
|||||
| Adgrl3 | 2410-2809 | NM_001347367 | 1:1,000 | 63.5 | this study |
| CTGGATAGTAGATCAGGGCCGGTACATCATGGACAAGTCTCCTACATCTCTCCACCAATTCACCTCGACTCTGAACTAGAAAGGCCCCCTGTCAGAGGGATT TCTACCACAGGATCCCTGGGTATGGGAAGCACGACCACCAGCACCACCCTCCGGACCACAACCTGGAACATAGGCAGGAGTACCACCGCATCCTTGCCGG GCAGAAGAAACCGCAGTACCAGCACGCCATCCCCCGCGGTAGAGGTGCTGGATGACGTCACCACACACCTGCCCTCGGCAGCCTCCCAAATCCCAGCTAT GGAAGAGAGCTGCGAGGCTGTGGAAGCCCGAGAAATCATGTGGTTTAAGACCAGACAGGGGCAGGTAGCAAAGCAGCCATGCCCAGCAGGAACCATAG |
|||||
Preparation of cRNA probes
Chromogenic and double fluorescent in situ hybridization were performed as previously described (Yamasaki et al., 2001; Yamasaki et al., 2010; Kudo et al., 2012). cRNA probes used in the present study are shown in Table 1. By using linearized pBluescript-SK(−) clones as templates, fluorescein- or digoxigenin (DIG)-labeled cRNA probes were transcribed with RNA labeling kit (Sigma) and T3 or T7 RNA polymerase (Promega). cRNA probes were suspended in 50% formamide.
Chromogenic in situ hybridization
All experiments were carried out at room temperature, unless otherwise noted. Sections were pretreated as follows: acetylation with 0.25% acetic anhydride/0.1M triethanolamine-HCl (pH 8.0) for 10 min, wash with 2× SSC (1× SSC is composed of 150 mM NaCl and 15 mM sodium citrate) in 0.1% Tween 20 for 10 min, and prehybridization with hybridization buffer (50% formamide, 33 mM Tris-HCl [pH 8.0], 0.1% N-Laurosylsarcosine sodium salt, 1× Denhardt’s solution, 0.6 M NaCl, 200 μg/ml of tRNA, 1 mM EDTA, 10% dextran sulfate) for 30 min. Hybridization was carried out at 63.5 or 75°C in a 1:1,000 or 1:10,000 dilution of DIG-labeled cRNA probe (see Table 1) supplemented with hybridization buffer. Successive post-hybridization washing was done at 61 or 75°C; 5× SSC, 0.0005% Tween 20 for 20 min, 4× SSC, 50% formamide, 0.001% Tween 20 for 40 min, 2× SSC, 50% formamide, 0.001% Tween 20 for 40 min, and 0.1× SSC, 0.0005% Tween 20 for 20 min. For Nrxn1β mRNA, sections were alternatively washed with 2× SSC, 0.1 % Tween 20 at 75°C for 30 min twice, 20 μg/ml RNase, 0.5M NaCl, 10 mM Tris-HCl (pH 8.0), 1 mM EDTA at 37°C for 30 min, and 0.2× SSC, 0.1% Tween 20 at 37°C for 30 min. Sections were incubated with 20 μM iodoacetamide, 0.5 M NaCl, 0.01 M Tris-HCl [pH 8.0], 5 mM EDTA, 0.0005% Tween 20 for 30 min, DIG blocking solution (1% DIG blocking reagent [Sigma] in maleinic acid buffer [pH 7.5]) for 30 min, and alkaline phosphatase-conjugated anti-DIG antibody (1:500, Roche Diagnostics) in DIG blocking buffer for 2 hours. After washing with TNT buffer (0.1 M Tris-HCl [pH 7.5] and 0.15 M NaCl) three times, sections were incubated with NBT/BCIP solution (1:50; Roche Diagnostics) in 0.01 M Tris-HCl (pH 9.5), 0.01M MgCl2 at 4°C for up to 3 days. Sections were mounted on gelatin-coated slides and dehydrated in 100% methanol for 10 min, 100% ethanol two times for 10 min each, 100% Xylene three times for 10 min each, and embedded with Entellan New (Millipore). The specificity of cRNA probes against each Nrxn isoform mRNA was validated by the identical signal pattern obtained by two different probes and lack of hybridization signals with their sense probes (Figure 1).
Figure 1.
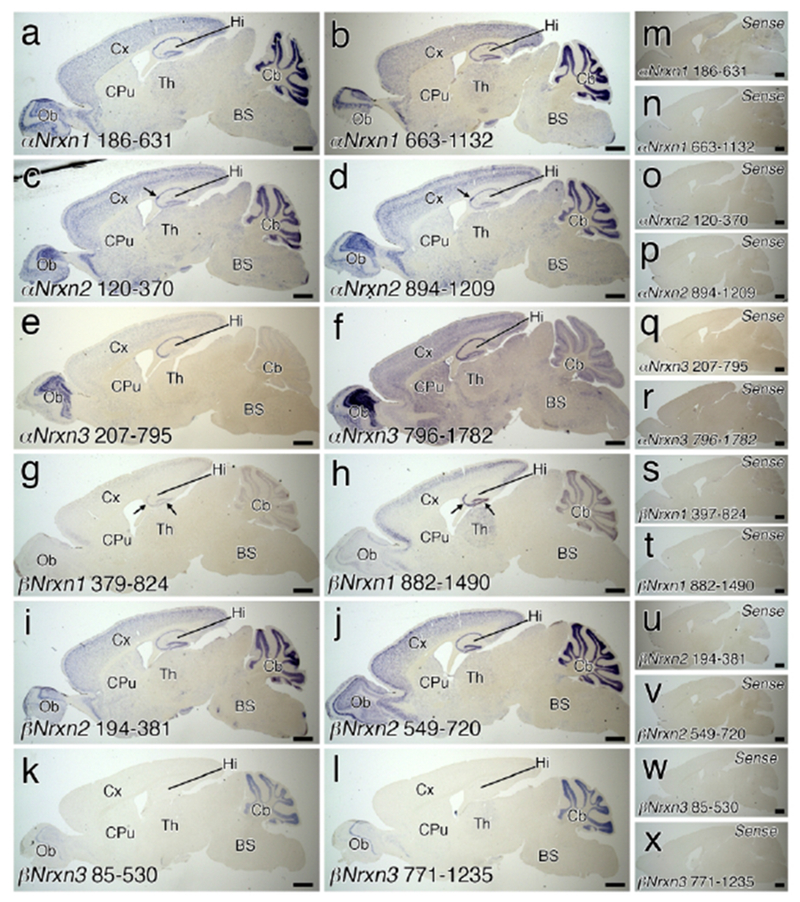
Validation of Nrxn ISH probes in the brain. (a-l) Whole brain sagittal views of chromogenic hybridization signals with Nrxn-isoform-specific antisense cRNA probes. Two cRNA probes are prepared for αNrxn1 (a, b), αNrxn2 (c, d), αNrxn3 (e, f), βNrxn1 (g, h), βNrxn2 (i, j), and βNrxn3 (k, l) mRNAs. Arrows indicate dense staining patterns in the CA2 for αNrxn2 mRNA (c, d) and in the CA3 and dentate gyrus for βNrxn1 mRNA (g, h). (m-x) Whole brain sagittal views of chromogenic hybridization signals with two sense cRNA probes lacking signal for αNrxn1 (m, n), αNrxn2 (o, p), αNrxn3 (q, r), βNrxn1 (s, t), βNrxn2 (u, v), and βNrxn3 (w, x) mRNAs. For abbreviations, see list. Scale bars, 1 mm.
Double-labeled fluorescent in situ hybridization
Fresh frozen sections were fixed with 4% paraformaldehyde, 0.1M PB for 30 min, acetylated with 0.25% acetic anhydride in 0.1M triethanolamine-HCl (pH 8.0) for 10 min, and prehybridized with hybridization buffer for 30 min. After dehydration, hybridization was then performed with a mixture of fluorescein- or DIG-labeled cRNA probes at a dilution of 1:1,000 or 1:10,000 (see Table 1) in hybridization buffer. Post-hybridization washing was performed as described for chromogenic in situ hybridization. To visualize signals, we adopted a two-step detection method. For the first detection, sections were blocked with DIG blocking solution for 30 min and 0.5% tryamide signal amplification (TSA) blocking reagent in TNT buffer for 30 min, and incubated with peroxidase-conjugated anti-fluorescein antibody (1:500, Roche Diagnostics) for 1 hour. After washing with TNT buffer three times, sections were incubated by using TSA Plus Fluorescein amplification kit (PerkinElmer) for 10 min. Residual peroxidase activity was inactivated with 3% H2O2 in TNT buffer for 30 min. For the second detection, sections were again blocked with DIG blocking solution and 0.5% TSA blocking reagent in TNT buffer for 30 min each, and incubated with peroxidase-conjugated anti-DIG antibody (1:500 Roche Diagnostics) for 1 hour. After washing with TNT buffer three times, signals were visualized with TSA Plus Cy3 amplification kit (PerkinElmer) for 10 min. Nuclear counterstaining was performed with DAPI (1:5000, Sigma-Aldrich) for 10 min. The specificity of cRNA probes for Th and P2ry12, which were newly generated in this study, were validated by unique signal patterns with labeled cells distributed selectively in catecholaminergic nuclei (Figures 14 and 15) and scattered in the neuropil region (Figures 16 and 17), respectively.
Figure 14.
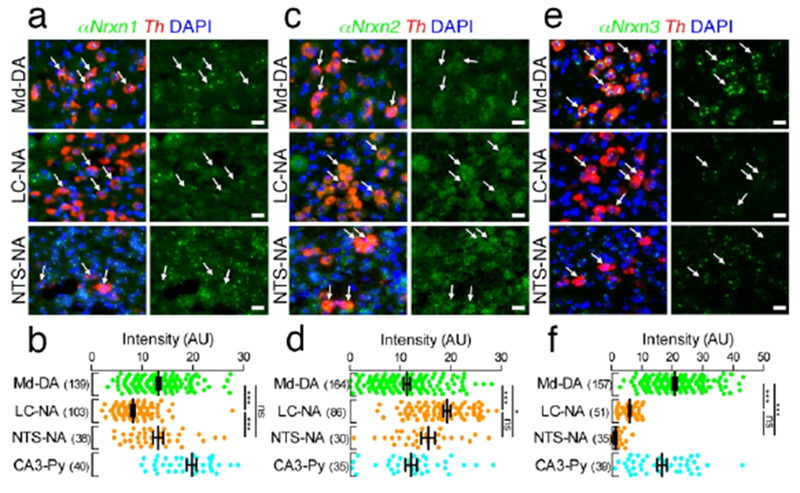
Distinct expression of αNrxn mRNAs in catecholaminergic neurons. (a, c, e) Double FISH for αNrxn1 (a), αNrxn2 (c), or αNrxn3 (e) and Th mRNAs showing distinct expression patterns of Nrxn mRNAs (green) in Th mRNA (red)-labeled DA neurons in the midbrain (Md-DA, top) and NA neurons in the LC (LC-NA, middle) and NTS (NTS-NA, bottom). Arrows indicate catecholaminergic neurons. Nuclei were stained with DAPI (blue). (b, d, f) Summary scatter plots for αNrxn1 (b), αNrxn2 (d), or αNrxn3 (f) mRNA in Md-DA (green), LC-NA (orange), and NTS-NA (orange) neurons. Signals are compared to hippocampal CA3 pyramidal neurons (CA3-Py) obtained from the same section (aqua). The number in the parentheses next to each column indicates the number of cells analyzed. Data are represented as means ± SEM. ns, not significant; * P < 0.05; ** P < 0.01; *** P < 0.001 (Kruskal-Wallis test with post hoc Dunn’s test). Scale bars, 20 μm.
Figure 15.
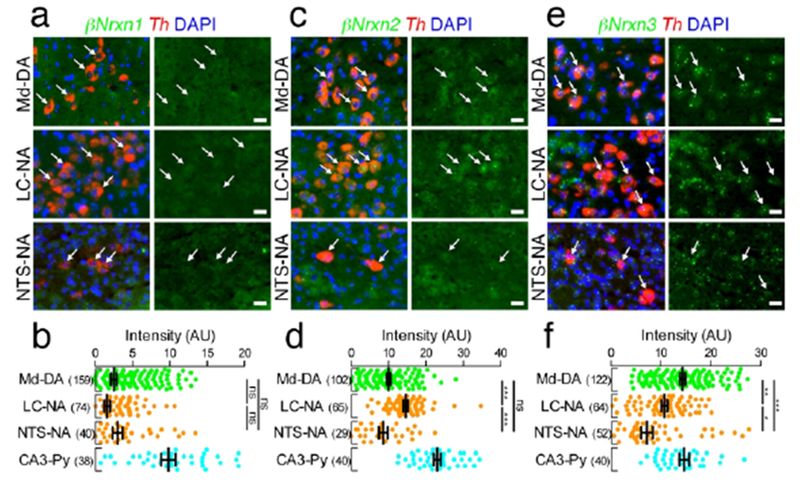
Distinct expression of βNrxn mRNAs in catecholaminergic neurons. (a, c, e) Double FISH for βNrxn1 (a), βNrxn2 (c), or βNrxn3 (e) and Th mRNAs showing distinct expression patterns of Nrxn mRNAs (green) in Th mRNA (red)-labeled DA neurons in the midbrain (Md-DA, top) and NA neurons in the LC (LC-NA, middle) and NTS (NTS-NA, bottom). Arrows indicate catecholaminergic neurons. Nuclei are stained with DAPI (blue). (b, d, f) Summary scatter plots for βNrxn1 (b), βNrxn2 (d), or βNrxn3 (f) mRNA in Md-DA (green), LC-NA (orange), and NTS-NA (orange) neurons. Signals are compared to hippocampal CA3 pyramidal neurons (CA3-Py) obtained from the same section (agua). The number in the parentheses next to each column indicates the number of cells analyzed. Data are represented as means ± SEM. ns, not significant; * P < 0,05; ** P < 0,01; *** P < 0.001 (Kruskal-Wallis test with post hoc Dunn’s test). Scale bars, 20 μm.
Figure 16.
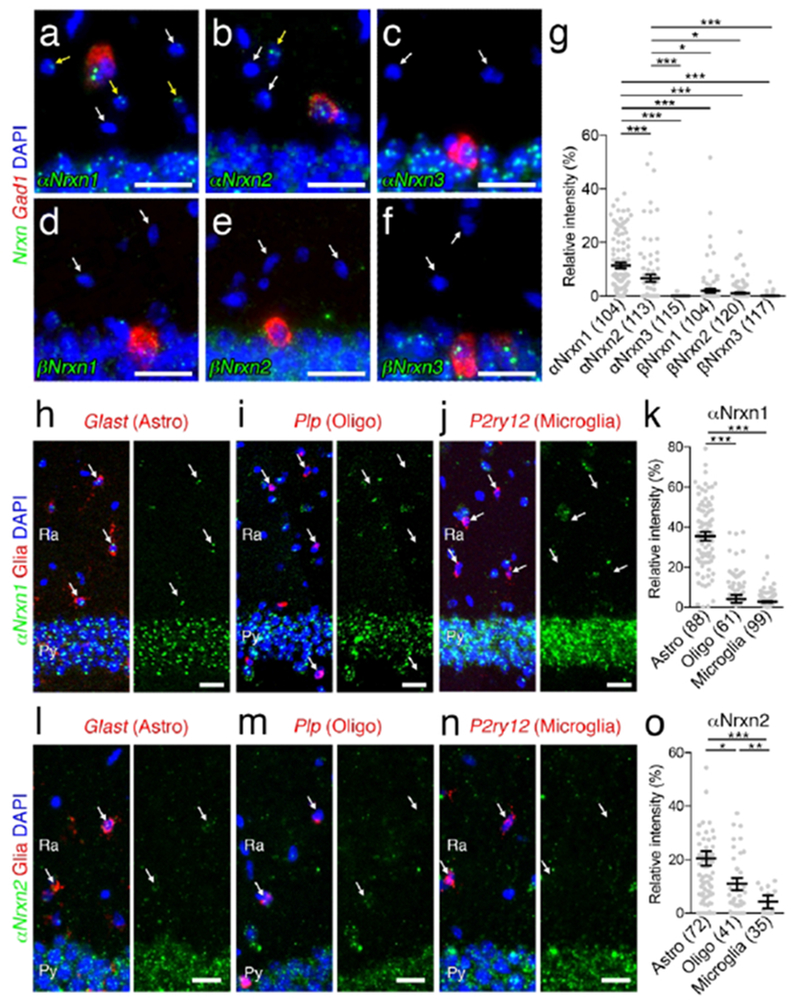
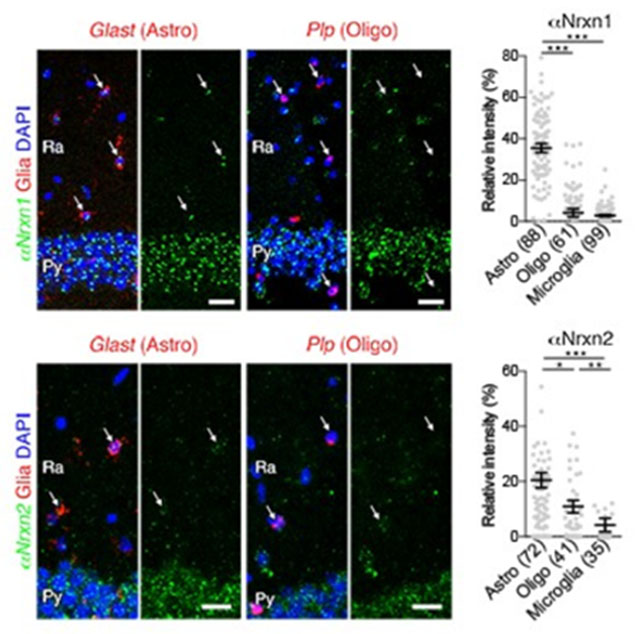
Non-neuronal αNrxn1 and αNrxn2 expression in the hippocampal CA1 subregion. (a - f) Double FISH for αNrxn1 (a), αNrxn2 (b), αNrxn3 (c), βNrxn1 (d), βNrxn2 (e), or βNrxn3 (f) and Gad1 mRNAs in the hippocampus CA1 region showing different expression patterns of Nrxn mRNAs (green) in non-neuronal cells identified by neuropil cells negative for Gad1 mRNA (red). Yellow and white arrows indicate non-neuronal cells with or without Nrxn expression, respectively. (g) Summary scatter plot for six Nrxn mRNAs in non-neuronal cells. The signal intensity in each cell is normalized to that in CA1 pyramidal cells, (h-j, l-n) Double FISH for αNrxn1 (h-j) or αNrxn2 (l-n) mRNA (green) and non-neuronal markers (red), including Glast (h, l), Plp (i, m), and P2ry12 (j, n) for astrocytes (Astro), oligodendrocytes (Oligo), and microglia, respectively. Arrows indicate non-neuronal cells. Nuclei were stained with DAPI (blue). Ra, stratum radiatum; Py, Pyramidal cell layer, (k, o) Summary scatter plot for αNrxn1 (k) or αNrxn2 (o) mRNA in astrocytes, oligodendrocytes, and microglia. The signal intensity in each cell is normalized to that in CA1 pyramidal cells. The number in the parentheses below the scatter plot indicates the number of cells analyzed. Data are represented as means ± SEM. * P < 0.05; ** P < 0.01; *** P < 0.001 (Kruskal-Wallis test with post hoc Dunn’s test). Scale bars, 20 μm.
Figure 17.
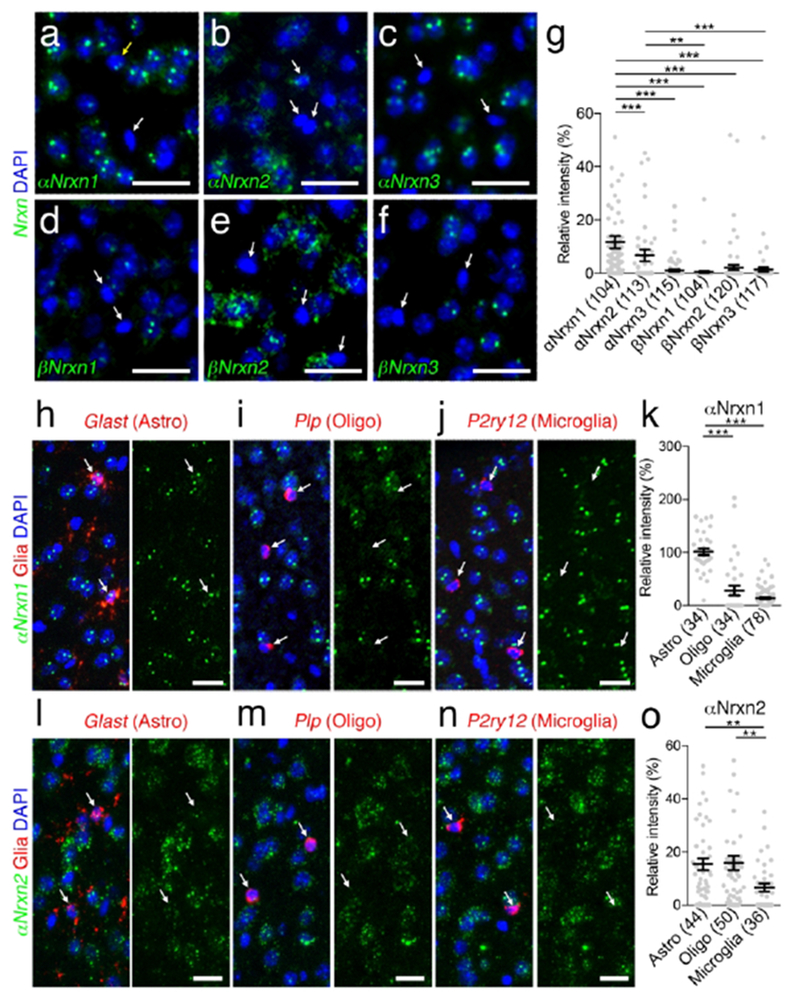
Non-neuronal αNrxn1 and αNrxn2 expression in the somatosensory cortex. (a - f) Single FISH for αNrxn1 (a), αNrxn2 (b), αNrxn3 (c), βNrxn1 (d), βNrxn2 (e), or βNrxn3 (f) in the somatosensory cortex showing different expression patterns of Nrxn mRNAs (green) in non-neuronal cells with small and dark DAPI+ nuclei. Yellow and white arrows indicate non-neuronal cells with or without Nrxn expression, respectively, (g) Summary scatter plot for six Nrxn mRNAs in non-neuronal cells. The signal intensity in each cell is normalized to that in cortical neurons with large and pale DAPI+ nuclei. (h-i, l-n) Double FISH for αNrxn1 (h-i) or αNrxn2 (l-n) mRNA (green) and non-neuronal markers (red), including Glast (h, l), Plp (i, m), and P2ry12 (i, n) for astrocytes (Astro), oligodendrocytes (Oligo), and microglia, respectively. Arrows indicate non-neuronal cells. Nuclei were stained with DAPI (blue). Ra, stratum radiatum; Py, Pyramidal cell layer, (k, o) Summary scatter plot for αNrxn1 (k) and αNrxn2 (o) mRNA in astrocytes, oligodendrocytes, and microglia. The signal intensity in each cell is normalized to that in cortical neurons. The number in the parentheses below the scatter plot indicates the number of cells analyzed. Data are represented as means ± SEM. * P < 0.05; ** P < 0,01; *** P < 0,001 (Kruskal-Wallis test with post hoc Dunn’s test). Scale bars, 20 μm.
Image acquisition, analysis and quantification
Chromogenic images were acquired with a dissecting microscope (SZX16, Olympus) equipped with a CCD digital camera (INFINITY3–1UC, Lumenera) or a fluorescence microscope (BZ-X710, Keyence) with a 20× objective lens (NA 0.75). Images were analyzed with ImageJ software (SCR 003070). Briefly, images were converted to grayscale with the dark background. The mean Nrxn signal intensity in a given region was measured and normalized to the mean intensity in the pyramidal cell layer of the piriform cortex, which exhibited high signals for all isoforms (Figures 2g–l and 3a–f). The background noise was defined as the mean intensity outside the section and subtracted from each density before normalization. We scored >70% of the normalized intensity as strong (+++), 30–70% as moderate (++), 10–30% as weak (+), and <10% as very weak or not detected (−) (Table 2). FISH images were acquired with a fluorescence microscope (BZ-X710, Keyence) with a 20× objective lens (NA 0.75) or a confocal microscope (FV1200, Olympus) with a UPlanSapo 20× objective (NA 0.75). The images were captured with exposure times respective to each Nrxn isoform. On the confocal, the size of images was 800 × 800 or 1000 × 1000 pixels. For quantification, simultaneously stained sets of cells on the same slide were imaged using identical settings. Measurements were performed with one section from each brain by using ImageJ software. Briefly, background levels were determined with the signal intensity in DAPI-negative neuropil regions, and subtracted from each image. The same circular region of interest (ROI) was applied to cell bodies containing DAPI+ nuclei with or without labeling for cell type-specific markers, and the mean signal intensity was measured.
Figure 2.
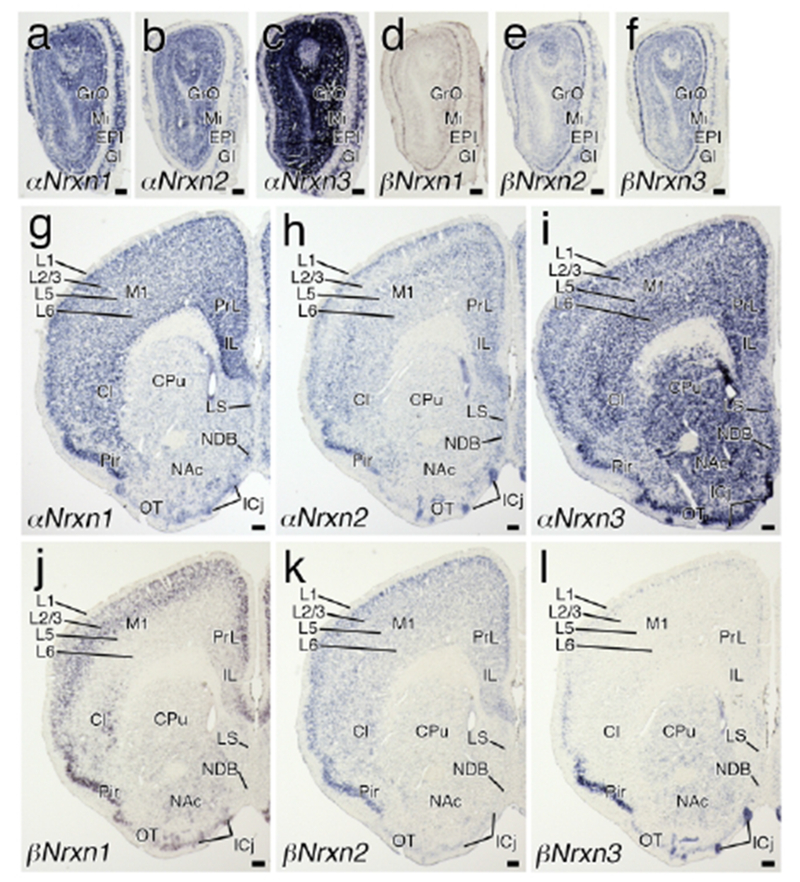
Region-specific expression of Nrxn mRNAs in the telencephalon and diencephalon. Coronal views of chromogenic hybridization signals for αNrxn1 (a, g), αNrxn2 (b, h), αNrxn3 (c, i), βNrxn1 (d, j), βNrxn2 (e, k), and βNrxn3 (f, I) mRNAs in the mouse brain. For abbreviations, see list. Scale bars, 200 μm.
Figure 3.
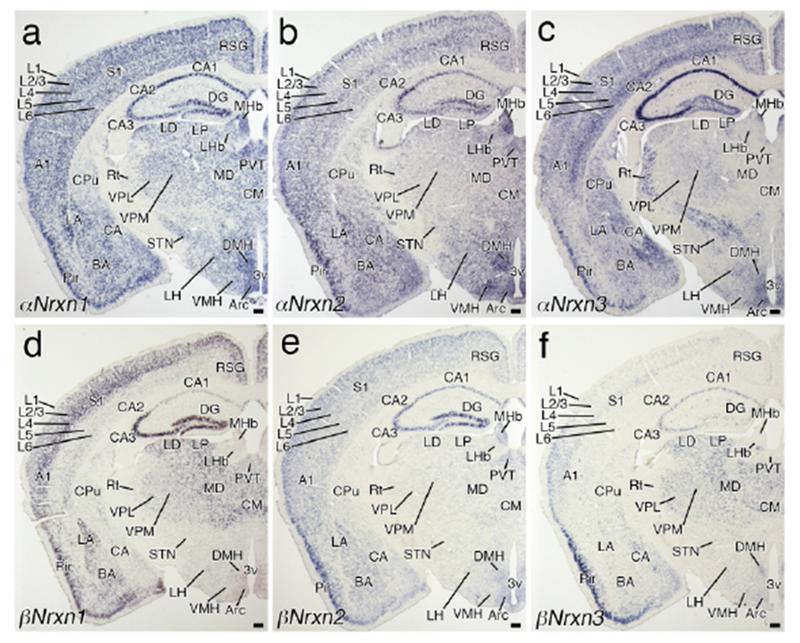
Region-specific expression of Nrxn mRNAs in the telencephalon and diencephalon. Coronal views of chromogenic hybridization signals for αNrxn1 (a), αNrxn2 (b), αNrxn3 (c), βNrxn1 (d), βNrxn2 (e), and βNrxn3 (f) mRNAs in the mouse brain. For abbreviations, see list. Scale bars, 200 μm.
Table 2.
Expression levels of 6 isoforms of Nrxn mRNAs in individual regions
|
Nrxn mRNA expression |
|||||||
|---|---|---|---|---|---|---|---|
| Region | αNrxn1 | αNrxn2 | αNrxn3 | βNrxn1 | βNrxn2 | βNrxn3 | Figures |
| Telencephalon | |||||||
| Olfactory bulb (Ob) | |||||||
| Glomerular layer (Gl) | +++ | + | +++ | + | ++ | + | 2 |
| Mitral cell layer (Mi) | +++ | ++ | +++ | ++ | +++ | +++ | 2 |
| Granule cell layer (GrO) | +++ | ++ | +++ | + | ++ | ++ | 2 |
| Neocortex (Primary somatosensory cortex: S1) | |||||||
| Layer 1 | + | + | + | - | - | +/− | 3, 8, 9 |
| Layers 2/3 | ++ | ++ | ++ | ++ | ++ | + | 3, 8, 9 |
| Layer 4 | ++ | + | + | ++ | + | ++ | 3, 8, 9 |
| Layer 5 | ++ | ++ | ++ | ++ | + | + | 3, 8, 9 |
| Layer 6 | ++ | + | ++ | + | + | + | 3, 8, 9 |
| Neocortex (Primary motor cortex: M1) | |||||||
| Layer 1 | + | + | + | − | − | − | 2 |
| Layers 2/3 | ++ | ++ | ++ | ++ | ++ | +§ | 2 |
| Layer 5 | ++ | ++ | ++ | + | + | + | 2 |
| Layer 6 | ++ | + | ++ | + | + | + | 2 |
| Neocortex (Primary auditory cortex: A1) | |||||||
| Layer 1 | + | + | + | + | − | − | 3, 4 |
| Layers 2/3 | ++ | ++ | ++ | ++ | ++ | ++ | 3, 4 |
| Layer 4 | ++ | + | ++ | ++ | + | ++ | 3, 4 |
| Layer 5 | ++ | ++ | ++ | + | + | + | 3, 4 |
| Layer 6 | ++ | + | ++ | + | + | + | 3, 4 |
| Retroslpenial granular cortex (RSG) | ++ | ++ | ++ | ++ | + | + | 3, 4 |
| Piriform cortex (Pir) | +++ | +++ | +++ | +++ | +++ | +++ | 2, 3 |
| Lateral entorhinal cortex (LEnt) | ++ | ++ | ++ | ++ | ++ | 4,5 | |
| Medial entorhinal cortex (MEnt) | ++ | ++ | + | ++ | ++ | + | 5 |
| Olfactory tubercule (OT) | + | + | +++ | + | + | ++ | 2 |
| Hippocampus | |||||||
| CA1 | +++ | ++ | +++ | + | +++ | ++ | 3, 4, 10, 11 |
| CA2 | +++ | +++ | +++ | +++ | +++ | ++ | 3, 4, 10, 11 |
| CA3 | +++ | ++ | +++ | +++ | +++ | ++ | 3, 4, 10, 11 |
| Subiculum (Su) | ++ | ++ | ++ | + | + | + | 4 |
| Dentate gyrus (DG) | +++ | ++ | ++ | +++ | +++ | + | 3, 4, 10, 11 |
| Caudate-putamen (CPu) | + | + | +++ | + | + | ++ | 2 |
| Nucleus accumbens (NAc) | + | + | +++ | + | + | ++ | 2 |
| Island of Calleja (ICj) | ++ | +++ | +++ | +++ | + | +++ | 2 |
| Lateral septal nucleus (LS) | + | ++ | ++ | + | + | + | 2 |
| Nucleus of the diagonal band (NBD) | ++ | ++ | ++ | + | + | + | 2 |
| Amygdala | |||||||
| Lateral nucleus (LA) | ++ | ++ | ++ | ++ | ++ | + | 3 |
| Basal nucleus (BA) | ++ | ++ | ++ | + | ++ | + | 3 |
| Central nucleus (CA) | ++ | ++ | ++ | + | ++ | ++ | 3 |
| Claustrum (Cl) | ++ | + | +++ | ++ | ++ | + | 3 |
| Diencephalon | |||||||
| Epithalamus | |||||||
| Lateral habenular nucleus (LHb) | ++ | + | + | − | + | + | 3 |
| Medial habenular nucleus (MHb) | +++ | +++ | +§ | - | ++ | - | 3 |
| Thalamus | |||||||
| Ventral posteromedial nucleus (VPM) | ++ | + | + | + | + | ++ | 3 |
| Ventral posterolateral nucleus (VPL) | ++ | + | + | + | + | ++ | 3 |
| Lateral dorsal nucleus (LD) | ++ | + | + | ++ | + | ++ | 3 |
| Lateral posterior nucleus (LP) | ++ | + | + | ++ | + | ++ | 3 |
| Mediodorsal nucleus (MD) | ++ | + | + | ++ | + | ++ | 3 |
| Centromedian nucleus (CM) | ++ | + | + | ++ | + | ++ | 3 |
| Paraventricular nucleus (PVT) | ++ | ++ | + | + | ++ | + | 3 |
| Medial geniculate nucleus (MGN) | ++ | + | + | ++ | + | ++ | 4 |
| Reticular thalamic nucleus (Rt) | + | + | ++ | − | + | + | 3 |
| Subthalamic nucleus (STN) | ++ | + | + | − | + | + | 3 |
| Hypothalamus | |||||||
| Lateral area (LH) | ++ | ++ | + | − | + | + | 3 |
| Dorsomedial nucleus (DMH) | +++ | +++ | ++ | − | ++ | ++ | 3 |
| Ventromedial nucleus (VMH) | ++ | +++ | + | − | + | + | 3 |
| Arcuate nucleus (Arc) | +++ | ++ | +++ | + | ++ | + | 3 |
| Midbrain | |||||||
| Superior colliculus(SC) | ++ | ++ | +§ | − | + | +§ | 4,5 |
| Inferior colliculus (IC) | ++ | + | +§ | + | ++ | +§ | 5,6 |
| Parabigeminal nucleus (PBG) | ++ | ++ | + | + | + | + | 5 |
| Periaqueductal gray (PAG) | ++ | + | + | + | + | − | 4,5 |
| Nucleus of Darkschewitsch (ND) | + | ++ | +++ | − | + | + | 4 |
| Edinger-Westphal nucleus (EW) | + | ++ | + | − | + | + | 4 |
| Dorsal raphe nucleus | |||||||
| Dorsal part (DRD) | ++ | ++ | + | − | ++ | + | 5 |
| Ventral part (DRV) | ++ | ++ | + | − | ++ | + | 5 |
| Lateral part (DRL) | ++ | ++ | ++ | − | + | + | 5 |
| Substantia nigra pars reticulate (SNr) | + | + | + | − | + | + | 4 |
| Substantia nigra pars compacta (SNc) | + | ++ | ++ | − | + | + | 4, 14, 15 |
| Ventral tegmental area (VTA) | ++ | ++ | ++ | − | + | + | 4 |
| Interpeduncular nucleus (IPN) | ++ | ++ | ++ | + | + | + | 4 |
| Pons | |||||||
| Dorsal nucleus of lateral lemniscus (DLL) | + | + | ++§ | − | − | + | 5 |
| Nucleus of trapezoid body (NTB) | + | − | ++§ | − | − | − | 5 |
| Paraolivary region of superior olivary complex (SOP) | + | − | +§ | − | − | + | 5 |
| Pontine reticular nucleus (PRN) | + | − | +§ | − | − | +§ | 5 |
| Laterodorsal tegmental nucleus (LDTg) | ++ | ++ | ++ | − | + | + | 6 |
| Locus coeruleus (LC) | + | ++ | + | − | ++ | + | 6, 14, 15 |
| Lateral parabrachial nucleus (LPB) | ++ | + | + | − | + | +§ | 6 |
| Medial parabrachial nucleus (MPB) | + | + | + | − | + | + | 6 |
| Ventral cochlear nucleus (VC) | + | − | +§ | − | + | +§ | 6 |
| Facial nucleus (VII) | + | ++ | − | − | + | − | 6 |
| Principal sensory nucleus of trigeminal nerve (PrV) | + | − | +§ | − | + | +§ | 6 |
| Medulla | |||||||
| Gigantocellular reticular nucleus (GRN) | + | + | ++§ | − | − | +§ | 6 |
| Spinal nucleus of trigeminal nerve (SpV) | + | + | + | + | + | + | 7 |
| Nucleus of the tractus solitarius (NTS) | ++ | ++ | ++ | + | ++ | ++ | 7, 14, 15 |
| Dorsal motor nucleus of vagus nerve (DMX) | ++ | ++ | ++ | + | ++ | + | 7 |
| Hypoglossal nucleus (XII) | + | ++ | + | − | ++ | + | 7 |
| Inferior olivary complex (IO) | + | + | − | + | ++ | − | 7 |
| Medullary reticular nucleus (MRN) | + | + | +§ | − | + | + | 7 |
| Lateral reticular nucleus (LRN) | + | + | + | − | + | + | 7 |
| Cerebellum | |||||||
| Purkinje cell layer (PCL) | + | ++ | +++ | + | ++ | + | 6, 7, 12, 13 |
| Granule cell layer (GrC) | +++ | ++ | +§ | +++ | +++ | +++ | 6, 7, 12, 13 |
| Molecular layer (ML) | + | + | +§ | - | - | - | 6, 7, 12, 13 |
+++, strong; ++, moderate; +, weak; –, very weak or not detected. See Materials and Methods for the criteria to determine the expression levels of Nrxn isoforms in individual regions.
Regions including sparse cells highly expressing Nrxn isoforms.
The expression of Nrxns in glutamatergic and GABAergic neurons were examined with double FISH sections for glutamic acid decarboxylase 1 (Gad1), a marker of GABAergic neurons, and Nrxn mRNAs. In the somatosensory cortex, most DAPI+ nuclei were divided into two types: large and pale nuclei containing a few heavily stained puncta for DAPI, reflecting decondensed chromatin (arrowheads in Figure 8a, b), and small and dark nuclei (arrows in Figure 8a, b). The former DAPI+ nuclei were classified as neuronal nuclei, and the latter as non-neuronal nuclei (Yu et al., 2015). Most glutamatergic and GABAergic neurons, identified by type 1 vesicular glutamate transporter (Vglut1) and Gad1 mRNA expression, respectively, displayed large and pale DAPI signals (Vglut1: 99.2% /total 249 Vglut1+ nuclei; Gad1: 98.8% /84). All cells with small and dark DAPI+ nuclei (n = 134 nuclei) did not express Vglut1 or Gad1. Thus, Gad1(−) cells with large and pale DAPI+ nuclei were analyzed as glutamatergic neurons. Occasionally, cells with small and dark DAPI+ nuclei were found, but not used for quantitative analysis. In the hippocampus and cerebellar cortex, glutamatergic neurons were densely distributed in pyramidal or granule cell layers, and predominate over other types of cells. Thus, Gad1(−) cells in these cell layers were classified as glutamatergic neurons.
Figure 8.
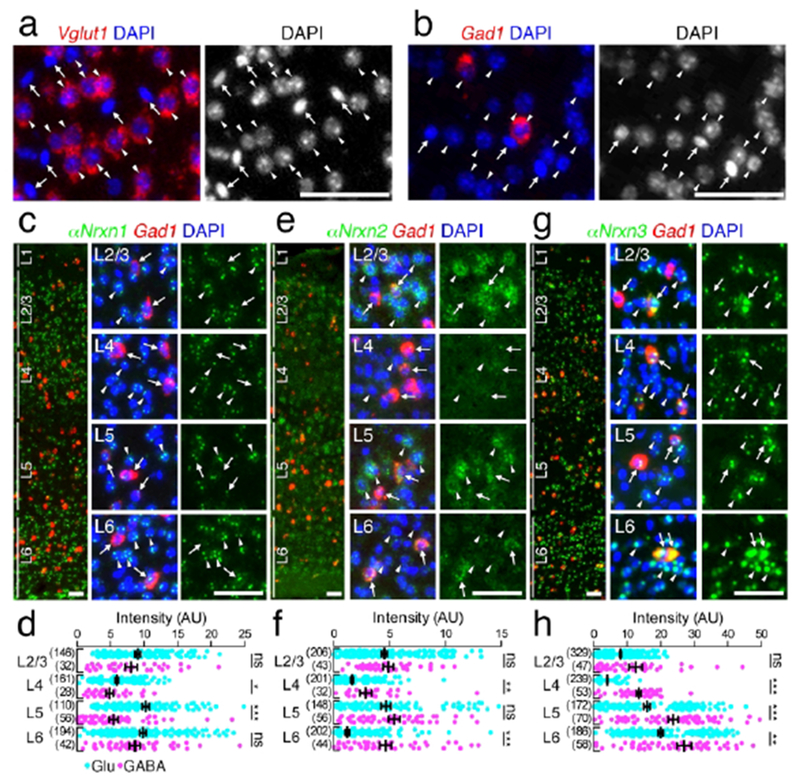
Layer-specific expression of a αNrxn mRNAs in the primary somatosensory neocortex. (a, b) Single FISH for Vglut1 (red, a) and Gad1 (red, b) mRNAs with DAPI staining (blue and gray on the left and right, respectively). Note that Vglut1 (a) or Gad1 (b) mRNA-expressing neurons have large and pale DAPI+ nuclei (arrowheads), but not small and dark DAPI+ nuclei (arrows), (c, e, g) Double FISH for αNrxn1 (c), αNrxn2 (e), αNrxn3 (g) and Gad1 mRNAs showing distinct laminar-specific patterns of Nrxn mRNAs (green) between Gad1(+) GABAergic (red, arrows) and Gad1(−) glutamatergic (arrowheads) neurons. The left panel presents a low power-magnified image including the entire cortical layers, and the middle and right panels present high power-magnified images of layers 2/3, 4, 5, and 6 (L2/3, L4, L5, and L6) in order from the top. Note that the signals for Nrxns in GABAergic neurons tend to be variable. Nuclei were stained with DAPI (blue). (d, f, h) Summary scatter plots for αNrxn1 (d), αNrxn2 (f), or αNrxn3 (h) mRNA in glutamatergic (aqua) and GABAergic (magenta) neurons. The numbers of cells analyzed are indicated in the parenthesis to the left of each column. Data are represented as means ± SEM. ns, not significant; * P < 0.05; ** P < 0.01; *** P < 0.001 (Mann-Whitney test). Scale bars, 50 μm.
Statistical analyses
The data were obtained from two mice and pooled. Results are reported as means ± SEM. For comparison between two neuronal types, Mann-Whitney non-parametric test was performed. For multiple comparisons, Kruskal-Wallis non-parametric ANOVA followed by Dunn’s post hoc test were performed using Prism 5 (Graph Pad Software). Statistical significance was set at p < 0.05.
RESULTS
1. Overall expression in the brain and validation of ISH probes
Two non-overlapping antisense probes for the unique amino terminus and/or 5′-UTR region of each Nrxn isoform (total, 12 probes) were used to determine overall expression in the brain (Figure 1). Chromogenic in situ hybridization with sagittal brain sections showed distinct signal patterns for each isoform. Strong signals for αNrxn1 αNrxn2, and βNrxn2 mRNAs were distributed in the olfactory bulb, neocortex, hippocampus, and cerebellum (Figure 1a–d, i, j). Expression of βNrxn1 mRNA was high in the neocortex, hippocampus, and cerebellum (Figure 1g, h). High expression of αNrxn3 mRNA was observed in the olfactory bulb, neocortex, hippocampus, and caudate-putamen (Figure 1e, f), while βNrxn3 mRNA was enriched in the olfactory bulb and cerebellum (Figure 1k, I). In the thalamus and brainstem, all isoforms of Nrxn mRNAs were differentially expressed at low to moderate levels. Two cRNA probes for each isoform yielded somewhat different intensities, particularly for αNrxn3 and βNrxn1 labeling, but importantly, exhibited the same spatial patterns of labeling. Furthermore, no signals were found with the sense cRNA probes (Figure 1m–x). These results indicate the specificity of cRNA probes and hybridizing signals with use of them.
2. Region-specific expression of Nrxn isoforms
To map the expression of each Nrxn isoform in the brain, we used coronal sections of mouse brains at the age of one month. In the following analysis, two non-overlapping cRNA probes were used in mixture to increase the intensity of hybridizing signals. The expression levels of each Nrxn isoform were assessed based on signal intensity (Table 2).
2.1. Telencephalon
2.1.1. Olfactory bulb
All six Nrxn isoforms were detected in the olfactory bulb (Figure 2a–f), consistent with a previous study (Ullrich et al., 1995). αNrxn1 and αNrxn3 mRNAs were highly expressed in each neuronal layer, i.e., the glomerular, mitral cell, and granule cell layers, while αNrxn2 mRNA was more enriched in the mitral and granule cell layers than in the glomerular layer. All three βNrxn mRNAs were, though generally low compared with αNrxns, dominantly expressed in the mitral cell layer.
2.1.2. Neocortex
In the neocortex, distinct laminar patterns were observed (Figures 2g–l, 3, and 4), as previously described in rat brains (Ullrich et al., 1995). Among six isoforms, αNrxn1 mRNA was expressed uniformly in cortical layers 2-6 (Figures 2g, 3a, and 4a), while others varied among cortical layers. αNrxn2 mRNA peaked in layers 2/3 and 5 (Figures 2h and 3b), αNrxn3 mRNA peaked in layers 5 and 6 (Figures 2i, 3c, and 4c), and βNrxn1 and βNrxn2 mRNAs were dominantly expressed in layers 2/3 and 4 (Figures 2j, k, 3d, e, and 4d, e). Layers with the highest level of βNrxn3 mRNA varied in different neocortical areas: layers 2/3 in the primary motor (Figure 2I), layer 4 in the primary somatosensory (Figure 3f), and layers 2/3 and 4 in the primary auditory cortex (Figures 3f and 4f).
Figure 4.
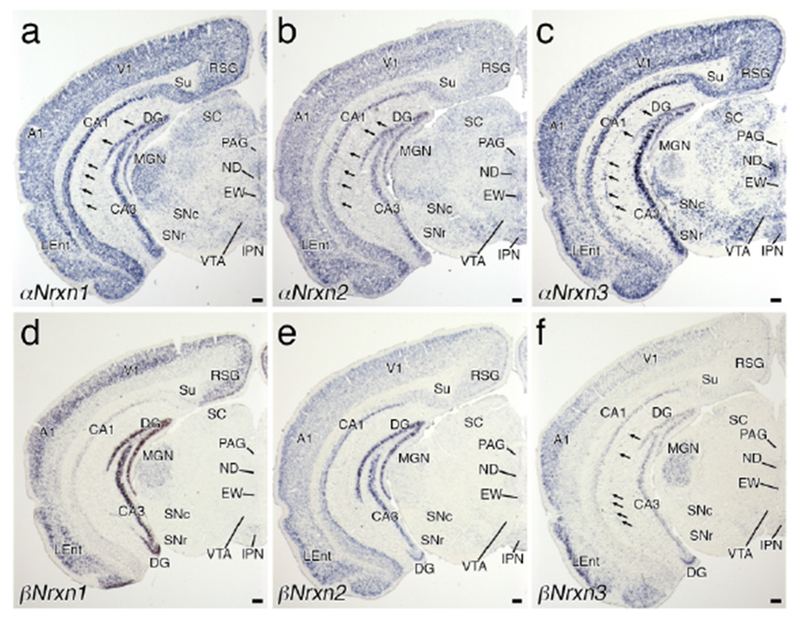
Region-specific expression of Nrxn mRNAs in the midbrain. Coronal views of chromogenic hybridization signals for αNrxn1 (a), αNrxn2 (b), αNrxn3 (c), βNrxn1 (d), βNrxn2 (e), and βNrxn3 (f) mRNAs in the mouse brain. Arrows indicate cells expressing αNrxn1 (a), αNrxn2 (b), αNrxn3 (c), and αNrxn3 (f) mRNAs in the neuropil layer of the hippocampus. For abbreviations, see list. Scale bars, 200 μm.
High expression of all six isoforms was found in the pyramidal cell layer of the piriform cortex (Figures 2g–l and 3a–f). Similarly, all six isoforms were highly expressed in the upper layers of the lateral entorhinal cortex at rostral levels (Figure 4a–f). At more caudal levels, αNrxn3 and βNrxn3 mRNA signal intensities were lower in the lateral and medial entorhinal cortex (Figure 5c, f), whereas expression levels were maintained there for other isoforms (Figure 5a, b, d, e). This suggests a rostrocaudal gradient of αNrxn3 and βNrxn3 expression within the entorhinal cortex.
Figure 5.
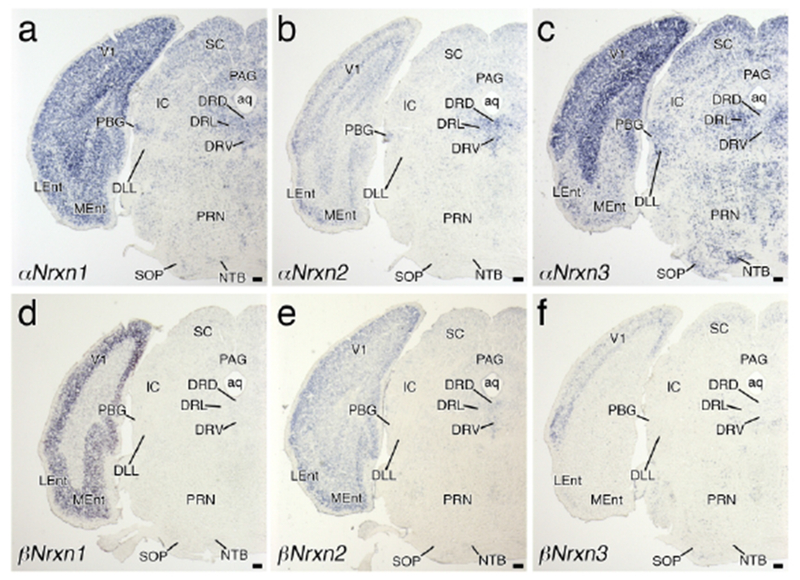
Region-specific expression of Nrxn mRNAs in the pons. Coronal views of chromogenic hybridization signals for αNrxn1 (a), αNrxn2 (b), αNrxn3 (c), βNrxn1 (d), βNrxn2 (e), and βNrxn3 (f) mRNAs in the mouse brain. For abbreviations, see list. Scale bars, 200 μm.
2.1.3. Hippocampus
The hippocampal formation, including the Ammon’s horn (CA1-CA3), subiculum, and dentate gyrus, was one of the regions with the highest signals for each isoform in the brain (Figures 3a–f and 4a–f). Consistent with previous studies (Ullrich et al., 1995; Nguyen et al., 2016), expression patterns in neuronal cell layers varied by Nrxn isoforms and hippocampal subregion. αNrxn1 and βNrxn2 mRNAs were uniformly expressed across different subregions (Figures 3a, e and 4a, e). In contrast, αNrxn2 mRNA expression peaked in the CA2 (Figure 3b), αNrxn3 mRNA in the CA1-CA3 (Figures 3c and 4c), and αNrxn1 mRNA in the CA3 and dentate gyrus (Figures 3d and 4d). The expression pattern of βNrxn3 mRNA was unique, in that it was hardly detected in the rostral portion of the dentate gyrus (Figure 3f), but expressed in more caudal portions of the dentate gyrus, particularly its ventral part (Figure 4f), suggesting a septotemporal gradient of βNrxn3 expression within the dentate gyrus. In neuropil layers, some scattered cells were labeled for αNrxn1-3 and βNrxn3 mRNAs, suggesting their expression in interneurons (arrows in Figure 4a–c, f).
2.1.4. Cerebral nuclei
In the caudate-putamen and nucleus accumbens, αNrxn3 mRNA was predominantly expressed (Figure 2i). The island of Calleja showed intense signals for αNrxn2, αNrxn3, βNrxn1, and βNrxn3 mRNAs (Figure 2h–j, l). In the lateral septal nucleus and nucleus of the diagonal band, three αNrxn isoforms were discernible, but βNrxn isoforms were at low or undetectable levels (Figure 2g–l). In the amygdala, αNrxn1, αNrxn2, αNrxn3, and βNrxn2 mRNAs were uniformly expressed in three subnuclei, the lateral, basal and central nuclei, while βNrxn2 and βNrxn3 mRNAs were more enriched in the lateral or central nucleus, respectively (Figure 3a–f).
2.2. Diencephalon
In the medial habenular nucleus, high to moderate expression was noted for αNrxn1, αNrxn2, and βNrxn2 mRNAs, and αNrxn3 mRNA expression was confined to its dorsomedial portion (Figure 3a–c, e). Expression levels were generally low in the lateral habenular nucleus, with relatively higher levels for αNrxn1 mRNA (Figure 3a). In the thalamus, αNrxn1, βNrxn1, and βNrxn3 mRNAs were expressed widely and highly, as exemplified by ventral posteromedial and posterolateral nuclei, mediodorsal nucleus, and medial geniculate nucleus (Figures 3a–f and 4a–f). In the subthalamic nucleus and reticular thalamic nucleus, αNrxn1 or αNrxn3 mRNA, respectively, was a predominant isoform (Figure 3a, c). In the hypothalamus, three αNrxn isoforms were predominantly expressed, with some different intensities among the lateral, dorsomedial, ventromedial, and arcuate nuclei (Figure 3a–f). A moderate expression level was also found for βNrxn2 mRNA in the arcuate nucleus (Figure 3e).
2.3. Midbrain
Three αNrxn isoforms were widely and predominantly expressed in the midbrain, showing heterogeneous regional patterns (Figures 4a–c, 5a–c, and 6a–c). αNrxn2 mRNA was predominant in the Edinger-Westphal nucleus (Figure 4b) and the dorsal raphe nucleus (Figure 5b). while αNrxn3 mRNA was predominant in the substantia nigra pars compacta, ventral tegmental area, Nucleus of Darkschewitsch, and lateral part of the dorsal raphe nucleus (Figures 4c and 5c). Sparse cells within the inferior colliculus expressed αNrxn3 mRNA at high levels (Figure 6c). Expression levels of three βNrxn isoforms were generally low or undetectable in the midbrain (Figures 4d–f, 5d–f, and 6d–f), but βNrxn3 mRNA was detected in some sparse cells in the inferior colliculus (Figure 6f) and other midbrain regions.
Figure 6.
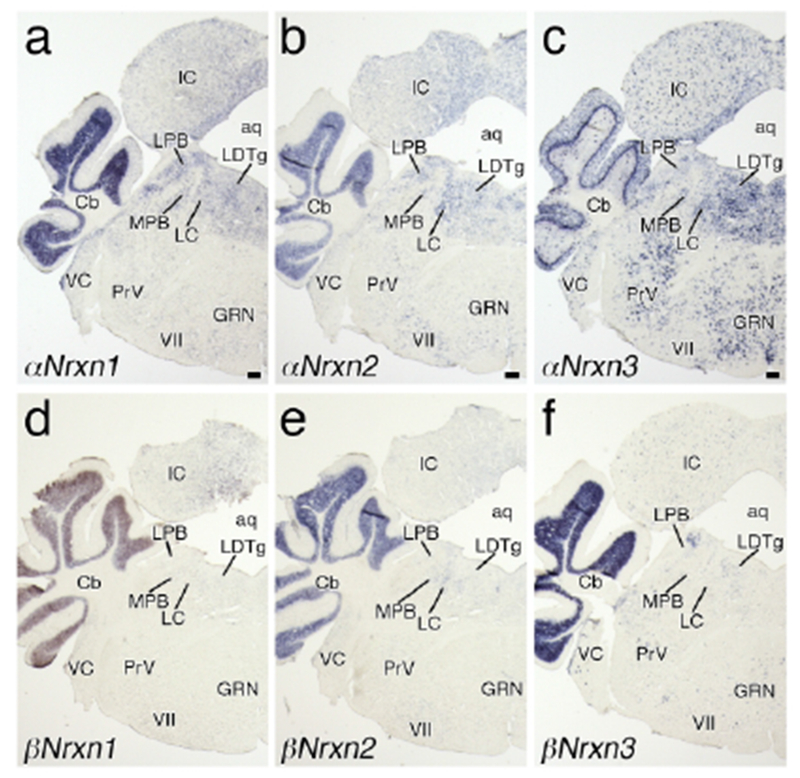
Region-specific expression of Nrxn mRNAs in the anterior medulla. Coronal views of chromogenic hybridization signals for αNrxn1 (a), αNrxn2 (b), αNrxn3 (c), βNrxn1 (d), βNrxn2 (e), and βNrxn3 (f) mRNAs in the mouse brain. For abbreviations, see list. Scale bars, 200 μm.
2.4. Pons
In the pons, αNrxn3 mRNA was predominant in many nuclei (Figures 5c and 6c), with the strongest signals in the nucleus of the trapezoid body (Figure 5c) and the lowest signals in the facial nucleus (Figure 6c). αNrxn1 and αNrxn2 mRNAs were expressed at low to moderate levels in the pontine tegmentum, including the lateral and medial parabrachial nuclei, locus coeruleus (LC), and laterodorsal tegmental nucleus (Figure 6a, b). In addition, αNrxn2 mRNA expression was moderately expressed in the facial nucleus (Figure 6b). Three βNrxn mRNAs were generally low in the pons, except for moderate expression of βNrxn2 mRNA in the LC (Figure 6e) and βNrxn3 mRNA in the dorsal part of the lateral parabrachial nucleus (Figure 6f). Cells expressing βNrxn3 mRNA were scattered over the pons, such as in the ventral cochlear nucleus and principal sensory nucleus of trigeminal nerve (Figure 6f).
2.5. Medulla
Like in the pons, αNrxn3 mRNA was most prevalent in the medulla (Figures 6c and 7c). However, αNrxn3 mRNA was not detected in the inferior olivary complex, where αNrxn1, αNrxn2, βNrxn1, and βNrxn2 mRNAs were weakly expressed (Figure 7a, b, d, e). The nucleus of the tractus solitarius (NTS) and dorsal motor nucleus of vagus nerve expressed high levels of all three αNrxn isoforms and low to moderate levels of all three βNrxn isoforms (Figure 7a–f).
Figure 7.
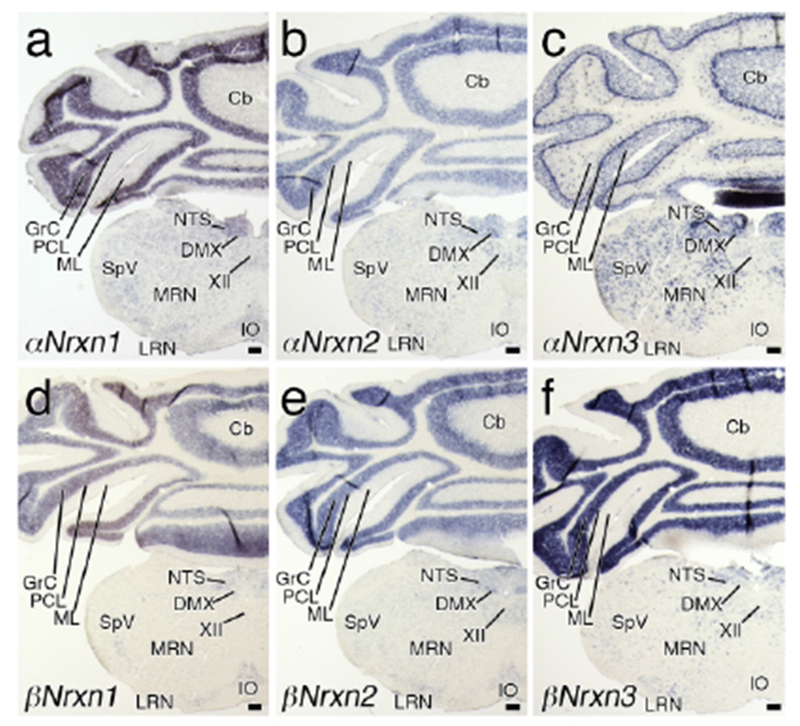
Region-specific expression of Nrxn mRNAs in the posterior medulla. Coronal views of chromogenic hybridization signals for αNrxn1 (a), αNrxn2 (b), αNrxn3 (c), βNrxn1 (d), βNrxn2 (e), and βNrxn3 (f) mRNAs in the mouse brain. For abbreviations, see list. Scale bars, 200 μm.
2.6. Cerebellum
In the cerebellar cortex, all six Nrxn isoforms were highly expressed in the granule cell layer, where αNrxn3 mRNA was restricted to a few scattered cells and the rest were expressed diffusely (Figures 6 and 7). In the molecular layer, αNrxn3 mRNA was expressed predominantly in scattered cells (Figures 6c and 7c). Various isoforms were less expressed in the Purkinje cell layer, with the highest level for αNrxn3 mRNA.
3. Cell type-specific expression of Nrxn isoforms
To address the type of cells expressing each Nrxn isoform, we employed double FISH for Nrxns and cellular markers, and measured the fluorescent intensity of each Nrxn isoform in given types of cells.
3.1. Glutamatergic and GABAergic neurons
Using Gad1 mRNA as a neuronal marker of GABAergic neurons, we measured the signal intensity of Gad1(+) GABAergic and Gad1(−) glutamatergic neurons in the primary somatosensory cortex (Figures 8 and 9), hippocampus (Figures 10 and 11), and cerebellar cortex (Figures 12 and 13). Indeed, in the primary somatosensory cortex, cells that had large and DAPI-pale nuclei expressed either Vglutt which is selectively expressed in cortical glutamatergic neurons (arrowheads in Figure 8a), or Gad1 (arrowheads in Figure 8b) mRNA, thus being assigned as glutamatergic and GABAergic neurons, respectively. Cells having small and DAPI-dark nuclei without Vglut1 or Gad1 mRNA are likely glial cells (arrows in Figure 8a, b; See Materials and Methods) (Yu et al., 2015). The mean intensity in each neuronal layer of the primary somatosensory cortex was calculated for glutamatergic and GABAergic neurons (Figures 8c–h and 9a–f). The mean fluorescent intensity in glutamatergic neurons (blue dots in Figures 8d, f, h and 9b, d, f) was comparable to optical intensity by chromogenic in situ hybridization (Figure 3a–f). Compared to glutamatergic neurons, Nrxn expression in GABAergic neurons exhibited different laminar patterns (red dots in Figures 8d, f, h and 9b, d, f). Significantly higher levels in GABAergic neurons than in glutamatergic neurons in the same layer were noted for αNrxn2 mRNA in layers 4 and 6 (Figure 8e, f), αNrxn3 mRNA in layers 4–6 (Figure 8g, h), βNrxn1 mRNA in layer 6 (Figure 9a, b). βNrxn2 mRNA in layers 4 and 6 (Figure 9c, d). and βNrxn3 mRNA in layers 2/3, 5, and 6 (Figure 9e, f). Conversely, significantly lower levels were noted for Nrxn1 mRNA in layers 4 and 5 (Figure 8c,d) and βNrxn1 mRNA in layers 2-4 (Figure 9a,b).
Figure 9.
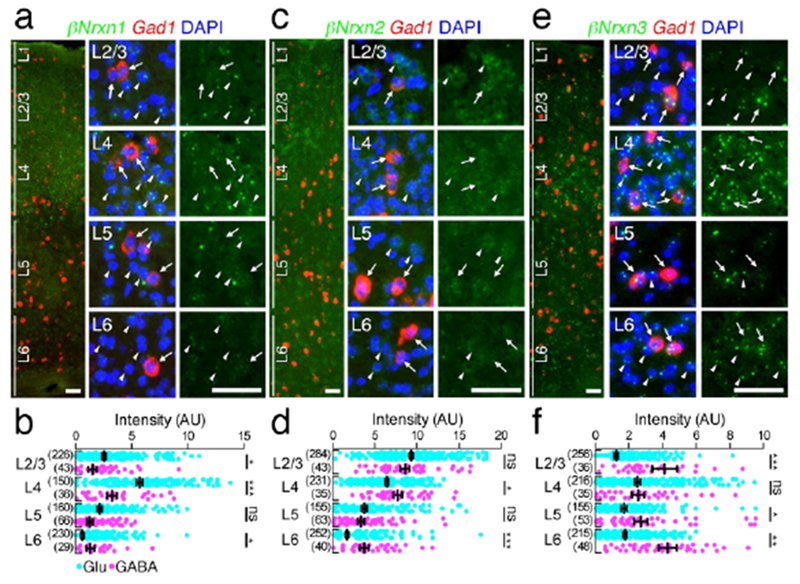
Layer-specific expression of βNrxn mRNAs in the primary somatosensory neocortex. (a, c, e) Double FISH for βNrxn1 (a), βNrxn2 (c), or βNrxn3 (e) and Gad1 mRNAs showing distinct laminar-specific patterns of Nrxn mRNAs (green) between Gad1(+) GABAergic (red, arrows) and Gad1(−) glutamatergic (arrowheads) neurons. The left panel presents a low power-magnified image including the entire cortical layers, and the middle and right panels present high power-magnified images of layers 2/3, 4, 5, and 6 (L2/3, L4, L5, and L6) in order from the top. Note that the signals for Nrxns in GABAergic neurons tend to be variable. Nuclei were stained with DAPI (blue). (b, d, f) Summary scatter plots for βNrxn1 (b), βNrxn2 (d), or βNrxn3 (f) mRNA in glutamatergic (aqua) and GABAergic (magenta) neurons. The numbers of cells analyzed are indicated in the parenthesis to the left of each column. Data are represented as means ± SEM. ns, not significant; * P < 0.05; ** P < 0,01; *** P < 0,001 (Mann-Whitney test). Scale bars, 50 μm.
Figure 10.
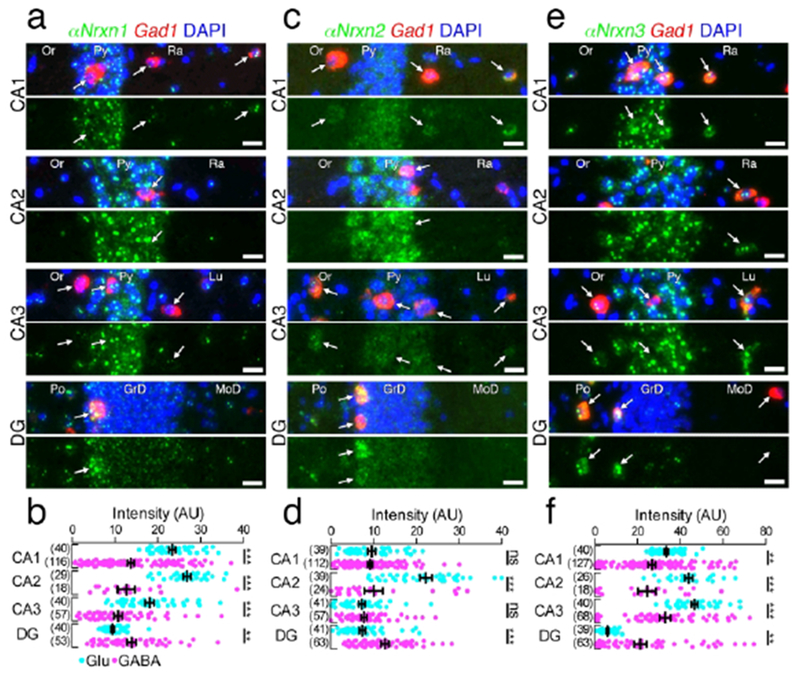
Hippocampal subregion-specific expression of αNrxn mRNAs. (a, c, e) Double FISH for αNrxn1 (a), αNrxn2 (c), or αNrxn3 (e) and Gad1 mRNAs in the hippocampus showing different subregion-specific patterns of Nrxn mRNAs (green) between Gad1(+) GABAergic (red, arrows) and Gad1(−) glutamatergic neurons. The four pairs of panels show the CA1, CA2, CA3, and dentate gyrus (DG) in order from the top. Note that the signal intensity in individual GABAergic neurons is variable, compared with that in glutamatergic neurons. Nuclei were stained with DAPI (blue). Or, stratum oriens; Py, Pyramidal cell layer; Ra, stratum radiatum; Lu, stratum lucidum; Po, polymorphic layer; GrD, granule cell layer; MoD, molecular layer. (b, d, f) Summary scatter plots for αNrxn1 (b), αNrxn2 (d), or αNrxn3 (f) mRNA in glutamatergic (aqua) and GABAergic (magenta) neurons. The number in the parentheses next to each column indicates the number of cells analyzed. Data are represented as means ± SEM. ns, not significant; * P < 0.05; ** P < 0.01; *** P < 0.001 (Man-Whitney test). Scale bars, 20 μm.
Figure 11.
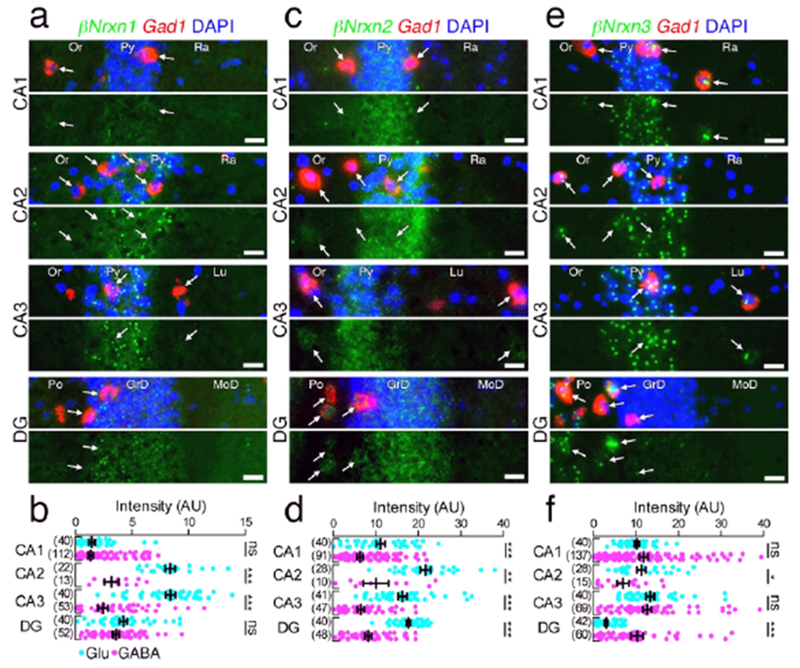
Hippocampal subregion-specific expression of βNrxn mRNAs. (a, c, e) Double FISH for βNrxn1 (a), βNrxn2 (c), or βNrxn3 (e) and Gad1 mRNAs in the hippocampus showing different subregion-specific expression patterns of Nrxn mRNAs (green) between Gad1(+) GABAergic (red, arrows) and Gad1(−) glutamatergic neurons. The four pairs of panels show the CA1, CA2, CA3, and dentate gyrus (DG) in order from the top. Note that the signal intensity in individual GABAergic neurons is variable, compared with that in glutamatergic neurons. Nuclei were stained with DAPI (blue). Or, stratum oriens; Py, Pyramidal cell layer; Ra, stratum radiatum; Lu, stratum lucidum; Po, polymorphic layer; GrD, granule cell layer; MoD, molecular layer. (b, d, f) Summary scatter plots for βNrxn1 (b), βNrxn2 (d), or βNrxn3 (f) mRNA in glutamatergic (agua) and GABAergic (magenta) neurons. The number in the parentheses next to each column indicates the number of cells analyzed. Data are represented as means ± SEM. ns, not significant; * P < 0,05; ** P < 0,01; *** P < 0,001 (Man-Whitney test). Scale bars, 20 μm.
Figure 12.
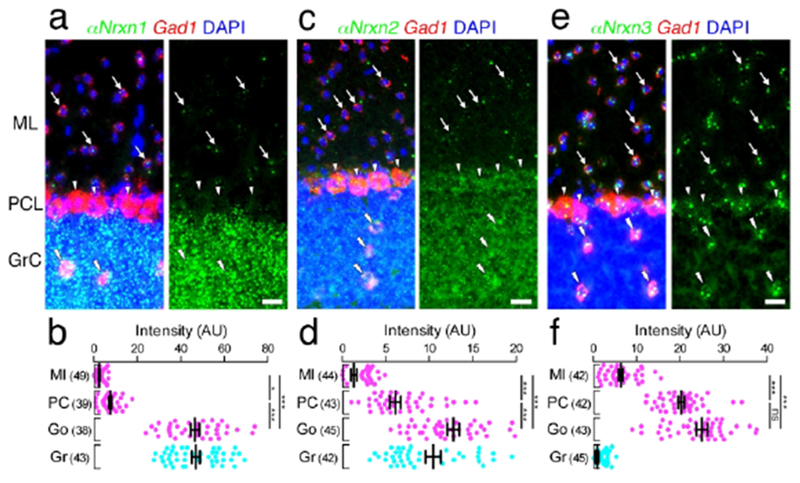
Cell type-dependent expression of αNrxn mRNAs in the cerebellar cortex. (a, c, e, g, i, k) Double FISH for αNrxn1 (a), αNrxn2 (c), or αNrxn3 (e) and Gad1 mRNAs in the cerebellar cortex showing different expression patterns of Nrxn mRNAs (green) in Gad1 mRNA (red)-labeled molecular layer interneurons (arrows), Purkinje cells (arrowheads), and Golgi cells (double arrowheads) and Gad1 mRNA-unlabeled granule cells. Nuclei were stained with DAPI (blue). (b, d, f) Summary scatter plots for αNrxn1 (b), αNrxn2 (d), or αNrxn3 (f) mRNA in molecular layer interneurons (magenta, Ml), Purkinje cells (magenta, PC), Golgi cells (magenta, Go), and granule cells (agua, Gr). The number in the parentheses next to each column indicates the number of cells analyzed. Data are represented as means ± SEM. ns, not significant; * P < 0.05; ** P < 0.01; *** P < 0.001 (Kruskal-Wallis test with post hoc Dunn’s test). Scale bars, 20 μm.
Figure 13.
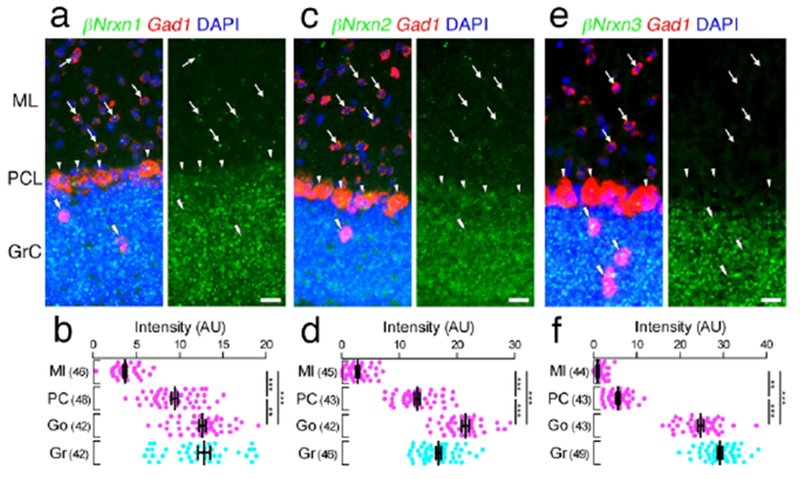
Cell type-dependent expression of βNrxn mRNAs in the cerebellar cortex. (a, c, e) Double FISH for βNrxn1 (a), βNrxn2 (c), or βNrxn3 (e) and Gad1 mRNAs in the cerebellar cortex showing different expression patterns of Nrxn mRNAs (green) in Gad1 mRNA (red)-labeled molecular layer interneurons (arrows), Purkinje cells (arrowheads), and Golgi cells (double arrowheads) and Gad1 mRNA-unlabeled granule cells. Nuclei were stained with DAPI (blue). (b, d, f) Summary scatter plots for βNrxn1 (b), βNrxn2 (d), or βNrxn3 (f) mRNA in molecular layer interneurons (magenta, MI), Purkinje cells (magenta, PC), Golgi cells (magenta, Go), and granule cells (agua, Gr). The number in the parentheses next to each column indicates the number of cells analyzed. Data are represented as means ± SEM. ns, not significant; * P < 0.05; ** P < 0,01; *** P < 0,001 (Kruskal-Wallis test with post hoc Dunn’s test). Scale bars, 20 μm.
In the dorsal hippocampus, the pattern of mean Nrxn fluorescent intensity in Gad1(−) glutamatergic neurons among different subregions (Figures 10 and 11) was generally comparable to that of chromogenic signals (Figure 3a–f). In the CA1-CA3 subregions, GABAergic neurons tended to be significantly lower in Nrxn mRNA expression than glutamatergic neurons. In the dentate gyrus, by contrast, GABAergic neurons expressed significantly higher levels for all three αNrxn and βNrxn3 mRNAs (Figure 11a, b).
In the cerebellar cortex, distinct neuron type-dependent expression, as suggested from distinct layer labeling and sparse vs. diffuse labeling (Figures 6 and 7), was substantiated by double FISH (Figures 12 and 13). GABAergic interneurons in the molecular layer mainly expressed αNrxn3 mRNA, with additional very low signals for αNrxn1, αNrxn2, βNrxn1, and βNrxn2 mRNAs. GABAergic Purkinje cells expressed αNrxn3 mRNA at the highest level, and more or less expressed the other isoforms. On the other hand, all six Nrxn isoforms were highly expressed in GABAergic Golgi cells. Granule cells highly expressed all six Nrxn isoforms except for αNrxn3 mRNA.
3.2. Catecholaminergic neurons
We also examined the expression patterns of Nrxn mRNAs in catecholaminergic neurons including dopaminergic (DA) neurons in the midbrain and noradrenergic (NA) neurons in the LC and NTS (Figures 14 and 15). Catecholaminergic neurons were identified as cells positive for tyrosine hydroxylase (Th) mRNA, the rate-limiting enzyme for catecholamine biosynthesis. αNrxn1 mRNA was expressed at higher levels in midbrain DA neurons and NTS NA neurons than in LC NA neurons (Figure 14a, b). In contrast, αNrxn2 mRNA was expressed at higher levels in both NA neurons than in midbrain DA neurons (Figure 14c, d). αNrxn3 mRNA expression is the highest in midbrain DA neurons (Figure 14e, f). βNrxn1 mRNA was hardly detected in the three catecholaminergic neurons analyzed (Figure 15a, b). βNrxn2 and βNrxn3 mRNAs were expressed at the highest level in locus coeruleus NA neurons and midbrain DA neurons, respectively (Figure 15c–f). Taken together, our double FISH data demonstrate that Nrxn expression in given neural regions is highly variable depending on neuron types and subregions, but that there is no specific or preferential assignment of given Nrxn isoforms to neurochemical types of neurons.
4. Non-neuronal expression of αNrxn1 and αNrxn2 mRNA
In our double FISH data, we encountered signals for αNrxn1 and αNrxn2 mRNA in Gad1(−) putative glial cells in the hippocampus and cortex. Therefore, we first addressed the expression of six Nrxn mRNAs in non-neuronal cells in the hippocampal CA1 region (Figure 16a–f) and somatosensory cortex layers 2/3 (Figure 17a–f). Non-neuronal Nrxn signal intensities were normalized to the neuronal expression. Neuronal and non-neuronal cells were identified as pyramidal neurons and Gad1(−) neuropil cells in the hippocampus, and the cells with large and pale DAPI+ nuclei and small and dark DAPI+ nuclei in the somatosensory cortex, respectively. Prominent expression of αNrxn1 and αNrxn2 was found in nonneuronal cells in both brain areas (Figures 16g and 17g). Next, we performed double FISH for αNrxn1 and αNrxn2, and glial markers: glutamate/aspartate transporter (Glast) for astrocytes, proteolipid protein (Plp) for oligodendrocytes, and purinergic receptor P2Y (P2ry12) for microglia to identify the cell type expressing αNrxn1 and αNrxn2 (Figures 16h–o and 17h–o). Signals for αNrxn1 mRNA frequently overlapped with those for Glast mRNA, but not Plp or P2ny12 mRNA, in the hippocampal CA1 (Figure 16h–k), somatosensory cortex (Figure 17h–k), and other brain regions examined (data not shown), thus demonstrating αNrxn1 expression in astrocytes. In contrast, signals for αNrxn2 mRNA overlapped with those for Glast or Plp, but not P2ny12 mRNA, in the hippocampal CA1 (Figure 16l–o), somatosensory cortex (Figure 17l–o) and other brain regions examined (data not shown), thus revealing αNrxn2 expression in astrocytes and oligodendrocytes.
5. Gene expression of trans-synaptic Nrxn binding proteins in the brain
Both diverse expression patterns of Nrxn in the brain and the variety of postsynaptic Nrxn binding partners should generate massive combinations of trans-synaptic protein interactions (Sudhof, 2017). Importantly, the expression of Nrxns and their trans-synaptic binding partners have not been well compared. Therefore, we studied the expression of the genes encoding the major trans-synaptic Nrxn binding partners, Nlgn1-3 (Ichtchenko et al., 1995: Ichtchenko et al., 1996), Lnntm1-4 (de Wit et al., 2009: Ko et al., 2009) and Adanl1-3 (Latrophilin1-3) (Boucard et al., 2012), in the brain using chromogenic in situ hybridization (Figure 18a–j). For this analysis, cRNA probes were designed for unigue coding and/or 5’-UTR region of each Nlgn, Lnntm and Adgnl isoform (total, 11 probes). No signals were found using the corresponding sense probes (Figure 18a–j, insets), indicating the specificity of hybridization signals.
Figure 18.
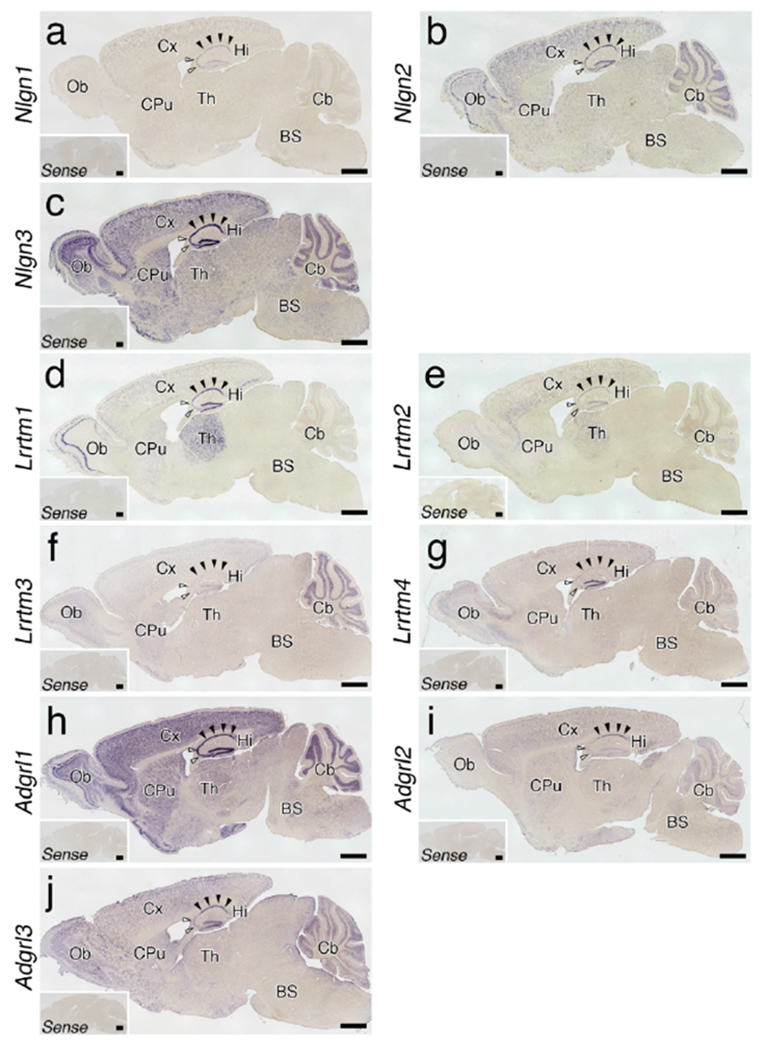
Expression of Nrxn binding partners in the brain. (a-j) Whole brain sagittal views of chromogenic hybridization signals for Nlgn1-3 (a-c), Lrrtm1-3 (d-f) and Adgrl-4 (g-j) mRNAs. Insets showing no hybridization signals with sense cRNA probes. Filled and open arrows indicate the CA1 and CA3 pyramidal cell layers, respectively. For abbreviations, see list. Scale bars, 1 mm
5.1. Nlgns
Nlgn1 mRNA expression was weak throughout the brain with the highest signals in the hippocampus (Figure 18a). In contrast, we observed much stronger signals for Nlgn2 and Nlgn3 mRNAs. Striking expression of Nlgn2 mRNA was noted in not only the hippocampus, but also olfactory mitral cell layer and cerebellar Purkinje cell layer (Figure 18b). Nlgn3 mRNA was ubiquitously expressed throughout the brain with peak signal levels visualized in the hippocampus (Figure 18c).
5.2. Lrrtms
Lrrtm1 mRNA displayed prominent expression in the hippocampus, neocortex, thalamus, and olfactory bulb (Figure 18d). Similarly, Lrrtm2 mRNA expression was discernible in the hippocampus, neocortex, and thalamus (Figure 18e). The hippocampus exhibited similar expression patterns of Lrrtm1 and Lrrtm2 mRNAs with higher intensity in the CA1 and dentate gyrus than in the CA3. In contrast, Lrrtm3 and Lrrtm4 mRNAs were predominant in the cerebellum (Figure 18f) and dentate gyrus (Figure 18g), respectively.
5.3. Adgrls (Latrophilins)
Adgrl1 mRNA was widely and richly expressed throughout the brain (Figure 18h). Adgrl2 and Adgrl3 mRNAs were also expressed ubiquitously (Figure 18i, j). However, the signal intensities for Adgrl2 and Adgrl3 mRNAs were much weaker than that for Adgrl1 mRNA. Adgrl2 mRNA showed peak intensity in the hippocampal CA1 region (Figure 18i), while Adgrl3 mRNA was highly expressed in the hippocampal CA1 and dentate gyrus regions (Figure 18j).
DISCUSSION
In this study, Nrxn mRNA expression was systematically mapped by in situ hybridization in the adult mouse brain. Consistent with previous reports (Puschel and Betz, 1995; Ullrich et al., 1995; Gorecki et al., 1999; Schreiner et al., 2014; Treutlein et al., 2014), we confirmed highly diverse expression profiles of Nrxns throughout the brain. Although the translational regulation of Nrxn proteins should be considered, our brain-wide and detailed expression analysis revealed distinct regional and cellular expression patterns of the six principal isoforms of Nrxns at the mRNA level.
First, we found cortical layer- or subregion-dependent differences in Nrxn mRNA expression in glutamatergic and GABAergic neurons. In the somatosensory cortex, the mean signal intensities for αNrxn2, αNrxn3, and βNrxn3 mRNAs were significantly higher in GABAergic neurons than in glutamatergic neurons (Figures 8f, h and 9f). In the hippocampus, the mean signal intensities for all six isoforms were significantly lower in GABAergic neurons than in glutamatergic neurons (Figures 10b, d, f and 11b, d, f). This difference may underlie to some extent brain region-specific phenotypes on synaptic transmission in Nlgn3 KO or Nlgn3 R451C mice, which lack or decrease postsynaptic expression of Nlgn3, one of the binding partners of Nrxn proteins (Tabuchi et al., 2007; Etherton et al., 2011). In addition, the variance of the signal intensities of Nrxn mRNAs appeared high in cortical GABAergic neurons (Figures 8–11). This is supported by the notion that distinct subsets of inhibitory neurons in cortical structures differ in their expression patterns of Nrxn mRNAs (Fuccillo et al., 2015; Chen et al., 2017). In particular, we found some inhibitory neurons with high signals for αNrxn2 mRNA in the deep cortical layer (Figure 8e, f). αNrxn2 can selectively induce inhibitory presynaptic differentiation via its interaction with postsynaptic lgSF21, which is expressed in the deep layer neurons (Tanabe et al., 2017). This molecular interaction could contribute to synapse specification at a subset of inhibitory synapses.
Next, we found unique expression of Nrxn mRNAs in the hippocampus. Consistent with previous studies (Ullrich et al., 1995; Nguyen et al., 2016), the CA1 pyramidal cell layer highly expressed mRNAs for all the isoforms except βNrxn1 (Figures 3 and 4). The CA2 and CA3 pyramidal layers expressed all Nrxn mRNAs, however, αNrxn2 was preferentially expressed in the CA2 region (Figures 1c, d, k and 3b) and βNrxn3 had septotemporal gradient expression in the CA3 region (Figures 1k, I, 3f, and 4f). Furthermore, the dentate gyrus had a septotemporal gradient of βNrxn3 (Figures 3f and 4f) mRNA expression, and its upstream entorhinal cortex also had a rostrocaudal gradient of αNrxn3 (Figures 4c and 5c) and βNrxn3 (Figures 4f and 5f) mRNA expressions. Different parts of the entorhinal cortex project to different septotemporal levels of the dentate gyrus (Amaral and Pierre, 2006). The rostromedial entorhinal cortex, which expresses both αNrxn3 and βNrxn3 mRNAs at high levels, projects to the temporal half of the dentate gyrus, which highly expresses βNrxn3 mRNA. In contrast, the caudolateral entorhinal cortex, which expresses αNrxn3 and αNrxn3 mRNAs at low levels, projects to the septal half, where βNrxn3 mRNA expression is low. This coincidence of the topographic projections and Nrxn3 expression between the entorhinal cortex and dentate gyrus could underlie a unique function of Nrxn3 in memory formation. Furthermore, a specific splicing variant of Nrxn3 protein can recruit postsynaptic kainate receptors via C1ql2/3 at dentate gyrus-CA3 synapses (Matsuda et al., 2016). Although we did not map splicing variants of Nrxn3 gene in this study, our data raise a possibility of topographical differences in the postsynaptic recruitment of kainate receptors.
We also investigated the region- and cell type- dependent expression of Nrxn mRNAs in catecholaminergic neurons including midbrain DA neurons and LC and NTS NA neurons (Figures 14 and 15). Similar to glutamatergic and GABAergic neurons, midbrain DA neurons expressed multiple Nrxn isoforms, consistent with Nrxn protein expression at striatal DA synapses formed by midbrain DA neurons (Uchigashima et al., 2016). In addition, we found Nrxn mRNA expressions with different combinations in LC and NTS NA neurons. Different expression patterns of Nrxn mRNAs among catecholaminergic neurons may provide distinct molecular bases to control the release of each catecholamine. Indeed, pan-Nrxn deletion causes different phenotypes in synaptic transmissions from distinct neurons with their own repertories of Nrxn mRNAs (Chen et al., 2017). Therefore, region- and cell type-dependent expression patterns of Nrxn mRNAs would provide the molecular-anatomical basis for the diversity of synapse specification at various types of synapses.
We found a unique expression of the Nrxn3 gene in the auditory system. Several auditory relay stations, including the ventral cochlear nucleus, nucleus of trapezoid body, and inferior colliculus, displayed high expressions of αNrxn3, βNrxn3, or both mRNAs (Figures 5c and 6c, f). The medial geniculate nucleus, which is the thalamic nucleus relaying auditory information to the neocortex, highly expressed both αNrxn3 and βNrxn3 mRNAs as well as other Nrxn isoforms (Figure 4a–f). Furthermore, the primary auditory cortex had a unique expression pattern of βNrxn3 mRNA. βNrxn3 mRNA was expressed with a peak density in layers 2/3 as well as layer 4 region (Figures 3f and 4f), while the primary somatosensory cortex exhibited peak expression in layer 4 only (Figure 3f). Above all, the predominant expression of αNrxn3 and βNrxn3 mRNAs may suggest the importance of Nrxn3 in auditory function. Indeed, a patient with a rare mutation of the Nrxn3 gene exhibited difficulty in auditory processing (Vaags et al., 2012).
In the olfactory system, all isoforms of Nrxn mRNAs were highly expressed in mitral cell layer neurons (Figure 2a–f), the second order neurons receiving input from olfactory cells, and in pyramidal neurons in the piriform cortex (Figures 2g–l and 3), which are the third order neurons receiving input from mitral cell layer neurons. We also noted striking expression of αNrxn mRNA in the granule cells of the olfactory bulb (Figure 2a–c), and of αNrxn2, αNrxn3, βNrxn1, and βNrxn3 mRNAs in the island of Calleja (Figure 2h, i, l), which is anatomically associated with the piriform cortex (Fallon et al., 1978). Interestingly, some ASP patients exhibit olfactory deficits (Galle et al., 2013). αNrxn3 KO mice have impaired GABAergic synaptic transmission in the olfactory bulb, leading to deficits in olfactory function (Aoto et al., 2015). Interestingly, both αNrxn1 and αNrxn2 KO mice, which show autism-related behaviors, have been reported to have intact olfaction, highlighting the importance of Nrxn3 in olfaction (Grayton et al., 2013; Dachtler et al., 2014).
Some nuclei in the brainstem share similar Nrxn mRNA expression patterns. αNrxn2 mRNA was remarkable in facial nucleus (Figure 6b) and hypoglossal nucleus (Figure 7b), consistent with the requirement of αNrxns in high fidelity synaptic transmission at mouse neuromuscular junctions and relay synapses (Sons et al., 2006). Our findings suggest that neurons associated with particular functions could partly share a similar expression profile with the six principal isoforms of Nrxn mRNAs.
It is important to note that we did not find any neuronal populations that express only a single Nrxn isoform. This provides support for the redundancy of Nrxn proteins, which could reduce deleterious conseguences of synaptic dysfunction if one of the co-expressed Nrxns has detrimental mutations. We identified brain regions that express all six Nrxn isoforms, including olfactory bulb mitral cell layer, hippocampal CA3 and piriform cortex pyramidal cell layers. The expression of all Nrxns were particularly high in piriform cortex. Piriform cortex is the first cortical area receiving olfactory information and contains strong associational circuits (Hagiwara et al., 2012). Expression of multiple Nrxn isoforms may be important to maintain the connectivity of this high-fidelity circuit.
We identified αNrxn1 as the most ubiguitous Nrxn isoform in any brain region. Importantly, αNrxn1 mRNA was expressed in neuronal cell types (glutamatergic, GABAergic, catecholaminergic neurons) and astrocytes. This may explain the strong association of αNrxn1 mutations with neurodevelopmental disorders, including ASD, ADHD, intellectual disability, schizophrenia, and Tourette syndrome (Sebat et al., 2007; Szatmari et al., 2007; Kim et al., 2008; Yan et al., 2008; Zahir et al., 2008; Ching et al., 2010; Clarke et al., 2012; Vinas-Jornet et al., 2014; Autism Spectrum Disorders Working Group of The Psychiatric Genomics, 2017).
We found the non-neuronal expressions of αNrxn1 and αNrxn2. It is important to identify the cell type(s) that interacts with αNrxn1 and αNrxn2 mRNA-expressing astrocytes. It has been reported that Nlgns expressed in astrocytes control synaptogenesis and astrocyte morphogenesis (Stogsdill et al., 2017). It is intriguing to address the role of Nlgn-Nrxn protein interaction between astrocytes. Addressing the involvement of Nrxns on gliotransmission or exocytotic release of neurotransmitters and factors from astrocytes to neurons should help to elucidate the role of Nrxns in astrocytes (Parpura and Zorec, 2010). We found αNrxn2 as a major Nrxn mRNA in oligodenrtocytes (Figures 16 m, o and 17m, o). αNrxn2 protein expression was reported in oligodendrocyte-like cells in the early developing human cerebral cortex (Harkin et al., 2017). It has been suggested that Nlgn3 expressed in oligodendrocytes and axonal Nrxn protein interactions are important for oligodendrocyte differentiation (Proctor et al., 2015). Further studies addressing the role of αNrxn2 in oligodendrocyte development and function are reguired.
Lastly, we examined the mRNA expression patterns of three gene families, Nlgns, Lrrtms and Adgrls, that encode major Nrxn binding proteins, and compared their brain region-specific expression patterns to that of Nrxns. All three gene families had diverse expression profiles throughout the brain (Figure 18). In particular, hippocampal CA1 pyramidal neurons, which receive excitatory inputs from CA3 pyramidal neurons, expressed most of these genes except Lrrtm3 and Lrrtm4, likely contributing to numerous combinations of trans-synaptic interactions. In contrast, CA3 pyramidal neurons, which form associational circuits with each other, expressed only Nlgns and Adgrl1 at high levels. Considering the expression of multiple Nrxn isoforms in CA3 pyramidal cells, the differential expression of Nrxn binding partners in postsynaptic neurons could underlie the distinct distributions of different Nrxn proteins at presynaptic terminals, thus providing unique region- and cell type-specific connections important for synaptic transmission (Sudhof, 2017).
Here we used chromogenic and fluorescence in situ hybridization to characterize the expression pattern of Neurexin (Nrxn) isoforms. While each Nrxn isoform displayed a unique expression profile in different regions and cell types, αNrxn1 and αNrxn2 mRNAs were interestingly expressed in non-neuronal cells, including astrocytes and oligodendrocytes. Nrxn postsynaptic binding partners, such as Neuroligins and Latrophilins, were also diversely expressed throughout the mouse brain, emphasizing the numerous combinations of trans-synaptic interactions that can occur between these molecules.
ACKNOWLEDGEMENT
We thank Dr. Paul D. Gardner for valuable discussions and Dr. Kenji Tanaka for a gift of a Nlgn3 probe. This work was supported by grants from the Riccio Fund for Neuroscience (to K.F.), the Whitehall Foundation (to K.F.), National Institutes of Health Grant (R01NS085215 to K.F.), Grants-in-Aid for Scientific Research (15K06732 to M.U.), and The Naito Foundation (to M.U.). The authors thank Ms. Naoe Watanabe for her skillful technical assistance.
ABBREVIATIONS
- 3v:
Third ventricle
- A1:
Primary auditory cortex
- aq:
Cerebral aqueduct
- Arc:
Arcuate nucleus
- BA:
Basal nucleus of amygdala
- BS:
Brainstem
- CA:
Central nucleus of amygdala
- CA1:
Field CA1 of hippocampus
- CA2:
Field CA2 of hippocampus
- CA3:
Field CA3 of hippocampus
- Cb:
Cerebellum
- Cl:
Claustrum
- CM:
Centromedian thalamic nucleus
- CPu:
Caudate-putamen
- Cx:
Cortex
- DG:
Dentate gyrus
- DLL:
Dorsal nucleus of lateral lemniscus
- DMH:
Dorsomedial hypothalamus
- DMX:
Dorsal motor nucleus of vagus nerve
- DRD:
Dorsal part of dorsal raphe nucleus
- DRL:
Lateral part of dorsal raphe nucleus
- DRV:
Ventral part of dorsal raphe nucleus
- Epl:
External plexiform layer of olfactory bulb
- EW:
Edinger-Westphal nucleus
- Gl:
Glomerular layer of olfactory bulb
- GrC:
Granule cell layer of cerebellum
- GrO:
Granule cell layer of olfactory bulb
- GRN:
Gigantocellular reticular nucleus
- Hi:
Hippocampus
- IC:
Inferior colliculus
- ICj:
Islands of Calleja
- IL:
Infralimbic cortex
- IO:
Inferior olivary complex
- IPN:
Interpeduncular nucleus
- L1:
Cortical layer 1
- L2/3:
Cortical layers 2/3
- L4:
Cortical layer 4
- L5:
Cortical layer 5
- L6:
Cortical layer 6
- LA:
Lateral nucleus of amygdala
- LC:
Locus coeruleus
- LD:
Laterodorsal thalamic nucleus
- LDTg:
Laterodorsal tegmental nucleus
- LEnt:
Lateral entorhinal cortex
- LH:
Lateral hypothalamus
- LHb:
Lateral habenula
- LP:
Lateral posterior thalamic nucleus
- LPB:
Lateral parabrachial nucleus
- LRN:
Lateral reticular nucleus
- LS:
Lateral septal nucleus
- M1:
Primary motor cortex
- MD:
Mediodorsal thalamic nucleus
- MEnt:
Medial entorhinal cortex
- MGN:
Medial geniculate nucleus
- MHb:
Medial habenula
- Mi:
Mitral layer of olfactory bulb
- ML:
Molecular layer of cerebellum
- MPB:
Medial parabrachial nucleus
- MRN:
Medullary reticular nucleus
- NAc:
Nucleus accumbens
- ND:
Nucleus of Darkschewitsch
- NDB:
Nucleus of diagonal band
- NTB:
Nucleus of trapezoid body
- NTS:
nucleus of tractus solitaries
- Ob:
Olfactory bulb
- OT:
Olfactory tubercle
- PAG:
Periaqueductal gray
- PBG:
Parabigeminal nucleus
- PCL:
Purkinje cell layer of cerebellum
- Pir:
Piriform cortex
- PRN:
Pontine reticular nucleus
- PrV:
Principal sensory nucleus of trigeminal nerve
- PrL:
Prelimbic cortex
- PVT:
Paraventricular thalamic nucleus
- RSG:
Retrosplenial granular cortex
- Rt:
Reticular thalamic nucleus
- S1:
Primary somatosensory cortex
- SC:
Superior colliculus
- SNc:
Substantia nigra pars compacta
- SNr:
Substantia nigra pars reticulate
- SOP:
Paraolivary region of superior olivary complex
- SpV:
Spinal nucleus of trigeminal nerve
- STN:
Subthalamic nucleus
- Su:
Subiculum
- Th:
Thalamus
- V1:
Primary visual cortex
- VC:
Ventral cochlear nucleus
- VII:
Facial nucleus
- VMH:
Ventromedial hypothalamus
- VPL:
Ventral posterolateral thalamic nucleus
- VPM:
Ventral posteromedial thalamic nucleus
- VTA:
Ventral tegmental area
- XII:
Hypoglossal nucleus
LITERATURE CITED
- Amaral D, Pierre L. 2006. Hippocampal Neuroanatomy The Hippocampus Book. [Google Scholar]
- Aoto J, Foldy C, Ilcus SM, Tabuchi K, Sudhof TC. 2015. Distinct circuit-dependent functions of presynaptic neurexin-3 at GABAergic and glutamatergic synapses. Nat Neurosci 18(7):997–1007. [DOI] [PMC free article] [PubMed] [Google Scholar]
- Autism Spectrum Disorders Working Group of The Psychiatric Genomics C. 2017. Meta-analysis of GWAS of over 16,000 individuals with autism spectrum disorder highlights a novel locus at 10q24.32 and a significant overlap with schizophrenia. Mol Autism 8:21. [DOI] [PMC free article] [PubMed] [Google Scholar]
- Boucard AA, Chubykin AA, Comoletti D, Taylor P, Sudhof TC. 2005. A splice code for trans-synaptic cell adhesion mediated by binding of neuroligin 1 to alpha- and beta-neurexins. Neuron 48(2):229–236. [DOI] [PubMed] [Google Scholar]
- Boucard AA, Ko J, Sudhof TC. 2012. High affinity neurexin binding to cell adhesion G-protein-coupled receptor CIRL1/latrophilin-1 produces an intercellular adhesion complex. J Biol Chem 287(12):9399–9413. [DOI] [PMC free article] [PubMed] [Google Scholar]
- Chen LY, Jiang M, Zhang B, Gokce O, Sudhof TC. 2017. Conditional Deletion of All Neurexins Defines Diversity of Essential Synaptic Organizer Functions for Neurexins. Neuron 94(3):611–625 e614. [DOI] [PMC free article] [PubMed] [Google Scholar]
- Chih B, Gollan L, Scheiffele P. 2006. Alternative splicing controls selective trans-synaptic interactions of the neuroligin-neurexin complex. Neuron 51(2):171–178. [DOI] [PubMed] [Google Scholar]
- Ching MS, Shen Y, Tan WH, Jeste SS, Morrow EM, Chen X, Mukaddes NM, Yoo SY, Hanson E, Hundley R, Austin C, Becker RE, Berry GT, Driscoll K, Engle EC, Friedman S, Gusella JF, Hisama FM, Irons MB, Lafiosca T, LeClair E, Miller DT, Neessen M, Picker JD, Rappaport L, Rooney CM, Sarco DP, Stoler JM, Walsh CA, Wolff RR, Zhang T, Nasir RH, Wu BL, Children’s Hospital Boston Genotype Phenotype Study G. 2010. Deletions of NRXN1 (neurexin-1) predispose to a wide spectrum of developmental disorders. Am J Med Genet B Neuropsychiatr Genet 153B(4):937–947. [DOI] [PMC free article] [PubMed] [Google Scholar]
- Clarke RA, Lee S, Eapen V. 2012. Pathogenetic model for Tourette syndrome delineates overlap with related neurodevelopmental disorders including Autism. Translational psychiatry 2:e158. [DOI] [PMC free article] [PubMed] [Google Scholar]
- Dachtler J, Glasper J, Cohen RN, Ivorra JL, Swiffen DJ, Jackson AJ, Harte MK, Rodgers RJ, Clapcote SJ. 2014. Deletion of alpha-neurexin II results in autism-related behaviors in mice. Translational psychiatry 4:e484. [DOI] [PMC free article] [PubMed] [Google Scholar]
- de Wit J, Sylwestrak E, O’Sullivan ML, Otto S, Tiglio K, Savas JN, Yates JR 3rd, Comoletti D, Taylor P, Ghosh A 2009. LRRTM2 interacts with Neurexin1 and regulates excitatory synapse formation. Neuron 64(6):799–806. [DOI] [PMC free article] [PubMed] [Google Scholar]
- Etherton MR, Tabuchi K, Sharma M, Ko J, Sudhof TC. 2011. An autism-associated point mutation in the neuroligin cytoplasmic tail selectively impairs AMPA receptor-mediated synaptic transmission in hippocampus. EMBO J 30(14):2908–2919. [DOI] [PMC free article] [PubMed] [Google Scholar]
- Fallon JH, Riley JN, Sipe JC, Moore RY. 1978. The islands of Calleja: organization and connections. J Comp Neurol 181(2):375–395. [DOI] [PubMed] [Google Scholar]
- Fuccillo MV, Foldy C, Gokce O, Rothwell PE, Sun GL, Malenka RC, Sudhof TC. 2015. Single-Cell mRNA Profiling Reveals Cell-Type-Specific Expression of Neurexin Isoforms. Neuron 87(2):326–340. [DOI] [PMC free article] [PubMed] [Google Scholar]
- Futai K, Doty CD, Baek B, Ryu J, Sheng M. 2013. Specific trans-synaptic interaction with inhibitory interneuronal neurexin underlies differential ability of neuroligins to induce functional inhibitory synapses. J Neurosci 33(8):3612–3623. [DOI] [PMC free article] [PubMed] [Google Scholar]
- Futai K, Kim MJ, Hashikawa T, Scheiffele P, Sheng M, Hayashi Y. 2007. Retrograde modulation of presynaptic release probability through signaling mediated by PSD-95-neuroligin. Nat Neurosci 10(2):186–195. [DOI] [PMC free article] [PubMed] [Google Scholar]
- Galle SA, Courchesne V, Mottron L, Frasnelli J. 2013. Olfaction in the autism spectrum. Perception 42(3):341–355. [DOI] [PubMed] [Google Scholar]
- Gonzalez-Lozano MA, Klemmer P, Gebuis T, Hassan C, van Nierop P, van Kesteren RE, Smit AB, Li KW. 2016. Dynamics of the mouse brain cortical synaptic proteome during postnatal brain development. Scientific reports 6:35456. [DOI] [PMC free article] [PubMed] [Google Scholar]
- Gorecki DC, Szklarczyk A, Lukasiuk K, Kaczmarek L, Simons JP. 1999. Differential seizure-induced and developmental changes of neurexin expression. Mol Cell Neurosci 13(3):218–227. [DOI] [PubMed] [Google Scholar]
- Graf ER, Zhang X, Jin SX, Linhoff MW, Craig AM. 2004. Neurexins induce differentiation of GABA and glutamate postsynaptic specializations via neuroligins. Cell 119(7):1013–1026. [DOI] [PMC free article] [PubMed] [Google Scholar]
- Grayton HM, Missler M, Collier DA, Fernandes C. 2013. Altered social behaviours in neurexin 1alpha knockout mice resemble core symptoms in neurodevelopmental disorders. PLoS One 8(6):e67114. [DOI] [PMC free article] [PubMed] [Google Scholar]
- Hagiwara A, Pal SK, Sato TF, Wienisch M, Murthy VN. 2012. Optophysiological analysis of associational circuits in the olfactory cortex. Frontiers in neural circuits 6:18. [DOI] [PMC free article] [PubMed] [Google Scholar]
- Harkin LF, Lindsay SJ, Xu Y, Alzu’bi A, Ferrara A, Gullon EA, James OG, Clowry GJ. 2017. Neurexins 1-3 Each Have a Distinct Pattern of Expression in the Early Developing Human Cerebral Cortex. Cereb Cortex 27(1):216–232. [DOI] [PMC free article] [PubMed] [Google Scholar]
- Ichtchenko K, Hata Y, Nguyen T, Ullrich B, Missler M, Moomaw C, Sudhof TC. 1995. Neuroligin 1: a splice site-specific ligand for beta-neurexins. Cell 81(3):435–443. [DOI] [PubMed] [Google Scholar]
- Ichtchenko K, Nguyen T, Sudhof TC. 1996. Structures, alternative splicing, and neurexin binding of multiple neuroligins. J Biol Chem 271(5):2676–2682. [DOI] [PubMed] [Google Scholar]
- Kang Y, Zhang X, Dobie F, Wu H, Craig AM. 2008. Induction of GABAergic postsynaptic differentiation by alpha-neurexins. J Biol Chem 283(4):2323–2334. [DOI] [PMC free article] [PubMed] [Google Scholar]
- Kim HG, Kishikawa S, Higgins AW, Seong IS, Donovan DJ, Shen Y, Lally E, Weiss LA, Najm J, Kutsche K, Descartes M, Holt L, Braddock S, Troxell R, Kaplan L, Volkmar F, Klin A, Tsatsanis K, Harris DJ, Noens I, Pauls DL, Daly MJ, MacDonald ME, Morton CC, Quade BJ, Gusella JF. 2008. Disruption of neurexin 1 associated with autism spectrum disorder. Am J Hum Genet 82(1):199–207. [DOI] [PMC free article] [PubMed] [Google Scholar]
- Ko J, Fuccillo MV, Malenka RC, Sudhof TC. 2009. LRRTM2 functions as a neurexin ligand in promoting excitatory synapse formation. Neuron 64(6):791–798. [DOI] [PMC free article] [PubMed] [Google Scholar]
- Koehnke J, Katsamba PS, Ahlsen G, Bahna F, Vendome J, Honig B, Shapiro L, Jin X. 2010. Splice form dependence of beta-neurexin/neuroligin binding interactions. Neuron 67(1):61–74. [DOI] [PMC free article] [PubMed] [Google Scholar]
- Kudo T, Uchigashima M, Miyazaki T, Konno K, Yamasaki M, Yanagawa Y, Minami M, Watanabe M. 2012. Three types of neurochemical projection from the bed nucleus of the stria terminalis to the ventral tegmental area in adult mice. J Neurosci 32(50):18035–18046. [DOI] [PMC free article] [PubMed] [Google Scholar]
- Matsuda K, Budisantoso T, Mitakidis N, Sugaya Y, Miura E, Kakegawa W, Yamasaki M, Konno K, Uchigashima M, Abe M, Watanabe I, Kano M, Watanabe M, Sakimura K, Aricescu AR, Yuzaki M. 2016. Transsynaptic Modulation of Kainate Receptor Functions by C1q-like Proteins. Neuron 90(4):752–767. [DOI] [PubMed] [Google Scholar]
- Missler M, Hammer RE, Sudhof TC. 1998. Neurexophilin binding to alpha-neurexins. A single LNS domain functions as an independently folding ligand-binding unit. J Biol Chem 273(52):34716–34723. [DOI] [PubMed] [Google Scholar]
- Nam CI, Chen L. 2005. Postsynaptic assembly induced by neurexin-neuroligin interaction and neurotransmitter. Proc Natl Acad Sci U S A 102(17):6137–6142. [DOI] [PMC free article] [PubMed] [Google Scholar]
- Nguyen TM, Schreiner D, Xiao L, Traunmuller L, Bornmann C, Scheiffele P. 2016. An alternative splicing switch shapes neurexin repertoires in principal neurons versus interneurons in the mouse hippocampus. eLife 5. [DOI] [PMC free article] [PubMed] [Google Scholar]
- Parpura V, Zorec R. 2010. Gliotransmission: Exocytotic release from astrocytes. Brain research reviews 63(1-2):83–92. [DOI] [PMC free article] [PubMed] [Google Scholar]
- Proctor DT, Stotz SC, Scott LOM, de la Hoz CLR, Poon KWC, Stys PK, Colicos MA. 2015. Axo-glial communication through neurexin-neuroligin signaling regulates myelination and oligodendrocyte differentiation. Glia 63(11):2023–2039. [DOI] [PubMed] [Google Scholar]
- Puschel AW, Betz H. 1995. Neurexins are differentially expressed in the embryonic nervous system of mice. J Neurosci 15(4):2849–2856. [DOI] [PMC free article] [PubMed] [Google Scholar]
- Reissner C, Klose M, Fairless R, Missler M. 2008. Mutational analysis of the neurexin/neuroligin complex reveals essential and regulatory components. Proc Natl Acad Sci U S A 105(39):15124–15129. [DOI] [PMC free article] [PubMed] [Google Scholar]
- RK CY, Merico D, Bookman M, J LH, Thiruvahindrapuram B, Patel RV, Whitney J, Deflaux N, Bingham J, Wang Z, Pellecchia G, Buchanan JA, Walker S, Marshall CR, Uddin M, Zarrei M, Deneault E, D’Abate L, Chan AJ, Koyanagi S, Paton T, Pereira SL, Hoang N, Engchuan W, Higginbotham EJ, Ho K, Lamoureux S, Li W, MacDonald JR, Nalpathamkalam T, Sung WW, Tsoi FJ, Wei J, Xu L, Tasse AM, Kirby E, Van Etten W, Twigger S, Roberts W, Drmic I, Jilderda S, Modi BM, Kellam B, Szego M, Cytrynbaum C, Weksberg R, Zwaigenbaum L, Woodbury-Smith M, Brian J, Senman L, Iaboni A, Doyle-Thomas K, Thompson A, Chrysler C, Leef J, Savion-Lemieux T, Smith IM, Liu X, Nicolson R, Seifer V, Fedele A, Cook EH, Dager S, Estes A, Gallagher L, Malow BA, Parr JR, Spence SJ, Vorstman J, Frey BJ, Robinson JT, Strug LJ, Fernandez BA, Elsabbagh M, Carter MT, Hallmayer J, Knoppers BM, Anagnostou E, Szatmari P, Ring RH, Glazer D, Pletcher MT, Scherer SW. 2017. Whole genome sequencing resource identifies 18 new candidate genes for autism spectrum disorder. Nat Neurosci 20(4):602–611. [DOI] [PMC free article] [PubMed] [Google Scholar]
- Schreiner D, Nguyen TM, Russo G, Heber S, Patrignani A, Ahrne E, Scheiffele P. 2014. Targeted combinatorial alternative splicing generates brain region-specific repertoires of neurexins. Neuron 84(2):386–398. [DOI] [PubMed] [Google Scholar]
- Schreiner D, Simicevic J, Ahrne E, Schmidt A, Scheiffele P. 2015. Quantitative isoform-profiling of highly diversified recognition molecules. eLife 4:e07794. [DOI] [PMC free article] [PubMed] [Google Scholar]
- Sebat J, Lakshmi B, Malhotra D, Troge J, Lese-Martin C, Walsh T, Yamrom B, Yoon S, Krasnitz A, Kendall J, Leotta A, Pai D, Zhang R, Lee YH, Hicks J, Spence SJ, Lee AT, Puura K, Lehtimaki T, Ledbetter D, Gregersen PK, Bregman J, Sutcliffe JS, Jobanputra V, Chung W, Warburton D, King MC, Skuse D, Geschwind DH, Gilliam TC, Ye K, Wigler M. 2007. Strong association of de novo copy number mutations with autism. Science 316(5823):445–449. [DOI] [PMC free article] [PubMed] [Google Scholar]
- Singh SK, Stogsdill JA, Pulimood NS, Dingsdale H, Kim YH, Pilaz LJ, Kim IH, Manhaes AC, Rodrigues WS Jr., Pamukcu A, Enustun E, Ertuz Z, Scheiffele P, Soderling SH, Silver DL, Ji RR, Medina AE, Eroglu C 2016. Astrocytes Assemble Thalamocortical Synapses by Bridging NRX1alpha and NL1 via Hevin. Cell 164(1-2):183–196. [DOI] [PMC free article] [PubMed] [Google Scholar]
- Sons MS, Busche N, Strenzke N, Moser T, Ernsberger U, Mooren FC, Zhang W, Ahmad M, Steffens H, Schomburg ED, Plomp JJ, Missler M. 2006. alpha-Neurexins are required for efficient transmitter release and synaptic homeostasis at the mouse neuromuscular junction. Neuroscience 138(2):433–446. [DOI] [PubMed] [Google Scholar]
- Sterky FH, Trotter JH, Lee SJ, Recktenwald CV, Du X, Zhou B, Zhou P, Schwenk J, Fakler B, Sudhof TC. 2017. Carbonic anhydrase-related protein CA10 is an evolutionarily conserved pan-neurexin ligand. Proc Natl Acad Sci U S A 114(7):E1253–E1262. [DOI] [PMC free article] [PubMed] [Google Scholar]
- Stogsdill JA, Ramirez J, Liu D, Kim YH, Baldwin KT, Enustun E, Ejikeme T, Ji RR, Eroglu C. 2017. Astrocytic neuroligins control astrocyte morphogenesis and synaptogenesis. Nature 551(7679):192–197. [DOI] [PMC free article] [PubMed] [Google Scholar]
- Sudhof TC. 2017. Synaptic Neurexin Complexes: A Molecular Code for the Logic of Neural Circuits. Cell 171(4):745–769. [DOI] [PMC free article] [PubMed] [Google Scholar]
- Sugita S, Saito F, Tang J, Satz J, Campbell K, Sudhof TC. 2001. A stoichiometric complex of neurexins and dystroglycan in brain. J Cell Biol 154(2):435–445. [DOI] [PMC free article] [PubMed] [Google Scholar]
- Szatmari P, Paterson AD, Zwaigenbaum L, Roberts W, Brian J, Liu XQ, Vincent JB, Skaug JL, Thompson AP, Senman L, Feuk L, Qian C, Bryson SE, Jones MB, Marshall CR, Scherer SW, Vieland VJ, Bartlett C, Mangin LV, Goedken R, Segre A, Pericak-Vance MA, Cuccaro ML, Gilbert JR, Wright HH, Abramson RK, Betancur C, Bourgeron T, Gillberg C, Leboyer M, Buxbaum JD, Davis KL, Hollander E, Silverman JM, Hallmayer J, Lotspeich L, Sutcliffe JS, Haines JL, Folstein SE, Piven J, Wassink TH, Sheffield V, Geschwind DH, Bucan M, Brown WT, Cantor RM, Constantino JN, Gilliam TC, Herbert M, Lajonchere C, Ledbetter DH, Lese-Martin C, Miller J, Nelson S, Samango-Sprouse CA, Spence S, State M, Tanzi RE, Coon H, Dawson G, Devlin B, Estes A, Flodman P, Klei L, McMahon WM, Minshew N, Munson J, Korvatska E, Rodier PM, Schellenberg GD, Smith M, Spence MA, Stodgell C, Tepper PG, Wijsman EM, Yu CE, Roge B, Mantoulan C, Wittemeyer K, Poustka A, Felder B, Klauck SM, Schuster C, Poustka F, Bolte S, Feineis-Matthews S, Herbrecht E, Schmotzer G, Tsiantis J, Papanikolaou K, Maestrini E, Bacchelli E, Blasi F, Carone S, Toma C, Van Engeland H, de Jonge M, Kemner C, Koop F, Langemeijer M, Hijmans C, Staal WG, Baird G, Bolton PF, Rutter ML, Weisblatt E, Green J, Aldred C, Wilkinson JA, Pickles A, Le Couteur A, Berney T, McConachie H, Bailey AJ, Francis K, Honeyman G, Hutchinson A, Parr JR, Wallace S, Monaco AP, Barnby G, Kobayashi K, Lamb JA, Sousa I, Sykes N, Cook EH, Guter SJ, Leventhal BL, Salt J, Lord C, Corsello C, Hus V, Weeks DE, Volkmar F, Tauber M, Fombonne E, Shih A, Meyer KJ. 2007. Mapping autism risk loci using genetic linkage and chromosomal rearrangements. Nat Genet 39(3):319–328. [DOI] [PMC free article] [PubMed] [Google Scholar]
- Tabuchi K, Blundell J, Etherton MR, Hammer RE, Liu X, Powell CM, Sudhof TC. 2007. A neuroligin-3 mutation implicated in autism increases inhibitory synaptic transmission in mice. Science 318(5847):71–76. [DOI] [PMC free article] [PubMed] [Google Scholar]
- Tabuchi K, Sudhof TC. 2002. Structure and evolution of neurexin genes: insight into the mechanism of alternative splicing. Genomics 79(6):849–859. [DOI] [PubMed] [Google Scholar]
- Tanabe Y, Naito Y, Vasuta C, Lee AK, Soumounou Y, Linhoff MW, Takahashi H. 2017. IgSF21 promotes differentiation of inhibitory synapses via binding to neurexin2alpha. Nature communications 8(1):408. [DOI] [PMC free article] [PubMed] [Google Scholar]
- Tanaka KF, Ahmari SE, Leonardo ED, Richardson-Jones JW, Budreck EC, Scheiffele P, Sugio S, Inamura N, Ikenaka K, Hen R. 2010. Flexible Accelerated STOP Tetracycline Operator-knockin (FAST): a versatile and efficient new gene modulating system. Biol Psychiatry 67(8):770–773. [DOI] [PMC free article] [PubMed] [Google Scholar]
- Treutlein B, Gokce O, Quake SR, Sudhof TC. 2014. Cartography of neurexin alternative splicing mapped by single-molecule long-read mRNA sequencing. Proc Natl Acad Sci U S A 111(13):E1291–1299. [DOI] [PMC free article] [PubMed] [Google Scholar]
- Uchigashima M, Ohtsuka T, Kobayashi K, Watanabe M. 2016. Dopamine synapse is a neuroligin-2-mediated contact between dopaminergic presynaptic and GABAergic postsynaptic structures. Proc Natl Acad Sci U S A 113(15):4206–4211. [DOI] [PMC free article] [PubMed] [Google Scholar]
- Uemura T, Lee SJ, Yasumura M, Takeuchi T, Yoshida T, Ra M, Taguchi R, Sakimura K, Mishina M. 2010. Trans-synaptic interaction of GluRdelta2 and Neurexin through Cbln1 mediates synapse formation in the cerebellum. Cell 141(6):1068–1079. [DOI] [PubMed] [Google Scholar]
- Ullrich B, Ushkaryov YA, Sudhof TC. 1995. Cartography of neurexins: more than 1000 isoforms generated by alternative splicing and expressed in distinct subsets of neurons. Neuron 14(3):497–507. [DOI] [PubMed] [Google Scholar]
- Ushkaryov YA, Petrenko AG, Geppert M, Sudhof TC. 1992. Neurexins: synaptic cell surface proteins related to the alpha-latrotoxin receptor and laminin. Science 257(5066):50–56. [DOI] [PubMed] [Google Scholar]
- Vaags AK, Lionel AC, Sato D, Goodenberger M, Stein QP, Curran S, Ogilvie C, Ahn JW, Drmic I, Senman L, Chrysler C, Thompson A, Russell C, Prasad A, Walker S, Pinto D, Marshall CR, Stavropoulos DJ, Zwaigenbaum L, Fernandez BA, Fombonne E, Bolton PF, Collier DA, Hodge JC, Roberts W, Szatmari P, Scherer SW. 2012. Rare deletions at the neurexin 3 locus in autism spectrum disorder. Am J Hum Genet 90(1):133–141. [DOI] [PMC free article] [PubMed] [Google Scholar]
- Vinas-Jornet M, Esteba-Castillo S, Gabau E, Ribas-Vidal N, Baena N, San J, Ruiz A, Coll MD, Novell R, Guitart M. 2014. A common cognitive, psychiatric, and dysmorphic phenotype in carriers of NRXN1 deletion. Molecular genetics & genomic medicine 2(6):512–521. [DOI] [PMC free article] [PubMed] [Google Scholar]
- Yamasaki M, Matsui M, Watanabe M. 2010. Preferential localization of muscarinic M1 receptor on dendritic shaft and spine of cortical pyramidal cells and its anatomical evidence for volume transmission. J Neurosci 30(12):4408–4418. [DOI] [PMC free article] [PubMed] [Google Scholar]
- Yamasaki M, Yamada K, Furuya S, Mitoma J, Hirabayashi Y, Watanabe M. 2001. 3-Phosphoglycerate dehydrogenase, a key enzyme for l-serine biosynthesis, is preferentially expressed in the radial glia/astrocyte lineage and olfactory ensheathing glia in the mouse brain. J Neurosci 21(19):7691–7704. [DOI] [PMC free article] [PubMed] [Google Scholar]
- Yan J, Noltner K, Feng J, Li W, Schroer R, Skinner C, Zeng W, Schwartz CE, Sommer SS. 2008. Neurexin 1alpha structural variants associated with autism. Neurosci Lett 438(3):368–370. [DOI] [PubMed] [Google Scholar]
- Yu P, McKinney EC, Kandasamy MM, Albert AL, Meagher RB. 2015. Characterization of brain cell nuclei with decondensed chromatin. Developmental neurobiology 75(7):738–756. [DOI] [PubMed] [Google Scholar]
- Zahir FR, Baross A, Delaney AD, Eydoux P, Fernandes ND, Pugh T, Marra MA, Friedman JM. 2008. A patient with vertebral, cognitive and behavioural abnormalities and a de novo deletion of NRXN1alpha. J Med Genet 45(4):239–243. [DOI] [PubMed] [Google Scholar]
- Zhang C, At a soy D, Arac D, Yang X, Fucillo MV, Robison AJ, Ko J, Brunger AT, Sudhof TC. 2010. Neurexins physically and functionally interact with GABA(A) receptors. Neuron 66(3):403–416. [DOI] [PMC free article] [PubMed] [Google Scholar]


