Abstract
A high-salt-tolerant strain, Meyerozyma guilliermondii, has been isolated from activated sludge which has a great effect in the treatment of high-salt wastewater. To identify the salt tolerance mechanism of the strain, transcriptome sequencing and fluorescence quantitative PCR were used to analyse and compare the thallus, which were growing in the salt-free, low-salt (4%), and high-salt (16%) YPD media for 48 h, respectively, and then the change of intracellular and extracellular glycerol was determined. The results showed that 8220 unigenes were obtained from the sequencing data after de novo splicing, among which 6334 genes had annotation information in the SwissProt library. With salt-free as reference, there were 1135 unigenes that differentially expressed under low-salt stress and 1948 unigenes were differentially expressed under high-salt stress. With low salt as reference, 3056 unigenes were differentially expressed under high-salt stress. The fluorescence quantification results of the six candidate genes selected in this study were consistent with the transcriptome data. Under high-salt stress, the intracellular glycerol of M. guilliermondii reached a maximum value at about 10 min, then decreased quickly and tended to be stable. This study provided valuable data for the next study of salt tolerance of M. guilliermondii, and also contributed to the functional study of yeast salt tolerance genes.
Electronic supplementary material
The online version of this article (10.1007/s13205-019-1817-2) contains supplementary material, which is available to authorized users.
Keywords: Meyerozyma guilliermondii, Transcriptome sequencing, Fluorescence quantitative, Salt-tolerant gene
Introduction
Saline wastewater typically contains organic matter and at least 3.5% total dissolved solids (TDS) (Woolard and Irvine 1995). In addition to organic pollutants, this type of wastewater contains a large amount of soluble inorganic salts containing Cl−, Na+, SO42− and Ca2+ (Guo et al. 2009) ions that may be poisonous to plants and microorganisms (Ge and Chen 2011; Zhang 2014; Zhang et al. 2017). Therefore, wastewater must be treated before being discharged. A major bottleneck for saline wastewater treatment is the screening of strains resistant to high-salt conditions, and understanding the salt tolerance mechanism, and this applies to the yeast Meyerozyma guilliermondii.
There are ~ 200 genes related to salt tolerance and hypertonicity in the yeast genome, and both HOG–MAPK and Ca2+/calmodulin-dependent calcineurin (CaM) signalling pathways play major roles (Proft and Serrano 1999; Cheng et al. 2010). Completion of the Saccharomyces cerevisiae genome (Foury et al. 1998; Griffin et al. 2002) and the rapid development of high-throughput sequencing techniques facilitate exploration of the yeast salt tolerance molecular mechanism and the associated functional genes.
Yeasts have evolved conserved physiological adaptation mechanisms involving complex responses at the molecular level to cope with various external stresses in the environment (Singh and Norton 1991). For example, when microorganisms experience an increase in osmotic pressure in the external environment, they can increase the intracellular concentration of one or more compatible solutes without inhibiting or inactivating intracellular enzymes (Brown 1978). Glycerol, the main compatible solute in many yeast cells including Saccharomyces cerevisiae, plays an important role in the response to hyperosmotic stress (Meikle et al. 1991; Hohmann 2002; Maeda et al. 1994). When yeast cells are exposed to osmotic stress, expression of genes encoding proteins involved in the mitogen-activated protein kinase (MAPK) pathway is altered. The MAPK pathway includes the hypertonic glycerol (HOG) pathway in Saccharomyces cerevisiae (Posas et al. 1998; Chen and Thorner 2007; Raman et al. 2007). Anabolism of glycerol occurs via a two-step catalytic reaction starting from the intermediate metabolite dihydroxyacetone phosphate (DHAP) from the glycolysis pathway (Cheng et al. 2010). NAD+-dependent 3-phosphoglycerol dehydrogenase (GPD) in the glycerol synthesis pathway is considered the rate-limiting enzyme in glycerol synthesis (Cronwright et al. 2002). Although the glycerol pathway of Saccharomyces cerevisiae has been studied in detail, the salt tolerance mechanism of M. guilliermondii has not been reported, and the details of glycerol accumulation remain to be elucidated.
To obtain detailed genetic information, we employed Illumina RNA sequencing (RNA-seq) analysis to evaluate the transcriptome of M. guilliermondii under three different NaCl concentrations (0, 4 and 16%). Determination of internal and external glycerol concentrations and fluorescence quantitative PCR analysis were performed to verify the accuracy of the sequencing results. Using this novel approach, we identified a set of putative genes related to resistance to high-salt stress. The results enable a better understanding of the molecular mechanism of salt tolerance in M. guilliermondii, and provide useful genetic resources for future experiments.
Materials and methods
Strains and media
The M. guilliermondii (KX447139) yeast strain used in this study was identified from an activated sludge sample from a wastewater treatment plant at Jiangxi Wobangxing Environmental Protection Technology Co. Ltd. Yeast cells were grown in YPD (2% glucose, 2% peptone) sterilised at 115°C for 30 min.
Sample preparation
A single colony of M. guilliermondii was picked from an agar slant and yeast cells used for RNA isolation were grown at 30 °C with shaking at 170 rpm for 24 h in 250 ml YPD medium, incubated to mid-respirofermentative growth phase. Cells were harvested, 1 ml of bacterial culture was inoculated into 250 ml YPD containing 0, 4 or 16% (w/v) NaCl, and culturing was continued. After 48 h, yeast cells were collected at 4 °C by centrifugation (6000×g, 5 min), immediately frozen in liquid N2 for 5 min, and stored at − 80 °C.
Transcriptome sequencing
Samples were sent to Beijing Novogene Bioinformatics Technology Co., Ltd. on dry ice for extraction of total RNA, construction of a cDNA library, and preliminary analysis of the sequencing data.
Bioinformatics analysis
Reads with adaptors, reads less than 25 nucleotides, reads of low quality (Phred score < 25), and reads with unknown nucleotides larger than 5% were removed from the raw data generated by the Illumina HiSeq X Ten instrument. Remaining reads were classified as clean reads and assembled using Trinity software (Grabherr et al. 2011). Corset (Davidson and Oshlack 2014) was used to assess expression patterns of aligned transcripts and perform hierarchical clustering of transcripts to obtain the longest Cluster sequence for subsequent analysis (https://code.google.com/p/corset-project/). Gene functions were annotated using Nr (NCBI non-redundant protein sequences), Nt (NCBI non-redundant nucleotide sequences), Pfam (Protein family, http://pfam.sanger.ac.uk/), KOG/COG (Clusters of Orthologous Groups of proteins, http://www.ncbi.nlm.nih.gov/COG/), SwissProt (a manually annotated and reviewed protein sequence database, http://www.ebi.ac.uk/uniprot/), KO (KEGG Ortholog, http://www.genome.jp/kegg/) and GO (Gene Ontology, http://www.geneontology.org/) databases. CDS prediction, gene expression level analysis (Li and Dewey 2011; Trapnell et al. 2010), differential expression analysis, GO enrichment analysis (Young et al. 2010), and KEGG pathway enrichment analysis (Kanehisa et al. 2008) were performed. Transcriptome data can be obtained from the NCBI/ENA database.
Determination of internal and external glycerol levels
Sample pretreatment
Yeast cells were inoculated in 250 ml YPD medium at 30 °C with shaking at 170 rpm for 24 h and incubated to mid-respirofermentative growth phase. Cells were harvested, 1 ml of bacterial culture was inoculated into 250 ml YPD containing 0, 4 or 16% (w/v) NaCl, culturing was continued, and samples were extracted at 10, 20, 30, 60, 90, 150, 210 and 330 min. Cell density was measured based on the absorbance at 600 nm (OD600) using a spectrophotometer. Cell samples were centrifuged at 4 °C and 6000 rpm for 5 min to generate supernatant and cell pellet samples. Yeast cells were washed using precooled sterile water twice and centrifuged at 4 °C and 6000 rpm for 5 min. Intracellular glycerol was extracted using self-thawing at 55 °C for 26 h followed by centrifugation at 12,000×g for 5 min. The supernatant was filtered with a 0.22-μm microporous membrane, and extracts were used to determine the glycerol content.
Determination of glycerol concentration
The content of intracellular and extracellular glycerol was measured using a glycerol kit (Solarbio Co., Ltd, Beijing, China). The glycerol content was calculated per ml of medium. The iodine acid in the glycerol kit oxidises glycerol to form formaldehyde. In the presence of chloride ions, formaldehyde condenses with acetylacetone to form a yellow substance that has a characteristic absorption peak at 420 nm. The colour depth is proportional to the glycerol content.
Real-time fluorescence PCR
Six salt tolerance-related genes were selected and Oligo 6 software was used to design primers for real-time fluorescence quantitative PCR analysis (Table 1). Extracted RNA was reverse transcribed into cDNA using a first-strand cDNA synthesis kit (TaKaRa Co., Ltd, Dalian, China), the reverse transcription product was used as a template, and ALG9 and UBC6 were used as internal references. An SYBR Green RT-PCR kit was used for quantitative detection of fluorescence with an ABI 7500 Real-Time PCR System. Three biological replicates were included for each gene under different conditions, and relative expression levels were calculated according to the 2−ΔΔCT method.
Table 1.
Primers for real-time quantitative PCR
| Gene name | Primer name | Primer sequences | Size of product (bp) |
|---|---|---|---|
| ALG9 (reference gene) | ALG9-F | GGACTGATTTCTATTTTGAGGATAATGAAC | 168 |
| ALG9-R | TATAGTTGTCGGGAAGGAAGAAAGATGCTGG | ||
| UBC6 (reference gene) | UBC6-F | ACACGTGGAATCCAGCCTGGAGTGT | 264 |
| UBC6-R | GCTGCTTTTTCTGCCGCCAATGC | ||
| HOG1 | HOG1-F | ATACATCCCACCGACCACAAG | 219 |
| HOG1-R | CCAGATGTTGCGTGGATTGAA | ||
| GPD1 | GPD1-F | CCAGCAGCAATAGCAACAACA | 245 |
| GPD1-R | TCCCAATCCATCACTGACACT | ||
| GPP1 | GPP1-F | ACCACAATATCAGCTCCGGAA | 160 |
| GPP1-R | CTCAAGGCTACAAATCGGCAC | ||
| GUT1 | GUT1-F | TGCTCAGCCACATTATGCCTT | 232 |
| GUT1-R | AGCCCTGGCAATATGACTAGA | ||
| GUT2 | GUT2-F | CCACAGCAGTAGCCTTGATGA | 186 |
| GUT2-R | TGAAAGCTGCATGTGTGTACC | ||
| FPS1 | FPS1-F | GCACCAAAGACCCCAGGAGGAAT | 96 |
| FPS1-R | CGGCAGTAGACAAAGCAGAAGCAAG |
Results
De novo assembly of short reads
To obtain an overview of the M. guilliermondii gene expression profile, cDNA samples obtained under different salt concentration were prepared and RNA-seq was performed using a HiSeq X Ten instrument. The number of raw paired-end reads in cDNA sequencing libraries was 41693362, 60207884 and 60207884 under salt-free, low-salt and high-salt conditions, respectively. After trimming adapter and low-quality sequences, we obtained 39325382, 58236328 and 58318784 clean paired-end reads totalling 5.9 Gb, 8.74 Gb and 8.75 Gb of nucleotides, respectively. The Q30 percentage (sequencing error rate < 1%) was 89.78, 93.11 and 93.41%, respectively, and the read length was ~ 150 bp (Supporting Table S1). Trinity software was applied to assemble these short reads into a de novo transcriptome. Eventually, 8220 unigenes were identified, with an average length of 1497 bp. The sequence length of these assembled unigenes ranged from 201 to > 12,488 bp, with an N50 length of 2427 bp (Supporting Table S2 and S3). All raw sequence data generated by sequencing has been deposited in the Sequence Read Archive (SRA) database under accession numbers ERX2816026−ERX2816028.
All unigene sequences were annotated using Nr, Nt, Pfam, KOG, SwissProt, KEGG and GO databases, and the results are shown in Table 2. All 8220 unigenes were compared successfully, of which 7753 were annotated in at least one database, accounting for 94.31% of the total, and 2936 unigenes were annotated in all databases, accounting for 35.71% of the total. As shown in Fig. 1, 3666 unigenes were compared successfully in all five databases.
Table 2.
Success rate statistics for gene annotation
| Number of unigenes | Percentage (%) | |
|---|---|---|
| Annotated in NR | 7096 | 86.32 |
| Annotated in NT | 7447 | 90.59 |
| Annotated in KO | 3988 | 48.51 |
| Annotated in SwissProt | 6334 | 77.05 |
| Annotated in PFAM | 5718 | 69.56 |
| Annotated in GO | 5953 | 72.42 |
| Annotated in KOG | 4343 | 52.83 |
| Annotated in all databases | 2936 | 35.71 |
| Annotated in at least one database | 7753 | 94.31 |
| Total unigenes | 8220 | 100 |
Fig. 1.
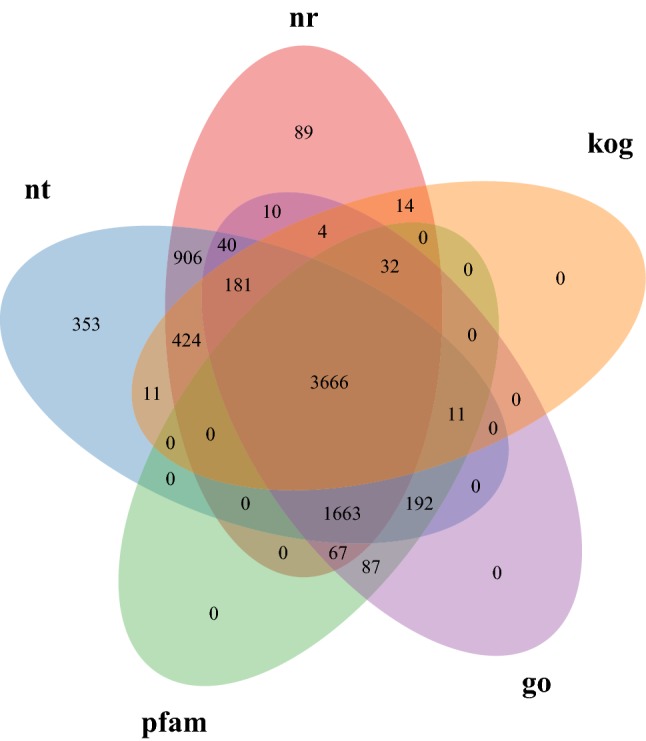
Annotated Venn diagram analysis. Nr NCBI non-redundant protein sequence database, Nt NCBI nucleotide sequence database, KOG euKaryotic Ortholog Groups database, Pfam Protein family database, GO Gene Ontology database
Gene function annotation classification
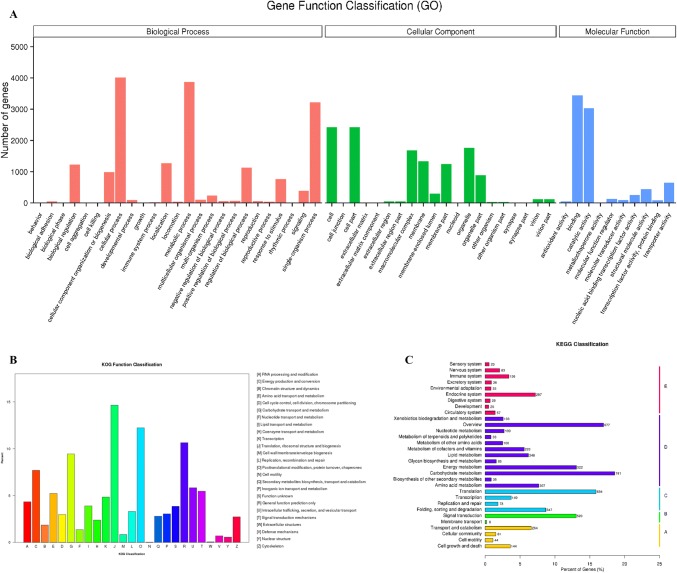
After aligning unigene sequences with the Nr database, the assembly from the transcriptome of the salt-tolerant strain shared the highest similarity with M. guilliermondii (75.9% sequence identity), and the strain was assigned as this species. After annotating using GO, 5953 genes were successfully annotated and classified according to the top three GO categories, namely biological process (BP, cellular component (CC) and molecular function (MF), divided into 55 branches. After comparing all gene sequences in the transcriptome of this strain with the KOG database, 4343 genes were annotated, accounting for 52.83%. Based on functional division, the annotated genes were divided into 25 categories, and KO annotations were classified according to their KEGG metabolic pathways. The results are shown in Fig. 2.
Fig. 2.
Gene classification diagram. a GO classification diagram. b KOG classification diagram. c KEGG classification diagram. The ordinate is the name of the KEGG metabolic pathway, and the abscissa is the ratio of the number of genes annotated to the pathway and the total number of genes annotated. Genes are divided into five branches based on KEGG metabolic pathways (A, cellular processes; B, environmental information processing; C, genetic information processing; D, metabolism; E, organismal systems)
Analysis of gene expression levels
In RNA-seq analysis, FPKM is the number of fragments of a gene per kilobase per million fragments. This value reflects the depth of sequencing and the length of gene fragments counted, and it is the most commonly employed parameter for estimating gene expression levels (Trapnell et al. 2010). In the present study, FPKM values were calculated for the different experimental conditions, and overall values were also calculated (Fig. 3). The results show that with increasing salt concentration, FPKM intervals were gradually reduced from 0 to 0.1 and 15 to 60, while FPKM intervals in the range of 3.57–15 and > 60 were gradually increased, and gene expression levels in the 0.1–0.3 FPKM interval range were almost constant.
Fig. 3.
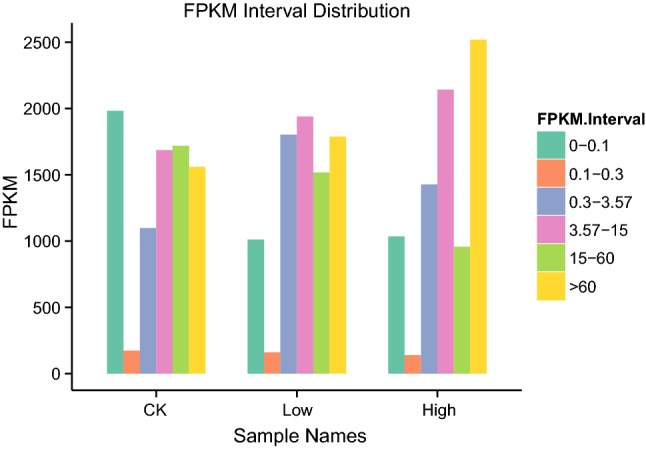
FPKM interval distribution
Differential expression analysis
Venn diagram of differential gene expression
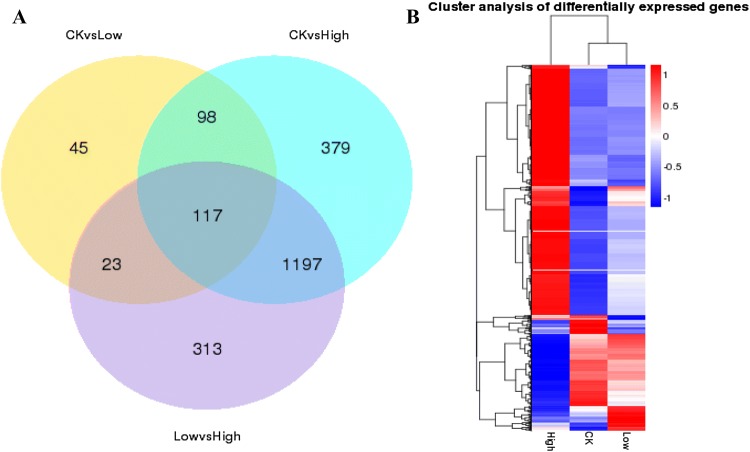
When the number of comparison combinations was between two and five, the number of differential genes obtained from each group was counted and a Venn diagram was drawn to visually show the number of common and unique differential genes between different comparison combinations (Fig. 4). There were 283 differentially expressed genes (DEGs) in the comparison between 0% NaCl (CK) and 4% NaCl (Low). Meanwhile, there were 1791 DEGs between CK and 16% (High) NaCl groups, and 1650 between Low- and High-NaCl groups. The results revealed 117 genes commonly differentially expressed in all three different salt concentrations; compared with CK, 215 DEGs were identified in both Low and High groups; compared with the Low group, 140 DEGs were identified in both CK and High groups; compared with the High group, 1314 DEGs were identified in CK and Low groups. Thus, differential expression of genes was increased dramatically at the high salt concentration.
Fig. 4.
Differential gene distribution map. a Venn diagram of differential genes. The sum of the numbers in each large circle represents the total number of differential genes in the comparative combination, and the overlapping part of the circle represents differential genes common among the combinations. b Differential gene cluster analysis. Red represents high expression, blue represents low expression, and colouring from red to blue indicates larger to smaller log10 (FPKM + 1) values
Cluster analysis of differential gene expression
Differential gene cluster analysis was used to determine the clustering pattern of differential gene expression under different experimental conditions. A comparative gene set was obtained for each comparative combination and FPKM values for each of the experimental groups/samples and combined differential gene sets for all comparative combinations were used for hierarchical cluster analysis (Fig. 4). Compared with the salt-free group, expression of most genes was altered in the high-salt group. It should be noted that expression levels of genes related to various metabolic pathways in M. guilliermondii were altered under high-salt conditions, presumably to protect against high-salt stress, while expression of genes in low salt was similar to a salt-free environment.
GO enrichment analysis of differential gene expression
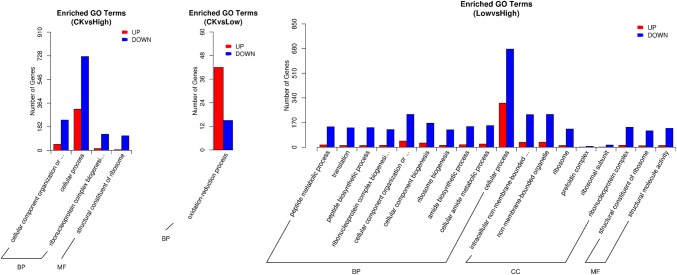
GO functional significance enrichment analysis showed that compared with the genomic background, GO functional terms were significantly enriched among DEGs, revealing a significant correlation between DEGs and biological functions (Fig. 5). In the comparison of CK and High groups, DEGs were mainly distributed in the cellular component and genomic (281), cellular process (1039), ribonucleoprotein complex biogenesis (139) and structural constituents of ribosome (119) categories. In the comparison of CK and Low groups, DEGs were primarily distributed in the oxidation–reduction process (57) category. In the comparison of Low and High groups, a large number of DEGs were linked to BB, CC and MF categories, and DEGs were related to 980 biological processes.
Fig. 5.
Differential gene GO enrichment map. The abscissa shows GO terms of the top three levels, and the ordinate shows the number of differential genes under the terms (including subterms). Three different types basic classification of GO terms were shown for biological process, cellular component and molecular function categories (left to right)
KEGG enrichment analysis of differential gene expression
A KEGG enrichment scatter plot of DEGs was generated to visualise the KEGG enrichment analysis results (Fig. 6). The degree of KEGG enrichment is measured using the Rich Factor, q value, and the number of genes enriched in a given pathway. The 20 most significant pathway entries were displayed on the map. Under high-salt stress, in both CK vs. High and Low vs. High comparisons, the ribosome category accounted for the most DEGs (105 and 107, respectively). The most significant pathway was the cell cycle. In the CK and Low comparison, methane metabolism was the most represented pathway (ten DEGs), while the most significant pathway was taurine and hypotaurine metabolism. These results showed that when yeast cells were exposed to hyperosmotic stress, the activity of ribosomes in the cells is greatly enhanced to meet the rapid synthesis of proteins, and the cell cycle metabolic pathway is significantly altered to enhance salt tolerance to adapt to the high-salt environment as soon as possible.
Fig. 6.
KEGG pathway enrichment scatter plot analysis. Control (CK) vs. High, CK vs. Low, and Low vs. High comparisons are shown from left to right. The vertical axis represents the path name, and the horizontal axis represents the corresponding Rich factor. The magnitude of the q value is represented by the colour of the point (the colour intensity is reduced closer to the red gene under each pathway
Analysis of the salt tolerance mechanism
In general, the cell membrane and cytoplasm of salt-tolerant bacteria contain special enzymes that can regulate osmotic pressure to rapidly balance with external pressure by rapidly accumulating small polar molecules inside the cell, preventing the cell from rupturing. For example, salt-tolerant yeast generally maintains a balance of osmotic pressure inside and outside the cell via a large accumulation of glycerol. Therefore, we focused on glycerol synthesis-related pathways in M. guilliermondii. Information on the extracellular hyperosmolarity of yeast and hyperosmotic glycerol response pathway control of glycerol synthesis under hyperosmotic stress conditions has been reviewed (Wang and Zhu 1999). Based on this knowledge, we explored the hyperosmotic mechanism of M. guilliermondii. Glycerol accumulation in yeast cells is generally divided into four methods: (1) increased anabolism, (2) decreased intracellular glycerol output, (3) reduced metabolic degradation, and (4) absorption of glycerol from the environment (Blomberg and Adler 1992). In the present study, we performed local BLAST searches with a q value cut-off of < 0.005, and differences in gene expression > 2 or < 0.5 were considered significant. Ten DEGs associated with glycerol accumulation were identified using this approach (Table 3). Glycerol accumulation-related metabolism is mainly regulated by the HOG pathway, and three DEGs involved in glycerol synthesis were identified: MAPK kinase (HOG), glycerol-3-phosphate dehydrogenase (GPD) and 3-phosphoglyceride (GPP). Compared with salt-free gene expression levels, expression of the HOG1 gene was upregulated under high-salt conditions. Expression of GPD1 and GPP1 genes was also upregulated under low salt and high salt. To reduce the speed of glycerol passing through the cell membrane, glycerol transport induces rapid shutdown of the FPS1 protein, and this was indeed downregulated under high-salt stress. The glycerol decomposition pathway is mainly regulated by glycerol kinase (GUT1) and FAD+-dependent glycerol-3-phosphate dehydrogenase (GUT2), and research has shown that expression of the GUT2 gene is repressed by glucose at the transcriptional level (Larsson et al. 1998). In the present study, gene expression levels under salt-free conditions were used as controls, and the β-glucosidase gene was significantly upregulated, which caused significant repression of GUT2 gene expression. Furthermore, GUT2 was upregulated under high-salt stress, as was GUT1. This leads to a large decomposition of glycerol to 3-phosphoglycerol that re-enters the synthetic pathway, and this is likely to allow precise control of the accumulation of intracellular glycerol. Through the above complementary actions of decomposing and synthetic pathways, accumulation of intracellular glycerol can be effectively controlled to avoid cell bursting. Regarding the absorption of glycerol from the environment, GUP1 expression in M. guilliermondii was not altered much under different salt concentrations. In conclusion, M. guilliermondii mainly relies on the previous three methods to accumulate glycerol and thereby adapt to a high-permeability environment. These genes provide a reference for future genetic analysis of salt tolerance in M. guilliermondii.
Table 3.
Summary of differentially expressed genes related to glycerol accumulation
| Gene_id | Gene name | HIGH/CK | LOW/CK | q value |
|---|---|---|---|---|
| Cluster-146.2919 | GPD1 | 2.593903 | 3.883272 | 4.0738E−133 |
| Cluster-146.1634 | GPP1 | 4.517784 | 3.543145 | 2.35E−121 |
| Cluster-146.6242 | HOG1 | 2.260977 | – | 6.09E−40 |
| Cluster-146.274 | FPS1 | 0.027702 | – | 2.88E−25 |
| Cluster-146.1259 | GUT1 | 3.101436 | – | 1.27E−21 |
| Cluster-146.2431 | GUT2 | 2.902207 | – | 3.86E−106 |
Measurement of internal and external glycerol content
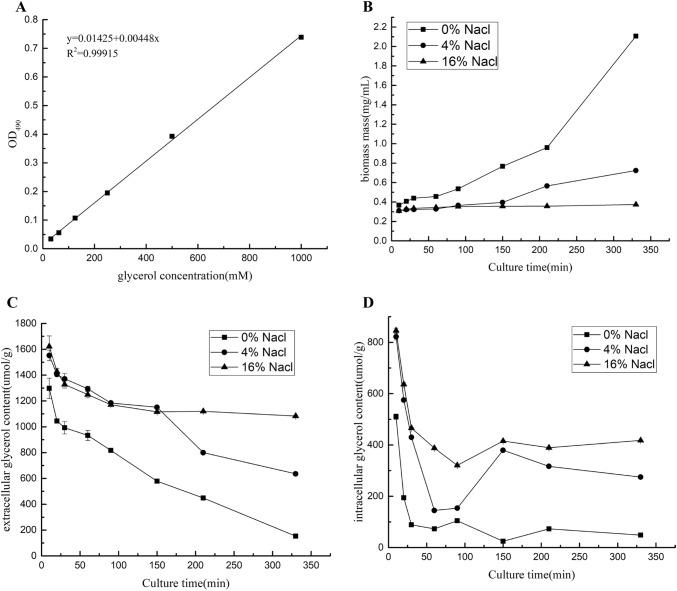
Under the three salinity conditions, changes in the content of internal and external glycerol were analysed over time. When M. guilliermondii was subjected to high-salt stress, intracellular glycerol was accumulated rapidly, and the higher the salinity, the greater the accumulation of glycerol. Similarly, the glycerol content of M. guilliermondii reached a maximum around 10 min after entering the environment, then rapidly declined and stabilised. However, in general, at 16% (w/v) NaCl, the glycerol content decreased at a much lower rate than at 0% (w/v) and 4% (w/v), and maintained a higher concentration. Analysis of extracellular glycerol content revealed a rapid decrease followed by stabilisation. The complete hyperosmotic stress-related MAPK signalling pathway in Pichia pastoris plays a vital role in allowing the yeast to respond quickly to changes in the external environment. In particular, 3-glycerol phosphate dehydrogenase activity is increased, glycerol efflux channels are closed, intracellular glycerol cannot be discharged into the environment, and expression of genes related to glycerol decomposition is diminished; hence, the extracellular glycerol content of M. guilliermondii rapidly decreased around 20 min, while the intracellular glycerol content reached a high level. However, over time, yeast cells gradually adapted to the hyperosmotic environment, including by opening other stress channels and synthesising new proteins, slowly decreasing the effects of glycerol, until the glycerol content of yeast cells gradually achieved balance under the hyperosmotic conditions (Fig. 7).
Fig. 7.
Determination of intracellular and extracellular glycerol levels. a Glycerol standard curve. b Cell concentrations at different time points. c Extracellular glycerol content. d Intracellular glycerol content
Fluorescence quantitative PCR analysis
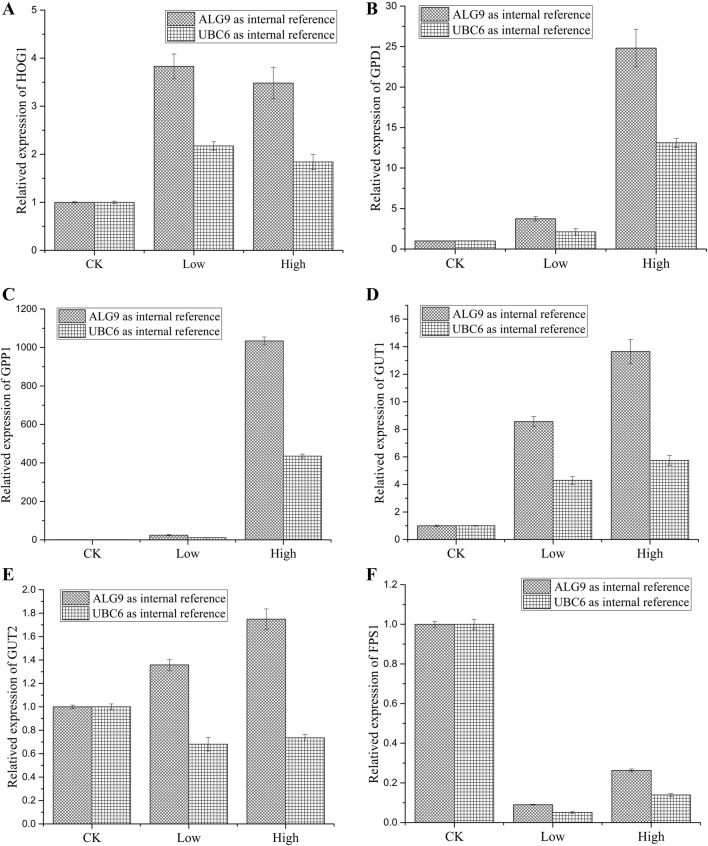
Real-time fluorescence quantitative PCR was used to analyse the expression levels of selected genes before and after salt treatment (Fig. 8). The results showed that expression levels for all six genes were consistent with those measured by RNA-seq, confirming the reliability of the transcriptome sequence data. For specific information, please refer to Supporting Tables S4 and S5.
Fig. 8.
RQ values of differential genes at different salt concentrations. a RQ values of differential genes under low-salt stress. b RQ values of differential genes under high-salt stress
Discussion
In this study, high-throughput sequencing was used to perform transcriptome analysis of M. guilliermondii under different salt concentrations, and 8220 unigenes were assembled using bioinformatics software. MAPK signalling pathways were correlated with salt tolerance according to KEGG metabolic pathway analysis. In total, 51 unigenes involved in MAPK signalling were identified, of which six were significantly differentially expressed. These unigenes and the accompanying annotation information provide theoretical support for further research on the salt tolerance mechanism of M. guilliermondii.
The microbiological community is actively exploring salt-tolerant actinomycetes and yeasts, as well as salt-tolerant bacteria. Studies have shown that ~ 200 genes in the yeast genome are related to salt tolerance (Lei et al. 2007). Transcriptional responses to osmotic pressure in yeast cells account for ~ 5% of total genes (Zhu and Wang 1999). Glycerol, a major compatible substance in yeast cells (Wang and Tao 1994), plays an important role in cells under high-salt stress, and its importance has been clarified by the growth of Saccharomyces cerevisiae under salt stress (Nevoigt and Stahl 2010). In the HOG1 pathway, the MAPK enzyme HOG1 is a key factor, acting as the rate-limiting enzyme for glycerol synthesis, and it is strongly induced by osmotic pressure.
The glycerol synthesis ability of a GPD1 gene deletion mutant was reduced or even lost completely (Ansell et al. 1997; Albertyn et al. 1994), and overexpression of GPD1 strains can significantly improve the glycerol synthetic ability (Nguyen et al. 2004; Gori et al. 2010); when yeast cells were transferred to medium containing 10% (w/v) NaCl, GPD1 activity was significantly increased 30- to 40-fold (Blomberg and Adler 1989). However, studies have also shown that under the same conditions, transfer of Debaryomyces hansenii to an environment containing 10% (w/v) NaCl only increased the activity of GPD1 twofold (Larsson et al. 1990), similar to M. guilliermondii in the present work. Expression levels of GPD1 under high-salt conditions were only 2.59-fold higher than those under salt-free conditions, and expression of GPD1 under low-salt conditions was 3.88-fold higher than salt-free conditions. M. guilliermondii appears to ameliorate the effect of high-salt stress by decreasing the secretion of glycerol into the extracellular space. However, expression levels of GPP1 were significantly increased. The results of fluorescence quantification PCR showed that compared with the ALG9 reference gene, expression of GPP1 was more than 1000 times higher under high-salt conditions than salt-free conditions, while expression of GPP1 was 21.436-fold higher under low salt. This would enable the rapid conversion of glycerol 3-phosphate into glycerol.
The results showed that the strain was not completely dependent on the glycerol synthesis pathway since some other methods appear to contribute to glycerol accumulation. For example, a reduction in glycerol output was caused by changes in the yeast cell membrane, consistent with down-regulation of the glycerol transport-promoting protein Fps1p (Thorsen et al. 2006). In the present study, expression of Fps1 under high-salt conditions was significantly reduced (0.29-fold that of low-salt conditions). In the glycerol catabolic pathway, synthesis of glycerol kinase and FAD-dependent glycerol-3-phosphate dehydrogenase (mtGPD) is controlled by glucose repression and occurs at the transcriptional level (Pavlik et al. 1993). In a previous study (Wang and Zhu 1999), glucose exhibited an obvious repression effect on the expression of C. glycerolgenesis mtGPD. However, in the present study, expression of GUT1 in high-salt conditions was upregulated, while expression of GUT2 under high-salt conditions was almost invariable, resulting in a faster rate of intracellular glycerol decomposition to 3-phosphoglycerol. It is possible that M. guilliermondii also accelerates the decomposition rate to achieve a dynamic equilibrium in glycerol content.
Meyerozyma guilliermondii can also increase glycerol accumulation by ingesting glycerol from the environment. Thunblad-Johansson and Adler (2010) showed that when Saccharomyces cerevisiae is exposed to high-salt stress, the composition of intracellular fatty acids is changed, and the composition of C16 acids is decreased slightly, while C18 acids are increased correspondingly. This change leads to a decrease in the permeability of the cell membrane to polyols. The absorption of glycerol is not a simple passive diffusion process; there exists a transmembrane protein-mediated glycerol diffusion pathway that involves the Fsp1 protein. Therefore, Fsp1 in M. guilliermondii plays a role in controlling glycerol entry and exit so that internal and external glycerol levels reach a kinetic balance, thereby protecting cells from the effects of high-salt stress. In summary, M. guilliermondii not only reduces the loss and decomposition of intracellular glycerol, but also absorbs extracellular glycerol from the environment, while increasing the synthesis of glycerol to adapt to a high-salt stress environment.
Studies have shown that salt-tolerant yeasts can be used to treat wastewater containing high levels of salt and organic matter, but the salt tolerance mechanism is not fully understood (Fang and Zeng 2005). The concentrations of Na+ and K+ are 3.3 mol/L and 0.05 mol/L in the living environment of Halobacterium cutirubrum, and the intracellular concentrations of Na+ and K+ are 0.8 mol/L and 5.33 mol/L, respectively. This indicates that salt-tolerant bacteria can manipulate K+ levels by absorbing extracellular free K+ and discharging high concentration of Na+ (Zhang et al. 2011) so that the intracellular K+ concentration is maintained at a high level. Salt-tolerant microorganisms can accumulate high concentrations of K+ to regulate intracellular osmotic pressure, and ribosomes, enzymes and other proteins require high concentrations of K+ to maintain their normal structures and functions (Shilo 1979). In the present study, expression of ribosomal proteins involved in the ribosome metabolism pathway was significantly increased in most cases, and expression of protein folding-related proteins involved in processing and metabolic pathways in the endoplasmic reticulum was also significantly upregulated. The production, stability and activity of enzymes in organisms require certain physical and chemical conditions. Enzymes in salt-tolerant bacteria are halotolerant, and certain salt concentrations are essential for their production, stability and activity (Kusvuran 2014). A novel protease was isolated from Pseudomonas aeruginosa in high-salt wastewater derived from leather processing (Hanabusa et al. 2011). This protease plays an active role at certain NaCl concentrations and promotes the degradation of high-salt wastewater. In the present study, tyrosine protein phosphatase CDC14 (Q59NH8), α-1,3-mannosyltransferase MNT4 (Q59MZ9), and DNA damage-responsive protein kinase DUN1 (P39009) were not expressed in the absence of salt, but were significantly expressed under high salt, with expression levels upregulated 37.58-, 5.18- and 8.5-fold, respectively. We predict that these proteins may be related to salt tolerance in yeast, but this hypothesis requires experimental verification. Min and Yun (1999) used Pichia guilliermondii A9, a salt- and high-osmotic pressure-tolerant yeast, to treat kimchi production wastewater, and growth of A9 was not inhibited at an NaCl mass fraction of 10%, but it was decreased at 12%. Salt-tolerant yeast have broad application prospects for the treatment of high-salt wastewater. Herein, we showed that M. guilliermondii can grow at an NaCl mass fraction of 16%, demonstrating superior potential for high-salt wastewater treatment using this strain.
In summary, the six DEGs related to glycerol accumulation in M. guilliermondii identified in the present study are candidate genes for investigating the salt tolerance mechanism in yeast.
Electronic supplementary material
Below is the link to the electronic supplementary material.
Acknowledgements
This work was supported by the National Natural Science Foundation of China (Grant no. 31760449).
References
- Albertyn J, Hohmann S, Thevelein JM, et al. GPD1, which encodes glycerol-3-phosphate dehydrogenase, is essential for growth under osmotic stress in Saccharomyces cerevisiae, and its expression is regulated by the high-osmolarity glycerol response pathway. Mol Cell Biol. 1994;14(6):4135–4144. doi: 10.1128/mcb.14.6.4135. [DOI] [PMC free article] [PubMed] [Google Scholar]
- Ansell Ricky, Granath Katarina, Hohmann Stefan, et al. The two isoenzymes for yeast NAD+-dependent glycerol 3-phosphate dehydrogenase encoded by GPD1 and GPD2 have distinct roles in osmoadaptation and redox regulation. EMBO J. 1997;16(9):2179. doi: 10.1093/emboj/16.9.2179. [DOI] [PMC free article] [PubMed] [Google Scholar]
- Blomberg A, Adler L. Roles of glycerol and glycerol-3-phosphate dehydrogenase (NAD+) in acquired osmotolerance of Saccharomyces cerevisiae. J Bacteriol. 1989;171(2):1087–1092. doi: 10.1128/jb.171.2.1087-1092.1989. [DOI] [PMC free article] [PubMed] [Google Scholar]
- Blomberg A, Adler L. Physiology of osmotolerance in fungi. Adv Microb Physiol. 1992;33(33):145–212. doi: 10.1016/s0065-2911(08)60217-9. [DOI] [PubMed] [Google Scholar]
- Brown AD. Compatible solutes and extreme water stress in eukaryotic micro-organisms. Adv Microb Physiol. 1978;17:181. doi: 10.1016/s0065-2911(08)60058-2. [DOI] [PubMed] [Google Scholar]
- Chen Raymond E, Thorner Jeremy. Function and regulation in MAPK signaling pathways: lessons learned from the yeast Saccharomyces cerevisiae. BBA Mol Cell Res. 2007;1773(8):1311–1340. doi: 10.1016/j.bbamcr.2007.05.003. [DOI] [PMC free article] [PubMed] [Google Scholar]
- Cheng XZ, Wang ZX, Zhu GJ. Progress in glycerol metabolism and its physiological function in yeast cells. China Biotechnol. 2010;30(5):140–148. [Google Scholar]
- Cronwright GR, Rohwer JM, Prior BA. Metabolic control analysis of glycerol synthesis in Saccharomyces cerevisiae. Appl Environ Microbiol. 2002;68(9):4448. doi: 10.1128/AEM.68.9.4448-4456.2002. [DOI] [PMC free article] [PubMed] [Google Scholar]
- Davidson NM, Oshlack A. Corset: enabling differential gene expression analysis for de novo assembled transcriptomes. Genome Biol. 2014;15(7):410. doi: 10.1186/s13059-014-0410-6. [DOI] [PMC free article] [PubMed] [Google Scholar]
- Fang J, Zeng KM. Development of salt-containing wastewater treatment research. Ind Water Treat. 2005;25(2):1–4. [Google Scholar]
- Foury F, Roganti T, Lecrenier N, et al. The complete sequence of the mitochondrial genome of Saccharomyces cerevisiae. FEBS Lett. 1998;440(3):325–331. doi: 10.1016/s0014-5793(98)01467-7. [DOI] [PubMed] [Google Scholar]
- Ge HL, Chen L. Effect of sewage irrigation on some physiological-biochemical characteristics of soybean (Glycine max) seedling and microbial functional groups in soybean rhizosphere soil. Henan Nongye Kexue (Journal of Henan Agricultural Sciences) 2011;40(8):92–94. [Google Scholar]
- Gori K, Mortensen HD, Arneborg N, et al. Expression of the GPD1, and GPP2, orthologues and glycerol retention during growth of Debaryomyces hansenii, at high NaCl concentrations. Yeast. 2010;22(15):1213–1222. doi: 10.1002/yea.1306. [DOI] [PubMed] [Google Scholar]
- Grabherr MG, Haas BJ, Yassour M, et al. Full-length transcriptome assembly from RNA-Seq data without a reference genome. Nat Biotechnol. 2011;29(7):644. doi: 10.1038/nbt.1883. [DOI] [PMC free article] [PubMed] [Google Scholar]
- Griffin TJ, Gygi SP, Ideker T, et al. Complementary profiling of gene expression at the transcriptome and proteome levels in Saccharomyces cerevisiae. Mol Cell Proteomics. 2002;1(4):323–333. doi: 10.1074/mcp.m200001-mcp200. [DOI] [PubMed] [Google Scholar]
- Guo SS, Zhang PY, Qu Y. Review on biological treatment of high salinity wastewater and its feasibility. Sichuan Huanjing (Sichuan Environment) 2009;28(3):85–88. [Google Scholar]
- Hanabusa K, Kondo K, Takemoto K. Optimization studies on production of a salt-tolerant protease from Pseudomonas aeruginosa strain BC1 and its application on tannery saline wastewater treatment. Braz J Microbiol. 2011;42(4):1506–1515. doi: 10.1590/S1517-838220110004000038. [DOI] [PMC free article] [PubMed] [Google Scholar]
- Hohmann Stefan. Osmotic stress signaling and osmoadaptation in yeasts. Microbiol Mol Biol Rev. 2002;66(2):300–372. doi: 10.1128/MMBR.66.2.300-372.2002. [DOI] [PMC free article] [PubMed] [Google Scholar]
- Kanehisa M, Araki M, Goto S, et al. KEGG for linking genomes to life and the environment. Nucleic Acids Res. 2008;36((Database issue)):480–484. doi: 10.1093/nar/gkm882. [DOI] [PMC free article] [PubMed] [Google Scholar]
- Kusvuran S. Antioxidative enzyme activities in the leaves and callus tissues of salt-tolerant and salt-susceptible melon varieties under salinity. Afr J Biotech. 2014;11(3):635–641. [Google Scholar]
- Larsson C, Morales C, Gustafsson L, et al. Osmoregulation of the salt-tolerant yeast Debaryomyces hansenii grown in a chemostat at different salinities. J Bacteriol. 1990;172(4):1769–1774. doi: 10.1128/jb.172.4.1769-1774.1990. [DOI] [PMC free article] [PubMed] [Google Scholar]
- Larsson C, Påhlman IL, Ansell R, et al. The importance of the glycerol 3-phosphate shuttle during aerobic growth of Saccharomyces cerevisiae. Yeast. 1998;14(4):347. doi: 10.1002/(SICI)1097-0061(19980315)14:4<347::AID-YEA226>3.0.CO;2-9. [DOI] [PubMed] [Google Scholar]
- Lei Y, Jie QL, Li YH. The study on the treatment of high salinity wastewater. Environ Sci Manag. 2007;32(6):94–98. [Google Scholar]
- Li B, Dewey CN. RSEM: accurate transcript quantification from RNA-Seq data with or without a reference genome. BMC Bioinform. 2011;12(1):323. doi: 10.1186/1471-2105-12-323. [DOI] [PMC free article] [PubMed] [Google Scholar]
- Maeda T, WurglerMurphy SM, Saito H. A two-component system that regulates an osmosensing MAP kinase cascade in yeast. Nature. 1994;369(6477):242–245. doi: 10.1038/369242a0. [DOI] [PubMed] [Google Scholar]
- Meikle AJ, Reed RH, Gadd GM. The osmotic responses of Saccharomyces cerevisiae in K(+)-depleted medium. FEMS Microbiol Lett. 1991;62(1):89–93. doi: 10.1016/0378-1097(91)90261-8. [DOI] [PubMed] [Google Scholar]
- Min HC, Yun HP. Growth of Pichia guilliermondii, A9, an osmotolerant yeast, in waste brine generated from kimchi production. Biores Technol. 1999;70(3):231–236. [Google Scholar]
- Nevoigt E, Stahl U. Osmoregulation and glycerol metabolism in the yeast Saccharomyces cerevisiae. FEMS Microbiol Rev. 2010;21(3):231–241. doi: 10.1111/j.1574-6976.1997.tb00352.x. [DOI] [PubMed] [Google Scholar]
- Nguyen HT, Dieterich A, Athenstaedt K, et al. Engineering of Saccharomyces cerevisiae for the production of l-glycerol 3-phosphate. Metab Eng. 2004;6(2):155–163. doi: 10.1016/j.ymben.2004.02.005. [DOI] [PubMed] [Google Scholar]
- Pavlik P, Simon M, Schuster T, et al. The glycerol kinase (GUT1) gene of Saccharomyces cerevisiae: cloning and characterization. Curr Genet. 1993;24(1–2):21–25. doi: 10.1007/BF00324660. [DOI] [PubMed] [Google Scholar]
- Posas F, Takekawa M, Saito H. Signal transduction by MAP kinase cascades in budding yeast. Curr Opin Microbiol. 1998;1(2):175–182. doi: 10.1016/s1369-5274(98)80008-8. [DOI] [PubMed] [Google Scholar]
- Proft M, Serrano R. Repressors and upstream repressing sequences of the stress-regulated ENA1 gene in Saccharomyces cerevisiae: bZIP protein Sko1p confers HOG-dependent osmotic regulation. Mol Cell Biol. 1999;19(1):537–546. doi: 10.1128/mcb.19.1.537. [DOI] [PMC free article] [PubMed] [Google Scholar]
- Raman M, Chen W, Cobb MH. Differential regulation and properties of MAPKs. Oncogene. 2007;26(22):3100–3112. doi: 10.1038/sj.onc.1210392. [DOI] [PubMed] [Google Scholar]
- Shilo M, editor. Strategies of microbial life in extreme environments. Weinheim, New York: Verlag Chemie; 1979. [Google Scholar]
- Singh KK, Norton RS. Metabolic changes induced during adaptation of Saccharomyces cerevisiae, to a water stress. Arch Microbiol. 1991;156(1):38–42. doi: 10.1007/BF00418185. [DOI] [PubMed] [Google Scholar]
- Thorsen M, Di Y, Tängemo C, et al. The MAPK Hog1p modulates Fps1p-dependent arsenite uptake and tolerance in yeast. Mol Biol Cell. 2006;17(10):4400. doi: 10.1091/mbc.E06-04-0315. [DOI] [PMC free article] [PubMed] [Google Scholar]
- Trapnell C, Williams BA, Pertea G, et al. Transcript assembly and quantification by RNA-Seq reveals unannotated transcripts and isoform switching during cell differentiation. Nat Biotechnol. 2010;28(5):511–515. doi: 10.1038/nbt.1621. [DOI] [PMC free article] [PubMed] [Google Scholar]
- Tunbladjohansson I, Adler L. Effects of sodium chloride concentration on phospholipid fatty acid composition of yeasts differing in osmotolerance. FEMS Microbiol Lett. 2010;43(3):275–278. [Google Scholar]
- Wang YQ, Tao T. Compatible solutes in microbial osmotic pressure regulation. Microbiol China. 1994;34(5):355–359. [Google Scholar]
- Wang ZX, Zhu GJ. Osmotic regulation and glycerol metabolism in yeast. China Biotechnol. 1999;19(5):34–39. [Google Scholar]
- Woolard CR, Irvine RL. Treatment of hypersaline wastewater in the sequencing batch reactor. Water Res. 1995;29(4):1159–1168. [Google Scholar]
- Young MD, Wakefield MJ, Smyth GK, et al. Gene ontology analysis for RNA-seq: accounting for selection bias. Genome Biol. 2010;11(2):R14. doi: 10.1186/gb-2010-11-2-r14. [DOI] [PMC free article] [PubMed] [Google Scholar]
- Zhang SW. The influence of different concentrations of domestic sewage on growth of seedlings of Kandelia candel. Jiamusi Jiaoyu Xueyuan Xuebao (Journal of Jiamusi Education Institute) 2014;3:439–441. [Google Scholar]
- Zhang YD, Very AA, Wang LM, et al. A K+ channel from salt-tolerant melon inhibited by Na+ New Phytol. 2011;189(3):856–868. doi: 10.1111/j.1469-8137.2010.03526.x. [DOI] [PubMed] [Google Scholar]
- Zhang X, Zhou Y, Zhang N. Short-term and long-term effects of Zn (II) on the microbial activity and sludge property of partial nitrification process. Biores Technol. 2017;228:315. doi: 10.1016/j.biortech.2016.12.099. [DOI] [PubMed] [Google Scholar]
- Zhu GJ, Wang ZX. The HOG pathway and glycerol synthesis in yeast. Acta Microbiol Sin. 1999;39(1):91–93. [PubMed] [Google Scholar]
Associated Data
This section collects any data citations, data availability statements, or supplementary materials included in this article.


