

Abstract
Aim
To examine the impact of structured self‐monitoring of blood glucose, with or without TeleCare support, on glycaemic control in people with sub‐optimally controlled Type 2 diabetes.
Methods
We conducted a 12‐month, multicentre, randomized controlled trial in people with established (>1 year) Type 2 diabetes not on insulin therapy, with sub‐optimal glycaemic control [HbA1c ≥58 to ≤119 mmol/mol (≥7.5% to ≤13%)]. A total of 446 participants were randomized to a control group (n =151) receiving usual diabetes care, a group using structured self‐monitoring of blood glucose alone (n =147) or a group using structured self‐monitoring of blood glucose with additional monthly ‘TeleCare’ support (n =148). The primary outcome was HbA1c at 12 months.
Results
A total of 323 participants (72%) completed the study; 116 (77%) in the control group, 99 (67%) in the self‐monitoring of blood glucose alone group and 108 (73%) in the self‐monitoring of blood glucose plus TeleCare group. Compared to baseline, the mean HbA1c was lower in all groups at 12 months, with reductions of 3.3 mmol/mol (95% CI –5.71 to –0.78) or 0.3% (95% CI –0.52 to –0.07; P=0.01) in the control group, 11.4 mmol/mol (95% CI –14.11 to –8.76) or 1.1% (–1.29 to –0.81; P<0.0001) in the group using self‐monitoring of blood glucose alone and 12.8 mmol/mol (95% CI –15.34 to –10.31) or 1.2% (95% CI –1.40 to ‐0.94; P<0.0001) in the group using self‐monitoring of blood glucose plus TeleCare. This represents a reduction in HbA1c of 8.9 mmol/mol (95% CI –11.97 to –5.84) or 0.8% (95% CI –1.10 to ‐0.54; P≤0.0001) with structured self‐monitoring of blood glucose compared to the control group. Participants with lower baseline HbA1c, shorter duration of diabetes and higher educational achievement were more likely to achieve HbA1c ≤53 mmol/mol (7.0%).
Conclusions
Structured self‐monitoring of blood glucose provides clinical and statistical improvements in glycaemic control in Type 2 diabetes. No additional benefit, over and above the use of structured self‐monitoring of blood glucose, was observed in glycaemic control with the addition of once‐monthly TeleCare support.
(Clinical trial registration no.: ISRCTN21390608)
What's new?
This 12‐month randomized controlled trial examined the impact of structured self‐monitoring of blood glucose (SMBG), with and without TeleCare support, on glycaemic control in people with sub‐optimally controlled Type 2 diabetes.
Results showed that this standardized, structured SMBG intervention, with or without additional TeleCare, provided statistically and clinically significant improvements in glycaemic control.
Structured SMBG should be offered as part of the self‐management process for all people with sub‐optimally controlled Type 2 diabetes, even when not treated with insulin. Unstructured SMBG (other than for safety purposes) should be regarded as a waste of valuable time and resources.
Introduction
It is recognized that self‐monitoring of blood glucose (SMBG) helps to improve glycaemic control and identify hypoglycaemia in people with Type 1 and Type 2 diabetes treated with insulin, whilst there is ongoing debate regarding the clinical benefits of using SMBG in those with Type 2 diabetes who are not on insulin therapy 1. Many studies and meta‐analyses have been conducted since the first evaluation of SMBG in 1983 2, with little consensus on the benefit, in part because of the variation in intervention regimens and study populations 3, 4, 5, 6, 7, 8, 9, 10, 11, 12, 13, 14, 15, 16, 17, 18. In 2009, the International Diabetes Federation guidelines on SMBG use in non‐insulin‐treated Type 2 diabetes presented evidence supporting structured blood glucose (BG) monitoring combined with appropriate action 19. This emphasized the need for both healthcare professionals and people with Type 2 diabetes to be suitably informed and willing to conduct and incorporate paired (pre‐ and postprandial) BG profiles into diabetes care plans. Despite additional evidence in support of structured SMBG 8, SMBG is still being introduced into clinical trials and practice in an unstructured way, with little benefit 20. Currently, regulatory authorities recommend limiting the use of SMBG in people with Type 2 diabetes not on insulin therapy to testing for hypoglycaemia, limiting SMBG to a safety role instead of it being an integral part of self‐management 21, 22.
The concept of telemedicine, that is using telecommunications to deliver health services, has become increasingly popular, and many studies have incorporated features of telemedicine into studies on diabetes management showing improvement in glycaemic control when compared to usual care 23. The form of communication used and level of interactivity are thought to have an impact on the effectiveness of the telemedicine intervention, with methods allowing two‐way communication between the healthcare provider/person with diabetes proving more successful.
We conducted a randomized controlled trial (RCT) to determine if the use of structured SMBG in a large population of people with Type 2 diabetes not on insulin therapy would improve HbA1c over 12 months, compared to a control group receiving usual care as per NICE guidelines, and also whether the addition of a monthly telephone consultation with a trained study nurse (TeleCare) provided additional glycaemic benefit.
Participants and methods
Full details of the study protocol have been published previously 24. In brief, the SMBG Study was an open, multicentre RCT. Participants had sub‐optimally controlled Type 2 diabetes, were not receiving insulin therapy and were involved in the study for 12 months after randomization to one of three groups: a control group, a group performing SMBG alone or a group performing SMBG and receiving TeleCare (Fig. 1). The study was conducted across 16 sites, nine of which were general practices and seven of which were based within hospitals across Wales and England. All participants remained under the care of their general practitioner (GP) throughout the course of the study, and medication changes were prescribed by the GP when recommended by the local study team.
Figure 1.
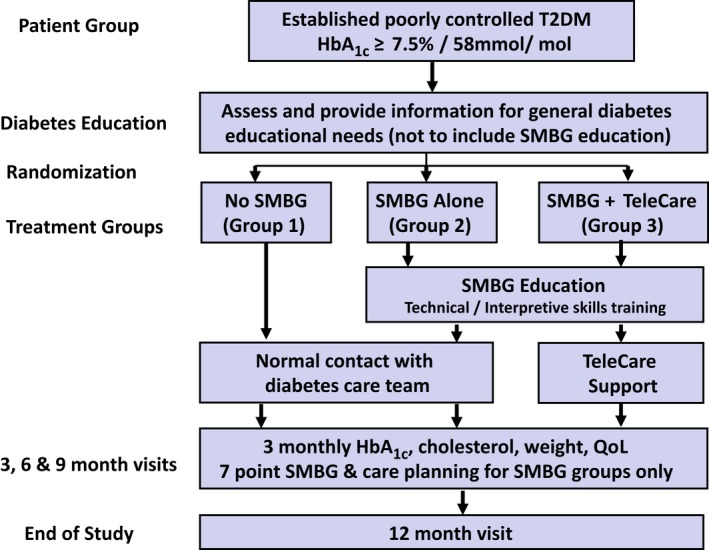
Study design flow chart. QoL, quality of life; SMBG, self‐monitoring of blood glucose; T2DM, type 2 diabetes.
The South East Wales Research Ethics Committee (Panel C) gave ethical approval for the study (Ref. 10/WSE03/50).
Participants
Participants were aged between 18 and 80 years, having been diagnosed with Type 2 diabetes for at least 1 year. HbA1c at baseline was 58 to 119 mmol/mol (7.5–13%) and participants were not receiving insulin therapy. Those who, in the opinion of their GP, needed to monitor their BG for clinical reasons were excluded from the study, but those using SMBG for safety reasons, in line with UK Driver and Vehicle Licensing Agency guidance, were eligible to be enrolled.
Procedures
The study procedures are shown in Fig. 1. Written informed consent was provided by all participants prior to any study activities taking place, following a full written and oral explanation of the study. Randomization was performed remotely by Swansea Trials Unit via email using a central database. Study site and previous experience of using SMBG (Yes/No) were used as stratifying factors for randomization. The allocation sequence was generated dynamically to maintain an approximate balance of 1:1:1 across the three groups overall. The participants randomized to the control group (Group 1) received their usual care and had contact with their diabetes team, GP or hospital clinic, as normal. Routine HbA1c results were used to facilitate glycaemic management by their GP as per usual care. All participants attended the 3‐monthly study visits, which involved collecting clinical data, taking a blood sample to measure HbA1c and total cholesterol levels, the completion of participant‐reported outcome measures (not reported in the present paper) and review of the participant diary in which significant events, medication changes and contact with healthcare professionals were recorded. General diabetes education was provided by a study nurse during the baseline visit after all questionnaires had been completed and prior to randomization. The study nurses used the ‘Your Guide to Type 2 Diabetes’ education booklet produced by Diabetes UK for people living with diabetes to ensure consistency of information 25. The booklet provided an explanation of Type 2 diabetes and an overview of how the various diabetes medications work and how they should be taken. It also provided information on BG control, food, weight management, living well with diabetes and complications. Study nurses went through the booklet with each participant, highlighting information relevant to the individual and answering any questions. The education session was tailored to the needs of each participant and took an average of 1 hour, in conjunction with the baseline visit. All participants were given a copy of the Diabetes UK booklet to keep for their personal reference and use throughout the study. Diabetes‐related questions that arose throughout the study were discussed with reference to the booklet.
Participants in the two SMBG groups (groups 2 and 3) attended an additional study visit (visit 2a) compared to those in the control group in order to undertake structured SMBG training (Fig. S1). Instruction was given on the correct method for taking and measuring BG. Thereafter, the participants were asked to measure their BG levels after fasting, 2 h after breakfast, and before and 2 h after their main meal on 2 days each week. During the week prior to the 3‐monthly study visits, participants were asked to perform a seven‐point BG profile (before and 2 h after three main meals, and at bedtime) on 3 days. At each study visit BG meters were downloaded and a calibration check carried out. All participants in the SMBG groups were offered the Accu‐Chek 360° Diabetes Management System software (as used by the study nurses) to use at home if they wished.
Participants in the SMBG groups were asked to record their BG readings on the Accu‐Chek 360° View Tool, a paper tool used to produce daily profiles of BG readings. They were shown how to interpret their SMBG results, how to identify patterns of glycaemic abnormalities and how to deal with abnormal glycaemic patterns. A stepped approach was taken, taking action to first correct any patterns of hypoglycaemia, then fasting hyperglycaemia and then post‐meal hyperglycaemia. Standardized algorithms were provided to the participants (Fig. S2) and the study nurses and physicians to guide decisions around lifestyle and/or medication adjustment (Figs S3 and S4). All actions taken in response to the BG monitoring were recorded. At each study visit, for those in the SMBG groups, glycaemic management was based on SMBG results alone, with a care plan developed for the coming month(s) in partnership between the participant and study nurse, based on the adopted algorithms.
In addition to the education and support provided to group 2 (SMBG alone) participants, those in group 3 (SMBG plus TeleCare) were contacted by telephone at an agreed time each month by their study nurse to review the previous months’ BG readings and related events. Those who chose to use the Accu‐Chek 360° software were able to download their meter to their own computer and securely email the BG results to the study nurse in advance of their TeleCare consultation. Those who chose not to use the software reported their readings verbally over the phone, which were then verified at the next study visit. At each consultation, patterns of glycaemic abnormalities were identified and explored jointly by the participant and study nurse, and a care plan was then co‐produced for the coming month which was documented by the participant in their diary.
All study nurses attended a standardized training programme delivered by the research team in addition to successfully completing an online treatment management programme (Virtual College Healthcare e‐Academy, Safe Use of Non‐Insulin Therapies). Refresher training was provided to the study staff approximately every 4 months at study update meetings.
Outcomes
The primary outcome for the study was HbA1c at 12 months in those who undertook SMBG and the control group. All blood samples were sent to a central Good Clinical Laboratory Practice accredited laboratory for analysis. All study HbA1c results remained blinded to all participants, their study team and diabetes team throughout the study. Final HbA1c results were reported after participation in the study was completed.
Secondary comparative outcomes included: HbA1c at 3, 6 and 9 months; percentage of people achieving the HbA1c target of ≤53 mmol/mol (7%) at 12 months; and total serum cholesterol, weight, BMI and waist circumference at 3, 6, 9 and 12 months. Whenever insulin therapy was required, those participants were withdrawn from further participation in the study. Outcome measures specific to the SMBG groups included confirmed episodes of BG < 4.5 mmol/l and acceptability of SMBG. In those in the SMBG groups, attitudes towards SMBG were ascertained using locally derived questionnaires at randomization (SMBG 8) and at each subsequent study visit (SMBG 14). These questionnaires contained eight and 14 items, respectively, and included questions on attitudes towards SMBG, action taken as a result of the BG readings and confidence in their ability to take action. The questionnaires were self‐completed and the responses were recorded to each item as yes/no/don't know.
Sample size
The sample size calculation has been published previously 24. Assuming an effect size of 0.333, attrition of 20% with 0.05 significance and 0.8 power, a sample size of 398 would be required to achieve the study primary aim. A conservative and pragmatic sample size of 450 (n=150 per treatment group) was adopted, which allowed an attrition rate of ~30%.
Statistical analysis
Participants who completed the study were analysed according to their allocated group. To answer the primary objective, data from the two SMBG groups were pooled for comparison with the control group, as prespecified in the statistical analysis plan. As a result of the inclusion criteria, HbA1c data were positively skewed, confirmed by residuals from a linear mixed model for repeated measures; the robustness of findings was therefore assessed using two data transformations (square root, natural log). Analyses of the transformed data led to the same conclusion regarding the intervention effect; for ease of interpretation, only the analysis of the untransformed data is reported. The primary outcome, HbA1c and all continuous secondary outcomes (total cholesterol, mean weight, BMI, mean waist circumference) were analysed using mixed models for repeated measurements with a random effect to account for variation at baseline, and correlation between repeated measures within individual participants was modelled by a first‐order autoregressive process. We considered the following potential covariates and factors: age; gender; ethnicity; education level; employment status; smoking status; duration of diabetes; presence of diabetic complications; previous use of SMBG; cholesterol level; height; weight; BMI; and waist circumference. Covariates with significant main effect and key interaction were included in the models. Multiple imputation (using iterative Markov chain Monte Carlo methods) assessed the effect of missing data on the primary comparison between the combined SMBG groups and the control group. Twenty datasets with imputed values were created post‐randomization (convergence at 400 iterations, psr<1.05). The primary comparison was undertaken in each imputed dataset separately, with estimates pooled using Rubin's rules for comparison with analysis of the original data.
All randomized participants were included in the primary, secondary and safety analyses. The primary analysis of all outcomes followed the intention‐to‐treat (ITT) principle. All statistical analyses were performed with SPSS version 22 and were verified by a second independent statistician.
Results
Between December 2012 and June 2015, 446 participants met all eligibility criteria and were randomly assigned to a control, an SMBG alone or an SMBG plus TeleCare treatment group (Fig. 2). A total of 67 participants withdrew from the study after randomization and 45 were lost to follow‐up. An additional 11 participants were withdrawn as they were prescribed insulin therapy during the study (Table S1). The numbers of participants prescribed insulin were similar across the three groups (three, four and four participants in groups 1, 2 and 3, respectively). There was no significant difference in the proportions of people who left the study between the control group (23.2%, 35/151) and the combined SMBG group (29.8%, 88/295; chi‐squared =2.21, df=1, P=0.137). Neither was there a significant difference in the percentage of people leaving the study between the SMBG alone (32.7%, 48/147) and SMBG plus TeleCare group (27.0%, 40/148; chi‐squared =1.12, df=1, P=0.35). Over half of those who left the study (58%, 65/112) did so between the randomization and 3‐month visit (Fig. S5). A total of 323 participants (72%) completed the study.
Figure 2.
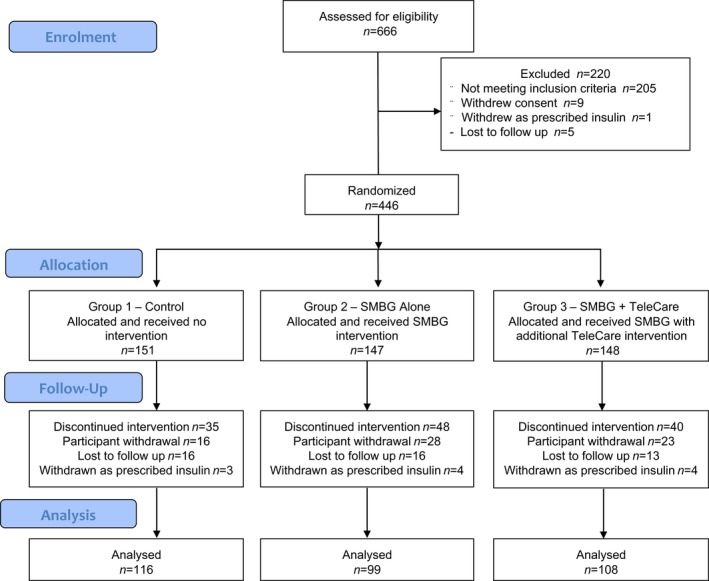
Consort diagram. SMBG, self‐monitoring of blood glucose.
Baseline characteristics for those randomized according to treatment group are included in Table 1. At the start of the study a small number of participants (6%, 25/446) were managing their diabetes through diet and exercise alone, 39% (174/446) were on monotherapy, and 55% (247/446) were taking two or more oral antidiabetic medications.
Table 1.
Baseline characteristics of the three groups at randomization
| Control (no SMBG) (n=151) | SMBG alone (n=147) | SMBG+ TeleCare (n=148) | |
|---|---|---|---|
| Age, years | 60.7 (10.98) | 62.9 (9.34) | 61.6 (9.82) |
| Men, n (%) | 88 (58) | 82 (56) | 88 (60) |
| Ethnicity: white1, n (%) | 135 (95) | 137 (99) | 133 (95) |
| Weight2, kg | 95.3 (19.42) | 95.0 (17.82) | 95.8 (20.84) |
| BMI3, kg/m² | 33.4 (6.03) | 33.5 (6.72) | 33.4 (6.66) |
| Waist circumference4, cm | 110.4 (14.09) | 109.5 (12.89) | 109.9 (13.77) |
| HbA1c, mmol/mol | 71.0 (11.74) | 69.8 (11.83) | 70.8 (12.53) |
| HbA1c, % | 8.7 (1.07) | 8.5 (1.08) | 8.6 (1.15) |
| Total cholesterol5, mmol/l | 4.7 (1.42) | 4.8 (1.31) | 4.5 (1.32) |
| Education6, n (%) | |||
| None | 37 (25) | 24 (16) | 29 (20) |
| O’ level stage | 37 (25) | 51 (35) | 41 (28) |
| Further education | 23 (15) | 27 (19) | 25 (17) |
| Higher education | 50 (33) | 37 (25) | 47 (32) |
| Other | 4 (3) | 7 (5) | 6 (4) |
| Employment7, n (%) | |||
| Employed | 57 (38) | 36 (25) | 43 (29) |
| Self‐employed | 17 (11) | 7 (5) | 9 (6) |
| Unemployed | 9 (6) | 14 (10) | 12 (8) |
| Retired | 68 (45) | 90 (61) | 83 (57) |
| Smoker8, n (%) | |||
| Yes | 16 (11) | 23 (16) | 19 (13) |
| No | 79 (52) | 72 (49) | 71 (48) |
| Previously | 56 (37) | 51 (35) | 58 (39) |
| Duration of diabetes, n (%) | |||
| 1 to 3 years | 30 (20) | 20 (14) | 28 (19) |
| 3 to 5 years | 29 (19) | 32 (22) | 23 (16) |
| 5 to 10 years | 53 (35) | 47 (32) | 55 (37) |
| >10 years | 39 (26) | 48 (33) | 42 (28) |
| Ever used SMBG, n % yes | 103 (68) | 104 (71) | 103 (70) |
| Diabetic complications: yes9, n (%) | 24 (16) | 35 (25) | 28 (19) |
| Diabetes medications10, n (%) | |||
| Monotherapy | 63 (42) | 54 (37) | 57 (39) |
| Dual therapy | 56 (37) | 50 (34) | 55 (37) |
| Triple therapy | 25 (17) | 29 (20) | 28 (19) |
| 4+ medications | 2 (1) | 0 | 2 (1) |
| No diabetes medications (diet only) | 5 (3) | 14 (9) | 6 (4) |
| Diabetes knowledge | |||
| Percent with correct answers to ADKnowl Q | 64.7 (25.2) | 66.2 (25.2) | 65.5 (25.3) |
ADKnowl Q, Audit of Diabetes Knowledge questionnaire.
Data are mean (sd), unless otherwise indicated.
Missing data: ethnicity, n = 25; weight, n = 18; BMI, n = 13; waist circumference, n = 22; total cholesterol, n = 3; education, n = 1; employment, n = 1; smoking, n = 1; complication, n = 11; and medication, n = 2.
Primary outcome measure
HbA1c levels decreased throughout the study in all three groups; it decreased from 71 mmol/mol (8.7%) to 67 mmol/mol (8.3%) in the control group and from 70 mmol/mol (8.6%) to 57 mmol/mol (7.4%) in the combined SMBG group. At 12 months, there was a greater reduction in mean HbA1c in the combined SMBG group of 12.2 mmol/mol (1.1%) compared to 3.3 mmol/mol (0.3%) in the control group, with the difference being significant, after adjusting for age at screening, gender, total cholesterol, BMI and duration of diabetes (P<0.0001; Fig 3a). The estimated treatment difference between the combined SMBG group and the control group was 8.9 mmol/mol (95% CI –11.97 to –5.84) or 0.8% (95% CI –1.10 to –0.54; P<0.0001). There was no significant difference, however, in HbA1c reduction at 12 months between the two SMBG groups (P=0.458; Table 2 and Fig 3b). The pooled estimate from the 20 imputed datasets showed similar findings. HbA1c analysis are presented in Table 2 and Table S2.
Figure 3.
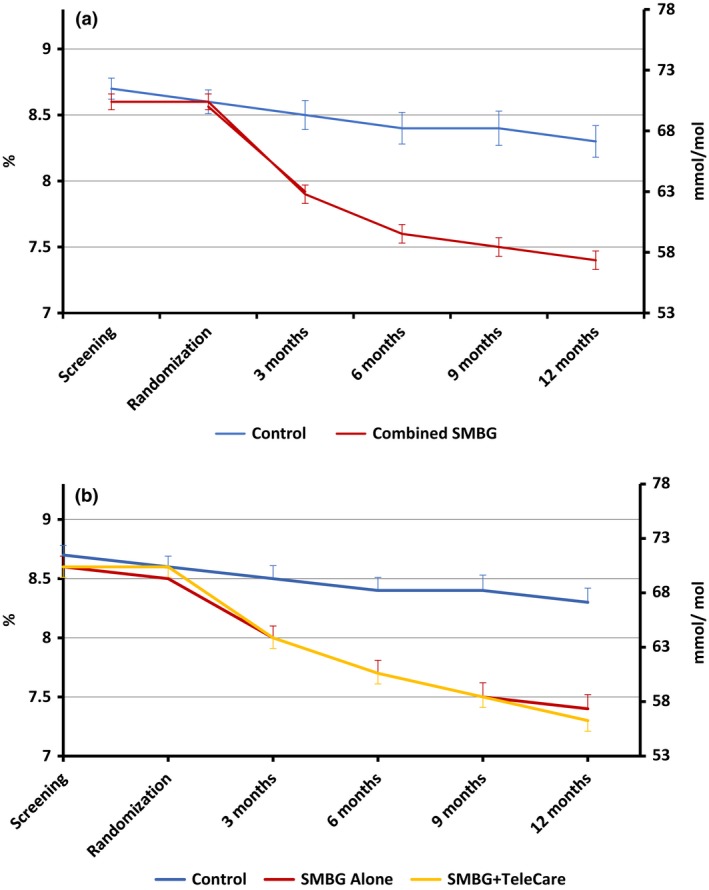
Comparison of mean (sem) HbA1c between (a) the control and combined SMBG groups and (b) the three groups over the 12‐month study period.
Table 2.
Primary outcomes by treatment group
| Changes from baseline (95% CI) | Estimated treatment difference (95% CI) | |||||||||
|---|---|---|---|---|---|---|---|---|---|---|
| Control (No SMBG) | SMBG Alone | SMBG + TeleCare | SMBG Alone − Control | P value | SMBG + TeleCare − Control | P value | SMBG + TeleCare − SMBG Alone | P value | ||
| At 3 months mmol /mol | −1.88 (−3.48 to −0.28) | −5.42 (−7.14 to −3.70) | −7.05 (−8.73 to −5.36) | −3.54 (−5.89 to −1.19) | <0.0001 | −5.17 (−7.49 to −2.85) | <0.0001 | −1.63 (−4.03 to 0.78) | 0.184 | |
| At 3 months % | −0.17 (−0.32 to −0.03) | −0.49 (−0.65 to − 0.34) | −0.64 (−0.80 to −0.49) | −0.32 (−0.53 to −0.10) | 0.004 | −0.47 (−0.68 to −0.25) | <0.0001 | −0.15 (−0.37 to 0.07) | 0.188 | |
| At 6 months mmol /mol | −2.37 (−4.40 to −0.34) | −8.35 (−10.54 to −6.16) | −10.26 (−12.37 to −8.16) | −5.98 (−8.96 to −3.00) | <0.0001 | −7.89 (−10.82 to −4.97) | <0.0001 | −1.91 (−4.95 to 1.12) | 0.217 | |
| At 6 months % | −0.22 (−0.40 to −0.03) | −0.76 (−0.96 to −0.56) | −0.93 (−1.12 to −0.74) | −0.54 (−0.81 to −0.26) | 0.0001 | −0.71 (−0.98 to −0.44) | <0.0001 | −0.17 (−0.45 to 0 .10) | 0.217 | |
| At 9 months mmol /mol | −1.70 (−3.99 to 0.59) | −10.19 (−12.62 to −7.77) | −10.97 (−13.33 to −8.61) | −8.50 (−11.83 to −5.17) | <0.0001 | −9.27 (−12.56 to −5.98) | <0.0001 | −0.78 (−4.16 to 2.61) | 0.653 | |
| At 9 months % | −0.16 (−0.37 to 0.05) | −0.93 (−1.15 to −0.71) | −1.01 (−1.22 to −0.79) | −0.77 (−1.07 to −0.47) | <0.0001 | −0.85 (−1.15 to −0.55) | <0.0001 | −0.08 (−0.39 to 0.23) | 0.608 | |
| At 12 months mmol /mol | −3.25 (−5.71 to −0.78) | −11.44 (−14.11 to −8.76) | −12.82 (−15.34 to −10.31) | −8.19 (−11.82 to −4.56) | <0.0001 | −9.58 (−13.10 to −6.06) | <0.0001 | −1.39 (−5.06 to 2.28) | 0.458 | |
| At 12 months % | −0.30 (−0.52 to − 0.07) | −1.05 (−1.29 to −0.81) | −1.17 (−1.40 to −0.94) | −0.75 (−1.08 to −0.42) | <0.0001 | −0.87 (−1.19 to −0.55) | <0.0001 | −0.12 (−0.45 to 0.21) | 0.477 | |
Data are mean (95% CI), treatment difference (95% CI). HbA1c levels were analysed using a mixed model for repeated measurements. Significant covariates were age, gender, cholesterol, BMI and duration of diabetes.
Secondary outcomes
Of the 446 participants, 113 (25.3%) reached the target HbA1c of ≤53 mmol/mol (≤7%) at 12 months, with significantly more participants in the combined SMBG group than in the control group reaching the target (control group = 20/151, 13.2%; combined SMBG = 93/295, 31.5%; chi‐squared =17.64, df=1, P <0.0001); however, the percentage of people achieving the target was similar for the SMBG alone (46/147, 31.3%) and the SMBG plus TeleCare groups (47/148, 31.8%; chi‐squared =0.007, df=1, P=0.93). Participants with a lower baseline HbA1c concentration [hazard ratio (HR) 1.58, 95% CI 1.28 to 1.97; P<0.0001], duration of diabetes of < 5 years (HR 1.54, 95% CI 1.06 to 2.23; P=0.024) and higher education status (HR 1.57, 95% CI 1.07 to 2.30; P=0.02) were more likely to achieve the target HbA1c of ≤53 mmol/mol (≤7%) at 12 months.
After adjusting for baseline HbA1c concentration, duration of diabetes and attainment of higher education, the probability (HR) of participants achieving HbA1c ≤53 mmol/mol (≤7%) within 12 months was 3.23 (95% CI 1.99 to 5.24; P<0.0001) times higher in the combined SMBG group compared to the control group (Fig. S6). There was no significant difference between the SMBG alone and the SMBG plus TeleCare group [HR 0.93, 95% CI 0.62 to 1.40; P=0.72 (Fig 4)].
Figure 4.
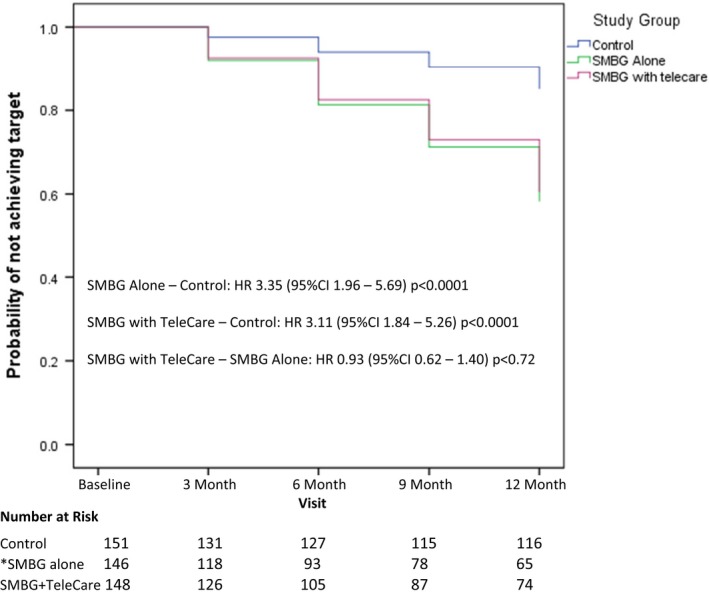
Achieving a target HbA1c ≤53 mmol/mol (7%). The graph shows time interval to event (achieving HbA1c ≤7% without relapse). Significant covariates were HbA1c concentrations at baseline, duration with diabetes and attainment of higher education. *One missing value with one of the significant covariates: education. HR, hazard ratio; SMBG, self‐monitoring of blood glucose.
Analyses of secondary outcomes are summarized in Table 3. There was a statistically significant but not clinically relevant reduction in total cholesterol levels at 3 months (–0.28 mmol/l, 95% CI –0.50 to –0.05; P=0.017) and in waist circumference at 12 months (–1.16 cm; 95% CI –2.25 to –0.07; P=0.037) between the control group and the combined SMBG group (Table S3).
Table 3.
Secondary outcomes by treatment group
| Changes from baseline (95% CI) | Estimated treatment difference (95% CI) | ||||||||
|---|---|---|---|---|---|---|---|---|---|
| Control (no SMBG) | SMBG alone | SMBG+ TeleCare | SMBG alone – control | P | SMBG+ TeleCare – Control | P | SMBG+ TeleCare ‐ SMBG alone | P | |
| Total cholesterol*, mmol/l | |||||||||
| At 3 months |
0.12 (–0.06 to 0.30) |
–0.31 (–0.50 to –0.12) |
–0.01 (–0.20 to 0.18) |
–0.43 (–0.69 to –0.17) |
0.001 |
–0.12 (–0.39 to 0.14) |
0.352 |
0.31 (0.04 to 0.57) |
0.026 |
| At 6 months |
0.01 (–0.19 to 0.21) |
‐0.25 (–0.46 to –0.03) |
‐0.02 (–0.23 to 0.18) |
–0.26 (–0.55 to 0.04) |
0.087 |
–0.03 (–0.32 to 0.26) |
0.839 |
0.23 (–0.07 to 0.52) |
0.139 |
| At 9 months |
–0.17 (–0.38 to 0.04) |
‐0.27 (–0.49 to –0.05) |
0.01 (–0.20 to 0.22) |
‐0.10 (–0.41 to 0.20) |
0.509 |
0.18 (–0.12 to 0.48) |
0.230 |
0.29 (–0.02 to 0.59) |
0.069 |
| At 12 months |
–0.08 (–0.29 to 0.13) |
‐0.35 (–0.57 to –0.12) |
0.03 (–0.18 to 0.25) |
–0.26 (–0.57 to 0.04) |
0.088 |
0.11 (–0.19 to 0.41) |
0.463 |
0.38 (0.07 to 0.69) |
0.017 |
| Mean weight (kg)† | |||||||||
| At 3 months |
–0.68 (–1.12 to –0.24) |
–1.28 (–1.76 to –0.80) |
–0.96 (–1.42 to –0.49) |
–0.60 (–1.25 to 0.05) |
0.071 |
–0.28 (–0.92 to 0.36) |
0.397 |
0.32 (–0.35 to 0.99) |
0.343 |
| At 6 months |
–1.07 (–1.62 to –0.52) |
‐1.66 (–2.26 to –1.06) |
–1.09 (–1.66 to –0.51) |
–0.59 (–1.40 to 0.23) |
0.157 |
‐0.02 (‐0.81 to 0.78) |
0.969 |
0.57 (‐0.26 to 1.40) |
0.176 |
| At 9 months |
–1.46 (–2.07 to –0.86) |
–1.53 (–2.19 to –0.87) |
‐1.15 (–1.78 to –0.52) |
–0.06 (–0.96 to 0.83) |
0.888 |
0.31 (–0.56 to 1.19) |
0.483 |
0.38 (–0.53 to 1.29) |
0.813 |
| At 12 months |
–1.55 (–2.19 to –0.92) |
–2.13 (–2.83 to –1.43) |
–1.47 (–2.13 to –0.81) |
–0.58 (–1.52 to 0.36) |
0.227 |
0.09 (–0.83 to 1.00) |
0.853 |
0.66 (–0.29 to 1.62) |
0.171 |
| Mean BMI (kg/m2)‡ | |||||||||
| At 3 months |
–0.19 (–0.37 to –0.01) |
–0.46 (–0.65 to –0.26) |
–0.25 (–0.44 to –0.06) |
–0.27 (–0.53 to –0.00) |
0.050 |
–0.05 (–0.31 to 0.21) |
0.683 |
0.21 (–0.06 to 0.48) |
0.128 |
| At 6 months |
‐0.36 (–0.57 to –0.15) |
‐0.61 (–0.84 to –0.37) |
‐0.38 (–0.60 to –0.16) |
‐0.24 (–0.56 to 0.07) |
0.127 |
–0.02 (–0.32 to 0.29) |
0.913 |
0.23 (–0.09 to 0.55) |
0.162 |
| At 9 months |
‐0.46 (–0.69 to –0.24) |
‐0.48 (–0.73 to –0.23) |
‐0.42 (–0.65 to –0.18) |
‐0.01 (–0.35 to 0.32) |
0.935 |
0.05 (–0.28 to 0.37) |
0.781 |
0.06 (–0.28 to 0.40) |
0.728 |
| At 12 months |
–0.49 (–0.73 to –0.25) |
–0.77 (–1.04 to –0.51) |
–0.39 (–0.64 to –0.15) |
–0.28 (–0.64 to 0.07) |
0.114 |
0.09 (–0.24 to 0.43) |
0.586 |
0.38 (0.02 to 0.73) |
0.037 |
| Mean waist circumference (cm)§ | |||||||||
| At 3 months |
0.33 (–0.43 to 1.09) |
0.60 (–0.23 to 1.43) |
‐0.42 (–1.22 to 0.38) |
0.26 (–0.86 to 1.39) |
0.644 |
–0.76 (–1.86 to 0.35) |
0.179 |
–1.02 (–2.17 to 0.13) |
0.082 |
| At 6 months |
0.49 (–0.33 to 1.31) |
0.12 (–0.78 to 1.02) |
–0.59 (–1.44 to 0.26) |
–0.37 (–1.59 to 0.85) |
0.551 |
–1.08 (–2.26 to 0.11) |
0.074 |
–0.71 (–1.94 to 0.53) |
0.261 |
| At 9 months |
0.11 (‐0.74 to 0.96) |
‐0.78 (‐1.70 to 0.13) |
‐0.76 (‐1.63 to 0.11) |
‐0.89 (‐2.14 to 0.35) |
0.159 |
‐0.88 (‐2.09 to 0.34) |
0.157 |
0.02 (‐1.24 to 1.28) |
0.977 |
| At 12 months |
–0.30 (–1.18 to 0.57) |
–1.32 (–2.28 to –0.36) |
–1.59 (–2.48 to –0.70) |
–1.02 (–2.32 to 0.28) |
0.123 |
–1.29 (–2.53 to –0.04) |
0.043 |
–0.27 (–1.57 to 1.04) |
0.689 |
Data are mean (95% CI), treatment difference (95% CI). Total cholesterol, weight, BMI and waist circumference were analysed using mixed models for repeated measurements. Significant covariates included in the models were: *total cholesterol: age, gender and current smoker; †weight: age, gender, height, waist and duration of diabetes; ‡BMI: gender, duration of diabetes and waist; §waist circumference: gender, BMI and non‐smoker.
For those who completed the study, the overall number of diabetes medications prescribed increased over the study period in 131 participants (40.6%), with 188 (58.2%) remaining on the same total number of medications. A few participants (4, 1.2%) in the SMBG alone group completed the study taking fewer diabetes medications than at baseline (Table 4). The SMBG participants were more likely to have the number of medications increased during the study (chi‐squared =12.63, df=1, P<0.0001) in contrast to those in the control group who were more likely to remain on the same total number of diabetes medications (chi‐squared =15.02, df=1, P<0.001). The total number of diabetes medications prescribed increased by 146, with the largest proportion being dipeptidyl peptidase‐4 inhibitors (17.0%) and sodium‐glucose co‐transporter‐2 inhibitors (13.3%; Table S4). The mean (sd) number of medications increased in all three groups, from 1.7 at baseline to 2.0 (0.89) in the control group, 2.1 (0.96) in the SMBG alone group and 2.4 (0.73) in the SMBG plus TeleCare group by the end of the study period.
Table 4.
Number of people with medication changes during the study
| Completers only | All participants n=323 | Control n=116 | SMBG alone n=99 | SMBG + TeleCare n=108 |
|---|---|---|---|---|
| Participants whose total number of diabetes medications remained the same, n (%) | 188 (58.2) | 84 (72.4) | 50 (50.5) | 54 (50) |
| Participants whose total number of diabetes medications increased, n (%) | 131 (40.6) | 32 (27.6) | 45 (45.5) | 54 (50) |
| Participants whose total number of diabetes medications decreased, n (%) | 4 (1.2) | 0 | 4 (4) | 0 |
Engagement with the SMBG regimen
Adherence to the SMBG regimen, defined as having ≥ 80% of expected total SMBG readings, was seen in 71% of the participants who completed the study, and 80% of those who completed also undertook paired testing, defined as two or more readings in one day (Table 5). Those who completed the study took part in an average of six TeleCare consultations over 12 months, with each TeleCare meeting lasting a mean of 30 min. A large percentage of those assigned to either of the SMBG groups (92.8%, 270/291) considered SMBG a useful way of managing their diabetes at randomization. This increased to 96.5% (193/200) of those performing SMBG at study completion (after 12 months). The number of participants who said they would prefer not to self‐monitor reduced over time from 37 (12.7%) at randomization to 14 (7.0%) at 12 months. The number of participants who found monitoring made them anxious decreased over time from eight (3.4%) at 3 months to three (1.5%) at 12 months, although there was an increase from eight (3.4%) at 3 months to 10 (5.0%) at 12 months in those who found the act of monitoring painful. By study completion, 88% of those using SMBG said they felt confident to make lifestyle changes, with 83% saying they had made lifestyle changes as a result of monitoring their BG profiles.
Table 5.
Engagement with the SMBG regimen
| Completers only | Combined SMBG n=207 | SMBG alone n=99 | SMBG +TeleCare n=108 |
|---|---|---|---|
| No BG meter readings (missing data), n (%) | 4 (1.9) | 2 (2.0) | 2 (1.9) |
| Adherence ≥80% total readings*, n (%) | 148 (71.5) | 68 (68.7) | 80 (74.1) |
| Adherence paired testing† ≥80%, n (%) | 166 (80.2) | 76 (76.7) | 90 (83.3) |
BG, blood glucose.
*Total number of BG readings taken if testing regimen followed for 12‐month period.
†Two or more BG readings per day.
Within the SMBG groups 1032 episodes of BG levels <4.5 mmol/l were recorded by 130 participants (44%); the mean number of episodes was 3, and the median (range) was 0 (0–61) episodes (Table S5). Using the current clinical definition of hypoglycaemia of <4.0 mmol/l 26, 328 episodes were reported by 86 participants (29%); the mean number of episodes was 1, and the median (range) was 0 (0–27) episodes, while 13 episodes of clinically significant hypoglycaemia (BG < 3.0 mmol/l) were recorded by 10 participants (3%); the mean number of episodes was 0.04, and the median (range) was 0 (0–2) episodes. There were no recorded episodes of severe hypoglycaemia requiring third‐party assistance.
Adverse events
No related and unexpected serious adverse events were reported within the study period. A total of 18 serious adverse events were reported from 10 sites; these were considered to be unrelated to the study. The HbA1c results from the control group were monitored for deterioration by the Data Monitoring Committee and as a result, 18 participants in the control group were notified to their GP via their local study team as their HbA1c had deteriorated by ≥15% over a 6‐month period. Two of these participants were reported on two separate occasions. At no time was the actual HbA1c result reported, only that there was deterioration. Fifteen of the 18 participants in the control group whose GP was notified continued and completed the study. The remaining three were lost to follow‐up.
Discussion
The present RCT showed that structured SMBG reduced HbA1c at 12 months by a statistically and clinically significant degree compared to a control group receiving usual care not involving SMBG. Importantly, participants in the structured SMBG group were three times more likely to reach the HbA1c target of ≤53 mmol/mol (≤7%) than those receiving standard care. Those participants with a lower baseline HbA1c and shorter duration of diabetes were more likely to achieve the target. Providing additional monthly TeleCare support, as described, did not achieve any additional significant improvement in glycaemic control over and above that seen in the structured SMBG‐only group, but there was a significant difference when compared to the control group.
The findings from this RCT are in line with those studies in people with Type 2 diabetes with sub‐optimal control whilst not on insulin therapy that have also employed structured SMBG, having defined the timing and frequency of SMBG and utilisation of results for adjustment of management 27. The present study showed a reduction in HbA1c of just over 12 mmol/mol (1%) when structured SMBG is used, which is comparable to the reduction in HbA1c after the addition of an oral antidiabetic agent 28. This is a larger change than the majority of previous studies included in several meta‐analyses which showed only a moderate improvement in HbA1c, with a difference of <0.5% between SMBG and usual care 14. A closer critique identified considerable heterogeneity among the former studies, particularly in terms of the populations studied and interventions used 29; however, other studies that have used structured SMBG have also shown benefit with regard to glycaemic control and quality of life, and a reduction in depression and distress 7, 8, 30. The increase in antidiabetic medication prescribed to the SMBG cohort over the course of the present study illustrates the potential of obtaining and using BG profiles to facilitate a more targeted approach to prescribing and to overcome the issue of clinical inertia in the treatment of hyperglycaemia in Type 2 diabetes 31. The relatively early improvement in glycaemic control (HbA1c reduction of ~0.5% compared to the control group) during the initial 3‐month period suggests that lifestyle changes (diet, physical fitness) must have been a major contributor. Structured SMBG, in the form of paired BG testing, allowed the participants to become quickly aware of the impact of different dietary intake on their BG profiles. They were therefore better able to adjust their food and drink intake, along with adjusting physical activity, as part of a ‘self‐learning’ process, thereby increasing their self‐confidence and providing the basis of a more meaningful consultation with their healthcare professionals.
The SMBG schedule employed was designed to be a reasonable balance between not being too onerous whilst providing sufficient BG profiles to enable meaningful management decisions to be made. Despite this intention, 24% of all study withdrawals in the SMBG groups were attributable to difficulty adhering to the prescribed testing regimen. The minimum testing frequency required to maintain engagement whilst producing relevant information on which to base self‐management decisions needs to be determined on an individual basis. The additional TeleCare support provided to those undertaking structured SMBG did not achieve a further improvement in HbA1c compared to those undertaking structured SMBG alone; however, there was a significant difference in HbA1c compared to the control group, which is consistent with other studies in a recent meta‐analysis comparing the use of TeleCare to usual care in the management of glycaemic control 23. That review concluded that telemedicine had the greatest effect when introduced to those with higher HbA1c levels and when used to facilitate medication adjustment, as we observed using structured SMBG. The TeleCare support provided in the present study was monthly consultation via telephone contact, which helped to maintain engagement with the study and with the testing regime, although the glycaemic differences achieved between the groups were not statistically significant.
In conclusion, structured SMBG, i.e. using paired BG readings to generate BG profiles to identify patterns of glycaemic abnormalities and taking appropriate action when needed, should be available as part of the self‐management process for people with sub‐optimally controlled Type 2 diabetes, including those not on insulin therapy. People living with Type 2 diabetes should not be denied the option of structured SMBG. They should receive the equipment and training necessary to help them to record their BG results accurately and in a meaningful way and should be provided with the knowledge to interpret the results and take appropriate action, such as making lifestyle changes or seeking further advice. Those not able to engage fully with the procedure will be identified through regular review within the first few months and should either be offered additional support or structured SMBG can be discontinued. The present study supports the use of structured SMBG in primary care. Unstructured SMBG, other than as advised in the NICE guidance, should be regarded as a waste of valuable time and resources and can no longer be justified. Healthcare policies in relation to people with sub‐optimally controlled type 2 diabetes not on insulin therapy should reflect these observations.
Funding sources
This study was funded by the European Foundation for the Study of Diabetes with additional support by way of SMBG monitoring equipment and an unrestricted grant by Roche Diabetes Care GmbH.
Competing interests
None declared.
Supporting information
Figure S1. Structured SMBG Intervention.
Figure S2. Algorithm for Participants.
Figure S3. Clinical Algorithm 1.
Figure S4. Clinical Algorithm 2.
Figure S5. Participant retention throughout the study.
Figure S6: Achieving a target HbA1c ≤53mmol/mol (7%) in the Control and Combined SMBG groups.
Table S1. Reason for study withdrawal.
Table S2. Primary outcome by treatment group.
Table S3. Secondary outcomes by treatment group.
Table S4. Oral medication prescribed at baseline and 12 months for those who completed the study.
Table S5. Episodes of hypoglycaemia.
Acknowledgements
We would like to thank all the study teams involved in the study and, in particular, Amir Ali, HoYee Cheung, Helen Cooper, Jayne Davies, Mark Davies, Simon Dobson, Tracy James, Frank Joseph, Atir Khan, Jill McKenna, Caroline Parsley, Sam Rice, Lynda Sackett, Matt Seager, Susan Seal and Melissa Van Der Bijl. The study was funded by the European Foundation for the Study of Diabetes EFSD/Lifescan Programme with additional support by way of BG monitoring equipment and an unrestricted grant by Roche Diabetes Care GmbH. The funders of the study had no role in the study design, data collection, data analysis, data interpretation, or writing of the manuscript.
Diabet. Med. 36: 578–590 (2019)
References
- 1. Machry RV, Rados DV, Gregorio GR, Rodrigues TC. Self‐monitoring blood glucose improves glycaemic control in type 2 diabetes without intensive treatment: a systematic review and meta‐analysis. Diabetes Res Clin Pract 2018; 142: 173–187. [DOI] [PubMed] [Google Scholar]
- 2. Cohen M, Zimmet P. Self‐monitoring of blood glucose levels in non‐insulin‐dependent diabetes mellitus. Med. J. Aust 1983; 2: 377–380. [DOI] [PubMed] [Google Scholar]
- 3. Davidson MB, Castellanos M, Kain D, Duran P. The effect of self‐monitoring of blood glucose concentrations on glycated hemoglobin levels in diabetic patients not taking insulin: a blinded, randomized trial. Am J Med 2005; 118: 422–425. [DOI] [PubMed] [Google Scholar]
- 4. Farmer A, Wade A, Goyder E et al Impact of self‐monitoring of blood glucose in the management of patients with non‐insulin treated diabetes: open parallel group randomised trial. BMJ 2007; 335: 132. [DOI] [PMC free article] [PubMed] [Google Scholar]
- 5. O'Kane MJ, Bunting B, Copeland M et al Efficacy of self‐monitoring of blood glucose in patients with newly diagnosed type 2 diabetes (ESMON study): randomised controlled trial. BMJ. 2008; 336: 1174. [DOI] [PMC free article] [PubMed] [Google Scholar]
- 6. Franciosi M, Lucisano G, Pellegrini F et al ROSES: role of self‐monitoring of blood glucose and intensive education in patients with Type 2 diabetes not receiving insulin. A pilot randomized clinical trial. Diabet Med 2011; 28: 789–796 [DOI] [PubMed] [Google Scholar]
- 7. Bosi E, Scavini M, Ceriello A et al Intensive structured self‐monitoring of blood glucose and glycaemic control in non‐insulin treated type 2 diabetes: the PRISMA randomised trial. Diabetes Care 2013; 36: 2887–2894. [DOI] [PMC free article] [PubMed] [Google Scholar]
- 8. Polonsky WH, Fisher L, Schikman CH et al Structured self‐monitoring of blood glucose significantly reduces A1C levels in poorly controlled, noninsulin‐treated type 2 diabetes: results from the Structured Testing Program study. Diabetes Care 2011; 34: 262–267. [DOI] [PMC free article] [PubMed] [Google Scholar]
- 9. Sarol JN, Nicodemus NA, Tan KM, Grava MB. Self‐monitoring of blood glucose as part of a multi‐component therapy among non‐insulin requiring type 2 diabetes patients: a meta‐analysis (1996‐2004) Curr Med Res Opin 2005; 21: 173–184. [DOI] [PubMed] [Google Scholar]
- 10. Jansen JP. Self‐monitoring of glucose in type 2 diabetes mellitus: a Bayesian meta‐analysis of direct and indirect comparisons. Curr Med Res Opin 2006; 22: 671–681. [DOI] [PubMed] [Google Scholar]
- 11. Poolsup N, Suksomboon N, Jiamsathi W. Systematic Review of the Benefits of Self‐Monitoring of Blood Glucose on Glycemic Control in Type 2 Diabetes Patients. Diabetes Technol Ther 2008; 10: S51–S66. [DOI] [PubMed] [Google Scholar]
- 12. Clar C, Barnard K, Cummins E, Royle P, Waugh N. Self‐monitoring of blood glucose in type 2 diabetes: systematic review. Health Technol Assess 2010; 14: 578–140. [DOI] [PubMed] [Google Scholar]
- 13. St John A, Davis WA, Price CP, Davis TM. The value of self‐monitoring of blood glucose: a review of recent evidence. J Diabetes Complications 2010; 24: 129–141. [DOI] [PubMed] [Google Scholar]
- 14. Malanda UL, Welschen LMC, Riphagen II, Dekker JM, Nijpels G, Bot SD. Self‐monitoring of blood glucose in patients with type 2 diabetes mellitus who are not using insulin. Cochrane Database Syst Rev 2012; 18: CD005060. [DOI] [PMC free article] [PubMed] [Google Scholar]
- 15. Poolsup N, Suksomboon N, Rattanasookchit S. Meta‐analysis of the benefits of self‐monitoring of blood glucose on glycemic control in type 2 diabetes patients: an update. Diabetes Technol Ther 2009; 11: 775–784. [DOI] [PubMed] [Google Scholar]
- 16. Farmer AJ, Perera R, Ward A, Heneghan C, Oke J, Barnett AH et al Meta‐analysis of individual patient data in randomised trials of self‐monitoring of blood glucose in people with noninsulin treated type 2 diabetes. BMJ 2012; 344: e486. [DOI] [PubMed] [Google Scholar]
- 17. Zhu H, Zhu Y, Leung S. Is self‐monitoring of blood glucose effective in improving glycaemic control in type 2 diabetes without insulin treatment: a meta‐analysis of randomised controlled trials. BMJ Open 2016; 6: e010524. [DOI] [PMC free article] [PubMed] [Google Scholar]
- 18. Manucci E, Antenroe A, Giorgino F, Scavini M. Effects of Structured Versus Unstructured Self‐Monitoring of Blood Glucose on Glucose Control in Patients with Type 2 Diabetes: A Meta‐Analysis of Randomized Controlled Trials. J Diabetes Sci Technol 2018; 12: 183–189. [DOI] [PMC free article] [PubMed] [Google Scholar]
- 19. International Diabetes Federation Guideline on Self‐Monitoring of Blood Glucose in Non‐Insulin Treated Type 2 Diabetes. IDF, 2009. Available at https://www.idf.org/our-activities/advocacy-awareness/resources-and-tools/85:self-monitoring-of-blood-glucose-in-non-insulin-treated-type-2-diabetes.html. Last accessed 3rd July 2018.
- 20. Young LA, Buse JB, Weaver MA, Vu MB, Mitchell CM, Blakeney T et al Glucose Self‐monitoring in Non–Insulin‐Treated Patients With Type 2 Diabetes in Primary Care Settings. A Randomized Trial. JAMA Intern Med 2017; 177: 920–929. [DOI] [PMC free article] [PubMed] [Google Scholar]
- 21. Type 2 diabetes in adults: management. NICE 2015. http://www.nice.org.uk/guidance/ng28. Last accessed January 2016.
- 22. Speight J, Browne JL, Furler JS. Testing times! Choosing wisely when it comes to monitoring type 2 diabetes. Med J Aust 2015; 203: 354–356. [DOI] [PubMed] [Google Scholar]
- 23. Faruque LI, Wiebe N, Ehteshami‐Afshar A, Liu Y, Dianati‐Maleki N, Hemmelgarn BR et al Effect of telemedicine on glycated haemoglobin in diabetes: a systematic review and meta‐analysis of randomised trials. CMAJ 2017. March; 6(189): E341–364. [DOI] [PMC free article] [PubMed] [Google Scholar]
- 24. Parsons S, Luzio S, Bain S, Harvey J, McKenna J. Khan A et al Self‐monitoring of Blood Glucose in Non‐Insulin Treated Type 2 Diabetes (The SMBG Study): study protocol for a randomised controlled trial. BMC Endocr Disord 2017; 17: 4. [DOI] [PMC free article] [PubMed] [Google Scholar]
- 25. Your Guide to Type 2 Diabetes. Diabetes UK, 2014. Available at https://cdn.shopify.com/s/files/1/1922/6045/files/11801-Type2-Core-Guide-v18-LR.pdf?15339328738015133402. Last accessed 3rd July 2018.
- 26. American Diabetes Association . Glycemic Targets: Standards of Medical Care in Diabetes—2018. Diabetes Care 2018; 41(Suppl. 1): S55–S64. [DOI] [PubMed] [Google Scholar]
- 27. Parkin CG, Buskirk A, Hinnen DA, Axel‐Schweitzer M. Results that matter: structured vs. unstructured self‐monitoring of blood glucose in type 2 diabetes. Diabetes Res Clin Pract 2012. Jul; 97:6–15. [DOI] [PubMed] [Google Scholar]
- 28. Chaudhury A, Duvoor C, Reddy Dendi VS, Kraleti S, Chada A, Ravilla R et al Clinical Review of Antidiabetic Drugs: Implications for Type 2 Diabetes Mellitus Management. Front Endocrinol. 2017; 8: 6. [DOI] [PMC free article] [PubMed] [Google Scholar]
- 29. Speight J, Browne JL, Furler J. Challenging evidence and assumptions: is there a role for self‐monitoring of blood glucose in people with type 2 diabetes not using insulin.Curr Med Res Opin 2013; 29: 161–168. [DOI] [PubMed] [Google Scholar]
- 30. Fisher L, Polonsky W, Parkin CG, Jelsovsky Z, Amstutz L, Wagner RS. The impact of blood glucose monitoring on depression and distress in insulin‐naïve patients with type 2 diabetes. Curr Med Res Opin 2011; 27(Suppl. 3): 39–46. [DOI] [PubMed] [Google Scholar]
- 31. Khunti K, Gomes MB, Pocock S, Shestakova MV, Pintat S, Fenici P et al Therapeutic inertia in the treatment of hyperglycaemia in patients with type 2 diabetes: A systematic review. Diabetes Obes Metab 2018; 20: 427–437. [DOI] [PMC free article] [PubMed] [Google Scholar]
Associated Data
This section collects any data citations, data availability statements, or supplementary materials included in this article.
Supplementary Materials
Figure S1. Structured SMBG Intervention.
Figure S2. Algorithm for Participants.
Figure S3. Clinical Algorithm 1.
Figure S4. Clinical Algorithm 2.
Figure S5. Participant retention throughout the study.
Figure S6: Achieving a target HbA1c ≤53mmol/mol (7%) in the Control and Combined SMBG groups.
Table S1. Reason for study withdrawal.
Table S2. Primary outcome by treatment group.
Table S3. Secondary outcomes by treatment group.
Table S4. Oral medication prescribed at baseline and 12 months for those who completed the study.
Table S5. Episodes of hypoglycaemia.