

Abstract
The objective of this study was to evaluate occurrence and strength of short‐term effects experienced by study participants in an actively shielded (AS) 7 tesla (7 T) magnetic resonance (MR) scanner, to compare results with earlier reports on passively shielded (PS) 7 T MR scanners, and to outline possible healthcare strategies to improve patient compliance. Study participants (n = 124) completed a web‐based questionnaire directly after being examined in an AS 7 T MR (n = 154 examinations). Most frequently experienced short‐term effects were dizziness (84%) and inconsistent movement (70%), especially while moving into or out of the magnet. Peripheral nerve stimulation (PNS)—twitching—was experienced in 67% of research examinations and showed a dependence between strength of twitches and recorded predicted PNS values. Of the participants, 74% experienced noise levels as acceptable and the majority experienced body and room temperature as comfortable. Of the study participants, 95% felt well‐informed and felt they had had good contact with the staff before the examination. Willingness to undergo a future 7 T examination was high (>90%). Our study concludes short‐term effects are often experienced during examinations in an AS 7 T MR, leaving room for improvement in nursing care strategies to increase patient compliance. Bioelectromagnetics. 2019;9999:XX–XX. © 2019 The Authors. Bioelectromagnetics Published by Wiley Periodicals, Inc.
Keywords: dizziness, peripheral nerve stimulation, motion, patient compliance, bias
INTRODUCTION
The development of magnetic resonance imaging (MRI) at ultra‐high fields (UHF; above 4 tesla [T]) has led to images of higher quality [Moser et al., 2012] and affords the possibility of obtaining new insights into the pathophysiology of disease [Moser, 2010]. Worldwide, approximately 30 passively shielded (PS) 7 T MR scanners and 30 actively shielded (AS) 7 T magnetic resonance (MR) scanners have been installed (information obtained from the manufacturers). The development of AS scanners has been essential in facilitating the use of UHF scanners in clinical research and for clinical diagnostic purposes, as these reduce siting difficulties―especially in terms of space requirements, since the stray field profile of the magnet is reduced [Hawksworth et al., 1987; Moser et al., 2012]. In addition to the possibility of siting UHF scanners in a clinical environment, the MR environment must be safe and well‐tolerated by study participants and patients. It is therefore important to investigate possible relationships between exposure to strong magnetic fields and biological effects, and it may be necessary to revise routines related to patient preparation and handling of implants [Schenck, 2000; Shellock and Crues, 2004]. Although study participants have been shown to tolerate ultra‐high field strengths well, they have reported subjectively experienced short‐term effects such as dizziness, inconsistent movement, nausea, or metallic taste [Chakeres and de Vocht, 2005; Theysohn et al., 2008; Heilmaier et al., 2011; Versluis et al., 2013; Cosottini et al., 2014; Rauschenberg et al., 2014]. These effects have been evaluated in a series of studies [Chakeres et al., 2003a, 2003b; Yang et al., 2006; Glover et al., 2007; Theysohn et al., 2008; Schlamann et al., 2010a, 2010b; Heilmaier et al., 2011; Roberts et al., 2011; Heinrich et al., 2013; Mian et al., 2013; Versluis et al., 2013; Rauschenberg et al., 2014] and have also been noted in studies on occupational exposure and effects of the stray field [McRobbie, 2012; Schaap et al., 2014b, 2014]. While the terms nausea, headache, and metallic taste are self‐explanatory, the term “inconsistent movement” refers to experiencing body movement in a direction other than the actual straight direction through the scanner tunnel, or perception of rotation such as travelling along a curvilinear path through the scanner [Mian et al., 2013]. It can also refer to a feeling of “tipping backwards” [Mian et al., 2016], of unreality [Theysohn et al., 2008], or of insubstantiality [Heilmaier et al., 2011; Rauschenberg et al., 2014]. The occurrence of related short‐term effects has also been studied by Houpt et al. [2003]. Vertigo observed at field strengths less than 8T was proposed to be mediated through a Lorentz force acting in the vestibular system [Glover et al., 2007; Roberts et al., 2011; Mian et al., 2013; Glover et al., 2014]. It has also been suggested that magnetic susceptibility of sensory tissues in the vestibular system could be responsible for a magnetic field effect on humans [Glover, 2015; Mian et al., 2016]. A related short‐term effect not measured in this study is nystagmus, which is caused by Lorentz force acting on the endolymph of the vestibular labyrinth and pushing on semicircular canal cupulae [Glover et al., 2007, 2014; Roberts et al., 2011; Mian et al., 2013]. Although imaging sub‐systems in AS and PS systems of a vendor might nominally be the same (radiofrequency and gradient specifications), the axial magnetic field profile will be significantly different. This may have a bearing on subjects and their perception of some short‐term effects such as dizziness, vertigo, nausea, or apparent motion during movement in and out of the scanner, but is not expected to impact significantly on occurrence and strength of other short‐term effects such as peripheral nerve stimulation (PNS) or magnetophosphene. Most of the studies that have evaluated these short‐term effects have been conducted at sites with passively shielded scanners. Furthermore, the intention to move to diagnostic clinical scanning at UHF means that attention should be paid to nursing care considerations. The aim of nursing care is to achieve as high a level of comfort as possible during examinations of either study participants or patients, while achieving the best diagnostic quality possible. Giving correct and well‐balanced information to patients and study participants is an important part of patient‐oriented and personalized care [Törnqvist et al., 2006].
The aim of this study was therefore to evaluate the occurrence and strength of short‐term effects that were experienced by study participants in an actively shielded 7 T MR, to discuss differences compared to results in literature from passively shielded 7 T scanners, and to outline possible healthcare strategies that might improve patient compliance.
MATERIALS AND METHODS
Ethics
The study was approved by the local ethics committee, and informed written consent was obtained from all the participants.
MR System
Examinations were conducted in 1st controlled mode on an actively shielded 7 T MRI scanner (Achieva, Philips, Best, the Netherlands); gradient system: max. amplitude 40 mT/m; max. slew rate 200 mT/m/s; tunnel diameter: 58 cm; length of magnet: 3.3 m; head coil: 2 transmit (Tx)/32 receive (Rx) channels (Nova Medical, Wilmington, MA); knee coil: 1Tx/28Rx channels (Quality Electrodynamics, Mayfield Village, OH); maximal spatial field gradient (dB/dz) of the stray field: 7.86 T/m at 130 cm from isocenter. For comparison, a passively shielded system from the same vendor might have specifications as defined as length of magnet: 3.4 m; maximal spatial field gradient (dB/dz) of the stray field: 6.67 T/m at 140 cm from isocenter. Figure 1 illustrates magnetic field exposure during table top movement for a head exam comparable to the one published by Mian et al. [2013]. The B‐field was measured using a three‐axis teslameter (THM 1176, Metrolab Technology, Geneva, Switzerland). The speed of the motorized scanner table used in our study was 88 mm/s compared to 105 mm/s for a PS 7 T system of the same manufacturer. Another example of table speed comparison is 180 mm/s for a clinical 1.5T system, again of our system's manufacturer.
Figure 1.

Measured data on exposure to the static magnetic field at the location of the subjects’ head, as the table top is moved from the preparation position to the scan position (isocenter) and after a short arbitrary period of time (22 s) is moved out again to the initial position. The upper two panels show magnetic field magnitude (|Bz|) and its temporal rate of change (d|Bz|/dt) experienced by the head during this procedure. Measured B‐field at the preparation position was 0.40 T and measured maximum rate of change was 0.72 T/s (IN) and −0.71 T/s (OUT) (nominal 0.67 T/s). The bottom panels show the corresponding head position and velocity along the isocenter axis. The measured (constant) table speed at our site was 0.088 m/s (nominal 0.085 m/s) and duration of movement was 24.5 s (same for IN and OUT). Distance from preparation position to isocenter was 2.15 m. The B‐field was measured using a three axis teslameter (THM 1176, Metrolab Technology SA, Geneva, Switzerland).
Study Participants and Definition of Data Collected
Participants were healthy volunteers (recruited from hospital and university employees, students, friends, and acquaintances) and research patients. One hundred and twenty‐eight consecutive individuals who were scheduled for a total of 163 research examinations over a period of 13 months were asked to participate in the study.
Two who underwent one examination did not have time to complete the questionnaire after the examination, and did not therefore agree to participate. Another four individuals who underwent several examinations did not have time to complete the questionnaire after one of their examinations. Two individuals had to be excluded from the study, due in one case to inaccurate completion of the questionnaire, and in the other case due to the fact that no examination was performed because of claustrophobia. One scheduled examination of a person who underwent several examinations was excluded, as functional MRI (fMRI) equipment was being tested without any scan being performed. Four examinations of four individuals were not completed as scheduled due to technical problems, but yielded images or functional data, and were therefore not excluded from the study. Seventeen individuals had several examinations (median 2, range 2–7). This resulted in 124 individuals and 154 examinations being included in the study. Of the 124 study participants, 49 had previously experienced an MR examination (1.5 T, 3 T, or 7 T). Six of the 124 participants were employees who worked with the 7 T scanner and had also previously experienced MR examinations. All study participants changed from their street clothes to hospital pants and cotton gowns. They were all provided with earplugs and an additional ear cap made of dental impression material (dual‐component pulp) to minimize exposure to scanner noise. This procedure is routinely used at our institution for adults being examined in a way that does not allow the use of headphones, and as additional ear protection in children. In the head coil, where traditional headphones could not be used, further padding was adapted to head size. Additional headphones were given to all those who were not being examined in the head coil.
Upon arrival to the institute prior to the performed scan, a written informed consent had been obtained for the research project for which the individual was to be scanned. This first informed written consent included, as required by the ethical board, limited information regarding short‐term effects: “Sometimes patients or research subjects undergoing MR examinations may experience short‐term effects such as dizziness, nausea or metallic taste in the mouth.” Study subjects were informed during preparation of the scan when positioned on the table that dizziness might occur for short periods during the examination. No further possible short‐term effects were discussed with the study participants prior to scans, if not explicitly addressed by the subject him/herself. Directly after leaving the examination room after the examination and before the questionnaire was filled out, written informed consent for this optional/additional questionnaire study was obtained including the short statement: “Sometimes patients or research subjects undergoing MR examinations may experience short‐term effects such as dizziness or nausea. The aim of this study is to evaluate short‐term effects experienced by research subjects examined in a 7 T MR.”
For study participants, demographic data on gender (M/F), age (y), self‐estimated sensitivity for motion sickness (kinetosis, travel sickness) measured with a visual analogue scale (VAS) (values 0−100), and data on scan parameters, short‐term effects, experienced body and room temperature, scanner noise, patient communication, and willingness to repeat a 7 T MR examination were collected using a web‐based questionnaire (REDCap; research electronic data capture; http://project-redcap.org) and from the scanner's log files. Information on scan parameters was comprised of length of research examination (min), body part examined, orientation of body in the field (head or feet first), and unexpected termination of examinations (information from the radiology information system [RIS] transferred to the database). Predicted peripheral nerve stimulation (PNS) values were extracted from log files from the scanner, and from each examination the highest predicted PNS value was used in the analysis for the latter 83 of the 154 examinations, as a trend of high PNS occurrence and strength was observed early. The predicted PNS value is given as a percentage, where 100% is defined as the level of gradient output at which 50% of humans start to experience PNS [Glover, 2009].
Experience of short‐term effects including dizziness, inconsistent movement, nausea, headache, and metallic taste were evaluated for four situations: moving into the scanner (in), at the isocenter (inside), moving out of the scanner (out), and outside the scanner room after the examination (outside). These short‐term effects were evaluated regarding occurrence (yes or no) and strength (absolute VAS values 0–100, and adapted VAS values where absolute values were grouped as: none = 0; very little = 1−20; little = 21−40; moderate = 41−60; much = 61−80; very much = 81−100).
PNS and magnetophospenes were registered regarding occurrence (absolute VAS values 0−100, and adapted VAS values where absolute values were grouped as: none = 0; very few = 1−20; few = 21−40; moderate = 41−60; many = 61−80; very many = 81−100) and strength (with VAS values defined as for dizziness, etc.). Glover [2009] studied the causes and risks of PNS carefully, and PNS was described as anything between a mild tingling and a sensation of pain. Phosphene is a phenomenon characterized by the experience of seeing light without light actually entering the eye. It can be directly induced by mechanical, electrical, or magnetic stimulation. Magnetophosphene occurs at a relatively low threshold in the retina and at a narrow frequency range around 20 Hz [Glover, 2009; ICNIRP, 2014]. Magnetophosphene is thus not related to gradient switching but is likely to be caused by sudden changes in the velocity of the head leading to transient electric field peaks [ICNIRP, 2014], and Glover et al. [2007] found that dB/dt of 1.5 T/s for 50 ms induced magnetophosphene at low light level.
Experience of room and body temperature before, during, and after research examinations was measured with a bipolar Likert VAS scale [Streiner et al., 2015] and an adapted bipolar Likert VAS scale (0−23 = uncomfortably cold; 24−47 = cold; 48−53 = comfortable; 53−76 = warm; and 77−100 = uncomfortably warm). Study participants also specified the body parts in which temperature changes were experienced during and after examination. The scanner room temperature was set to 20 °C.
Acceptability of maximum scanner noise, function of communication system, information from and contact with personnel, and willingness to repeat a 7 T MR examination as a research subject or for healthcare purposes (i.e., as a patient) was measured with adjectival VAS scales (0 = strongly agree; 1−20 = agree; 21−40 = mildly agree; 41−60 = mildly disagree; 61−80 = disagree; 81−100 = strongly disagree).
Statistics
Categorical variables were expressed as counts and frequencies, and compared using chi‐square, Fisher's exact test, or Wilcoxon signed rank test, as appropriate. Continuous variables are presented as median and range (min–max), and differences were compared using Mann–Whitney U‐test. Bivariate correlations were assessed using Spearman rank correlation coefficient (two‐tailed test) or Kendall rank correlation if ranks were far from each other. We performed linear regression analysis using the self‐estimated sensitivity for motion sickness as independent variable and the strength of the short‐term effect nausea as dependent variable. Mixed‐model analyses of the strength of the short‐term effects’ movement and orientation (head or feet first) in the magnetic field were used as fixed main effects in addition to their interaction. Subjects were entered as random effects using an unstructured covariance matrix. The dependence of strength and occurrence of twitching on the highest recorded predicted PNS values was analyzed by logistic regression using a cut‐off for occurrence and strength set to 30 VAS values for twitching. Any P‐value < 0.05 was regarded as statistically significant. We used SPSS version 22 (IBM, Armonk, NY), Matlab version R2016b (The MathWorks, Natick, MA), and R version 3.0.2 (R Foundation for Statistical Computing, Vienna, Austria) for statistical analysis.
RESULTS
The 124 study participants undergoing 154 examinations were 75 men (median age 28, range 21−64) and 49 women (median age 28, range 23−61) with no significant difference in age between the genders (Mann–Whitney U‐test, p = 0.7).
Scan Parameters
Examinations were performed aiming mainly at technical development and sequence optimization under an ethical permit restricting examination times to 60 min (scans <30 min, n = 6 (4%); 30−60 min, n = 133 (86%); >60 min, n = 15 (10%)). Scans exceeding 60 min were performed as part of clinical research studies allowing longer scan times. Unexpected early termination of examinations occurred in four cases due to technical malfunction.
The body parts examined were brain (n = 118), lower extremity (n = 28; 25 knees and three calves), wrist (n = 4), lower arm (n = 1), abdomen (n = 1), abdomen and thorax combined (n = 1), and cervical spine (n = 1). Study participants were oriented head‐first (126 examinations) except for lower extremity scans (feet‐first; 28 examinations).
Dizziness, Inconsistent Movement, Nausea, Headache, and Metallic Taste
Occurrence and strength of dizziness, inconsistent movement, nausea, headache, and metallic taste are summarized in Table 1 in relation to movement into and out of the scanner and position in and outside the magnetic field. The study participants experienced dizziness in 84% (n = 130) of the research examinations, inconsistent movement in 70% (n = 108) of them, headache in 52% (n = 81) of them, nausea in 52% (n = 81) of them, and metallic taste in 43% (n = 66) of them. Dizziness and inconsistent movement also showed the highest VAS values regarding strength.
Table 1.
Occurrence and Experienced Strength of Short‐Term Effects Presented for Motion and Static Actions
| Strength | ||||||||||
|---|---|---|---|---|---|---|---|---|---|---|
| Occurrence (n RE) | Adapted VAS value (n RE) | Absolute VAS value | ||||||||
| Short‐term effect experienced during movement in or out of the scanner, while stationary inside the scanner or after the examination outside the scanner room | No | Yes | Very little | Little | Moderate | Much | Very much | Mean | Median | Range |
| Dizziness | ||||||||||
| In | 35 | 119 | 41 | 26 | 14 | 28 | 10 | 40 | 36 | 1−98 |
| Inside | 73 | 81 | 55 | 8 | 7 | 9 | 2 | 24 | 12 | 1−95 |
| Out | 59 | 95 | 56 | 10 | 11 | 12 | 6 | 30 | 17 | 1−100 |
| Outside | 65 | 89 | 60 | 14 | 6 | 8 | 1 | 22 | 15 | 1−90 |
| Inconsistent movement | ||||||||||
| In | 55 | 99 | 52 | 9 | 12 | 17 | 9 | 35 | 20 | 1−100 |
| Inside | 85 | 69 | 49 | 10 | 5 | 3 | 2 | 19 | 10 | 1−97 |
| Out | 75 | 79 | 57 | 5 | 8 | 3 | 6 | 22 | 10 | 1−100 |
| Outside | 104 | 50 | 46 | 2 | 0 | 2 | 0 | 8 | 3 | 1−76 |
| Nausea | ||||||||||
| In | 89 | 65 | 47 | 6 | 7 | 4 | 1 | 19 | 7 | 1−87 |
| Inside | 109 | 45 | 40 | 2 | 3 | 0 | 0 | 10 | 5 | 1−60 |
| Out | 102 | 52 | 41 | 5 | 4 | 1 | 1 | 14 | 5 | 1−81 |
| Outside | 103 | 51 | 42 | 3 | 4 | 2 | 0 | 12 | 3 | 1−69 |
| Headache | ||||||||||
| In | 100 | 54 | 43 | 3 | 4 | 3 | 1 | 14 | 5 | 1−100 |
| Inside | 92 | 62 | 44 | 5 | 8 | 4 | 1 | 19 | 10 | 1−90 |
| Out | 103 | 51 | 42 | 3 | 3 | 3 | 0 | 14 | 4 | 1−71 |
| Outside | 101 | 53 | 45 | 3 | 2 | 3 | 0 | 13 | 5 | 1−75 |
| Metallic taste | ||||||||||
| In | 108 | 46 | 44 | 0 | 2 | 0 | 0 | 8 | 3 | 1−60 |
| Inside | 104 | 50 | 41 | 4 | 3 | 2 | 0 | 12 | 5 | 1−70 |
| Out | 109 | 45 | 43 | 2 | 0 | 0 | 0 | 6 | 3 | 1−40 |
| Outside | 113 | 41 | 37 | 1 | 2 | 1 | 0 | 8 | 3 | 1−73 |
VAS, visual analogue scale; RE, research examination
We tested whether or not there was occurrence of dizziness, inconsistent movement, nausea, headache, or metallic taste in all possible pairwise comparisons in relation to movement into or out of the scanner and position in or outside the magnetic field (in, out, inside, and outside). All differed significantly (p < 0.005; Pearson chi‐square test, or Fisher's exact test if counts <5), showing that experiencing a short‐term effect when going into the magnet did not necessarily mean that the experience would be the same when going out of the magnet. Further, Wilcoxon signed rank test showed that short‐term effects occurred significantly more often during motion (in and out) compared to static location (inside and outside the scanner) for dizziness, inconsistent movement, and nausea (P < 0.01) but not for headache (P = 0.2) or metallic taste (P = 1).
Data on dependence of short‐time effects on movement and orientation in the magnetic field are given in Table 2, and mixed‐model analysis showed significantly higher VAS values for inconsistent movement (P < 0.001) and dizziness (P = 0.0012) when scanned head‐first (118 brain examinations) than when scanned feet‐first (25 knee examinations), but there were no significant differences for nausea (P = 0.09), headache (P = 0.4), or metallic taste (P = 0.5). Strength of dizziness in (P = 0.001) and outside (P = 0.031), inconsistent movement in (P < 0.001), inside (P = 0.007), out (P = 0.001), and outside (P = 0.037), and nausea in (P = 0.015) were also significantly increased with head‐first scanning than with feet‐first scanning (Mann–Whitney U‐test). Four participants were in the scanner both head‐first and feet‐first on different occasions. Two of these subjects had several head‐first examinations. In these two subjects, the variability of experiences was larger within head‐first examinations than between head‐first examinations, compared to feet‐first examinations. One hundred and thirteen study participants reported having any sensitivity to motion sickness, with a median self‐estimated VAS value of 33 (range 1−100). Linear regression analyses using the self‐estimated sensitivity for motion sickness as independent variable and the strength of short‐term effects as dependent variables were significant for nausea (P < 0.001), but did not explain the data variability well (r 2 = 0.086) (Fig. 2). Linear regression analyses were not significant for dizziness (P = 0.064; r 2 = 0.023) or inconsistent movement (P = 0.066; r 2 = 0.024). The occurrence and strength of dizziness, inconsistent movement, nausea, headache, and metallic taste were not significantly different between genders (P > 0.1, Mann–Whitney U‐test).
Table 2.
Occurrence and Experienced Strength of Short‐Term Effects Presented for Motion and Static Actions, Position Head First Compared to Feet First
| Occurrence (n) and strength (absolute visual analogue scale value; mean, median, range) | ||||||||
|---|---|---|---|---|---|---|---|---|
| Head‐first (118 head exams) | Feet‐first (25 knee exams) | |||||||
| Short‐term effect experienced during movement in or out of the scanner, while stationary inside the scanner or after the examination outside the scanner room | n | Mean | Median | Range | n | Mean | Median | Range |
| Dizziness | ||||||||
| In | 105 | 40 | 38 | 1–98 | 14 | 36 | 33 | 1–85 |
| Inside | 72 | 23 | 12 | 1–95 | 9 | 28 | 20 | 2–76 |
| Out | 83 | 31 | 18 | 1–100 | 12 | 17 | 10 | 1–61 |
| Outside | 78 | 22 | 15 | 1–90 | 11 | 19 | 20 | 1–76 |
| Inconsistent movement | ||||||||
| In | 91 | 36 | 21 | 1–100 | 8 | 19 | 8 | 1–100 |
| Inside | 63 | 20 | 10 | 1–97 | 6 | 11 | 13 | 1–16 |
| Out | 72 | 23 | 10 | 1–100 | 7 | 14 | 3 | 1–48 |
| Outside | 45 | 9 | 3 | 1–76 | 5 | 2 | 2 | 1–3 |
| Nausea | ||||||||
| In | 59 | 19 | 9 | 1–87 | 6 | 19 | 5 | 1–60 |
| Inside | 39 | 10 | 5 | 1–60 | 6 | 10 | 3 | 2–30 |
| Out | 46 | 14 | 5 | 1–81 | 6 | 13 | 2 | 1–50 |
| Outside | 42 | 12 | 3 | 1–69 | 9 | 12 | 2 | 1–61 |
| Headache | ||||||||
| In | 47 | 14 | 5 | 1–100 | 7 | 12 | 5 | 1–46 |
| Inside | 54 | 19 | 10 | 1–90 | 8 | 19 | 13 | 1–66 |
| Out | 42 | 15 | 5 | 1–71 | 9 | 8 | 2 | 1–48 |
| Outside | 47 | 14 | 6 | 1–75 | 6 | 9 | 3 | 1–26 |
| Metallic taste | ||||||||
| In | 39 | 8 | 3 | 1–60 | 7 | 6 | 5 | 1–17 |
| Inside | 44 | 13 | 5 | 1–70 | 6 | 3 | 1 | 1–9 |
| Out | 39 | 5 | 3 | 1–26 | 6 | 9 | 2 | 1–40 |
| Outside | 36 | 8 | 3 | 1–73 | 5 | 9 | 4 | 1–30 |
Figure 2.

Linear regression analyses using the self‐estemated sensitivity for motion sickness as independent variable and strength of short‐term effects (nausea) as dependent variables. Visual analoge scale (VAS) units.
Peripheral Nerve Stimulation and Magnetophosphene
Study participants experienced PNS in 67% (n = 103) of research examinations. Figure 3 illustrates occurrence and strength of PNS and magnetophosphene. There was no difference in occurrence of PNS between examinations performed head‐first (118 brain examinations) and examinations performed feet‐first (25 knee examinations) (P = 0.27, Mann–Whitney U‐test). Figure 4 illustrates the dependence of occurrence and strength of PNS on the highest‐recorded predicted PNS values in logistic regression analysis. Table 3 summarizes sequences rendering highest‐predicted PNS values, predicted PNS values, data on experienced PNS, and body mass index for participants with recorded PNS values as experiencing PNS. Morphological 3D scans were the sequences rendering highest‐predicted PNS values. Table 4 summarizes body parts affected by PNS and illustrates differences in body parts affected by PNS when comparing head‐first with feet‐first examinations. Torso, hand, and arm were the body parts mainly affected (occurrence) by twitching when examined head‐first. PNS affected only extremities when examined feet‐first with a predominance of the lower extremity. Both approximated number of twitches and strength of twitches show a wide range on the adopted and absolute visual analog scale and suggest the necessity of larger data sets to allow for correction of subject specific parameters.
Figure 3.

Occurrence and strength of (A) peripheral nerve stimulation (PNS) and (B) magnetophosphene. Bars show the number of research examinations (n RE) in each group of adapted visual analogue scale (VAS) values.
Figure 4.

Logistic regression analyses of occurrence (A) and strength (B) of twitches to the highest predicted peripheral nerve stimulation (PNS) value recorded for individual examinations. The cohort was divided into brain examinations (red rings; n = 65), knee examinations (blue rings; n = 10) and other examinations (green rings; n = 8); where other examinations included wrist, lower arm, abdominal and spine examinations. The dichotomized thresholds for occurrence and strength of twitches were set to VAS (visual analogue scale) 30. For the estimated number of twitches the maximum VAS value possible to choose was 100 according to the used VAS scale, although the research subjects might have experienced more than 100 twitches. Probabilities of occurrence (A) and strength (B) of twitches are plotted for all examinations (total; black stars; n = 83), for brain examinations (red stars; n = 65) and for knee examinations (blue stars; n = 10), respectively. For all observations (n = 83) the strength of PNS experienced was significantly dependent on the highest predicted PNS value (P = 0.030), but for none of the other groups (P > 0.06).
Table 3.
Sequences Rendering Highest Predicted PNS Values, Predicted PNS Values, Data on Experienced PNS and Body Mass Index of Participants of the 44 Examinations Where PNS Was Experienced and Predicted PNS Values Recorded
| Experienced PNS during examination | |||||
|---|---|---|---|---|---|
| Sequences with highest predicted PNS value (mean %, range) in RE (n) where PNS was experienced | N twitches (mean, range) | Absolute VAS value of strength of twitches (mean, range) | BMI kg/m2 (mean, range) | ||
| 2D HR T2 | 59, 50–69 | n = 4 | 77, 70–83 | 55, 25–81 | 22, 20–26 |
| 3D HR T1, T2, FLAIR | 82, 22–99 | n = 25 | 51, 2–100 | 44, 10–100 | 24, 20–29 |
| EPI DWI, fMRI, PWI | 84, 69–99 | n = 5 | 72, 59–100 | 56, 28–73 | 24, 21–26 |
| MRS | 35, 10–52 | n = 4 | 38, 10–100 | 35, 10–85 | 22, 19–24 |
| CEST, flow, PD, B1 map | 77, 60–88 | n = 6 | 31, 4–60 | 21, 4–75 | 22, 18–27 |
| Total | 75, 10–99 | n = 44 | 52, 2–100 | 43, 4–100 | 23, 18–29 |
CEST chemical exchange saturation transfer; DWI diffusion weighted imaging; EPI echo planar imaging; FLAIR fluid attenuated inversion recovery; fMRI functional magnetic resonance imaging; HR high resolution; MRS magnetic resonance spectroscopy; PD proton density; PNS peripheral nerve stimulation; PWI perfusion weighted imaging; RE research examinations; VAS visual analogue scale.
Table 4.
Occurrence and Strength of Peripheral Nerve Stimulation Experienced in Most Affected Parts of the Body During 126 Head‐First and 28 Feet‐First Research Examinations
| Occurrence of PNS | Strength of PNS | ||||||||||||||||
|---|---|---|---|---|---|---|---|---|---|---|---|---|---|---|---|---|---|
| Adapted VAS value, n RE | Absolute VAS value | Adapted VAS value, n RE | Absolute VAS value | ||||||||||||||
| Body part | n RE | Very few | Few | Moderate | Many | Very many | Mean | Median | Range | Very little | Little | Moderate | Much | Very much | Mean | Median | Range |
| Head‐first (n = 126 examinations) | |||||||||||||||||
| Head | 4 | 1 | 0 | 3 | 0 | 0 | 41 | 51 | 2–60 | 2 | 1 | 0 | 1 | 0 | 32 | 19 | 13–75 |
| Eyes | 1 | 0 | 0 | 1 | 0 | 0 | 46 | 46 | 46–46 | 0 | 0 | 1 | 0 | 0 | 49 | 49 | 49–49 |
| Neck | 1 | 0 | 1 | 0 | 0 | 0 | 22 | 22 | 22–22 | 1 | 0 | 0 | 0 | 0 | 17 | 17 | 17–17 |
| Thorso | 25 | 3 | 4 | 6 | 5 | 7 | 70 | 65 | 9–100 | 2 | 9 | 3 | 8 | 3 | 64 | 67 | 10–100 |
| Abdom. | 5 | 0 | 2 | 1 | 2 | 0 | 51 | 60 | 30–65 | 0 | 2 | 1 | 2 | 0 | 49 | 42 | 28–75 |
| Hand | 16 | 3 | 3 | 3 | 5 | 2 | 51 | 52 | 7–86 | 0 | 6 | 0 | 5 | 0 | 40 | 30 | 10–76 |
| Arm | 14 | 7 | 0 | 3 | 3 | 1 | 37 | 37 | 1–83 | 6 | 3 | 3 | 1 | 1 | 31 | 25 | 4–81 |
| Leg | 6 | 2 | 0 | 1 | 3 | 0 | 46 | 50 | 6–76 | 3 | 1 | 2 | 0 | 0 | 30 | 30 | 6–60 |
| Foot | 1 | 0 | 0 | 0 | 1 | 0 | 67 | 67 | 67 | 0 | 0 | 0 | 1 | 0 | 66 | 66 | 66 |
| NS | 12 | 11 | 1 | 0 | 0 | 0 | 8 | 4 | 1–33 | 10 | 0 | 0 | 0 | 0 | 8 | 6 | 1–15 |
| Feet‐first examinations (n = 28 examinations) | |||||||||||||||||
| Hand | 4 | 2 | 1 | 0 | 1 | 0 | 35 | 27 | 15–70 | 1 | 2 | 0 | 1 | 0 | 31 | 23 | 10–70 |
| Arm | 1 | 1 | 0 | 0 | 0 | 0 | 5 | 5 | 5 | 1 | 0 | 0 | 0 | 0 | 20 | 20 | 20 |
| Leg | 8 | 4 | 0 | 2 | 1 | 1 | 40 | 32 | 9–100 | 4 | 2 | 1 | 0 | 1 | 32 | 25 | 7–85 |
| Foot | 6 | 1 | 0 | 3 | 2 | 0 | 20 | 4 | 4–52 | 1 | 1 | 0 | 0 | 0 | 16 | 5 | 5–38 |
| NS | 3 | 2 | 0 | 1 | 0 | 0 | 23 | 20 | 1–49 | 3 | 0 | 0 | 0 | 0 | 5 | 4 | 1–13 |
| All examinations (n = 154) | |||||||||||||||||
| All | 107 | 37 | 12 | 24 | 23 | 11 | 38 | 37 | 1–100 | 34 | 27 | 11 | 19 | 5 | 33 | 25 | 1–100 |
NS not specified; PNS peripheral nerve stimulation; RE research examination; VAS visual analogue scale.
Study participants experienced magnetophosphene in 23% (n = 35) of research examinations (Fig. 3B). There was no difference in occurrence of magnetophosphene between examinations performed head‐first (118 brain examinations) and examinations performed feet‐first (25 knee examinations) (P = 1.0, Mann–Whitney U‐test). As expected, there was no correlation between the occurrence of PNS and magnetophosphene (P = 0.062, Kendall rank correlation).
Body and Room Temperature, Scanner Noise, Patient Communication, and Willingness to Repeat a 7 T MR Examination
The temperature in the scanner room was generally reported as being comfortable. Otherwise, study participants tended to report that the scanner room temperature was lower than was comfortable (Fig. 5). Body temperature was also generally reported as being comfortable Some study participants felt a subjective decrease in body temperature in 12% of the research examinations (n = 18) and a subjective increase in 18% (n = 28). These temperature changes were mainly reported to be local, with decreased temperature reported in peripheral parts of the extremities such as the feet and hands and increased body temperature in the head/face, torso, and arms.
Figure 5.
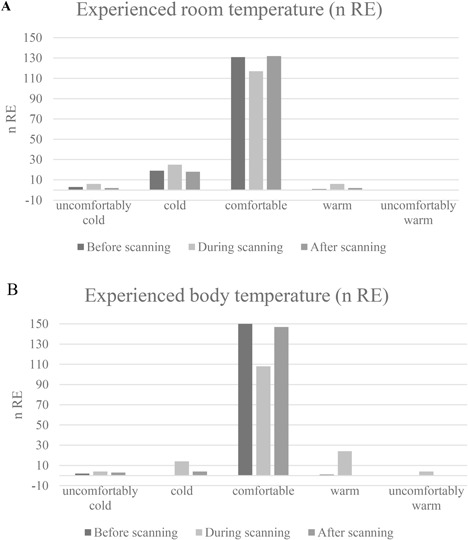
Room (A) and body temperature (B) experienced before, during, and after research examination.
Table 5 summarizes data on experience of scanner noise levels, communication, and willingness to undergo further scans. Scanner noise levels were well‐tolerated, and the communication system was reported to function well during the examination. The noise levels were significantly more disturbing (P < 0.001) and communication problems were experienced more frequently (P = 0.001) when study participants were scanned head‐first than when they were scanned feet‐first (Mann–Whitney U‐test). They felt well‐informed and had good contact with the personnel running the procedure prior to 95% of the examinations (n = 147) and during 88% of them (n = 135). Willingness to undergo a future 7 T examination was high both regarding examination as a study participant (90%) and for healthcare purposes (96%), with no significant gender difference (for healthcare purposes, P = 0.29; as a research subject, P = 0.49). If different answers were given regarding examinations as a research subject and for healthcare purposes, respondents tended to be more positive for participation in a clinical examination than for participation in a research examination. However, four study participants (with six examinations) stated the opposite.
Table 5.
Acceptability of noise level, function of communication system, information status and contact with personnel, and willingness to undergo future 7T examinations
| Level of agreement | ||||||
|---|---|---|---|---|---|---|
| Strongly agree | Agree | Mildly agree | Mildly disagree | Disagree | Strongly disagree | |
| Maximum noise level during scan is acceptable | 46 | 43 | 25 | 20 | 16 | 4 |
| Communication system works well during scan | 59 | 40 | 12 | 17 | 23 | 3 |
| Research subject feels well‐informed and has good contact with personnel | ||||||
| Before scan | 107 | 40 | 4 | 3 | 0 | 0 |
| During scan | 92 | 43 | 11 | 6 | 1 | 1 |
| Research subject is willing to undergo a future 7T examination | ||||||
| As research subject | 100 | 29 | 9 | 15 | 1 | 0 |
| As patient | 119 | 28 | 1 | 5 | 1 | 0 |
DISCUSSION
Compliance with 7 T MR examinations in an actively shielded 7 T MR was high, although the study participants experienced a high frequency of occurrence of short‐term effects related to the examination.
Short‐term effects varied significantly during examinations for the four situations of moving into or out of the scanner and being inside or outside the scanner. Dizziness, inconsistent movement, and twitching due to peripheral nerve stimulation were the most frequently reported short‐term effects. These short‐term effects may have depended on how the study participants were oriented (head‐first or feet‐first), as also shown by Heilmaier et al. [2011] and Theysohn et al. [2008].
Study participants experienced dizziness in 84% of the 154 research examinations, and inconsistent movement, headache, nausea, or metallic taste in 43–70% of the research examinations. The occurrence of dizziness was higher than has been reported earlier in the majority of studies, affecting 16–60% of study participants [Chakeres et al., 2003b; Yang et al., 2006; Theysohn et al., 2008; Heilmaier et al., 2011; Versluis et al., 2013; Cosottini et al., 2014; Rauschenberg et al., 2014]. A comparable or higher frequency of occurrence has been reported, involving 85% [Heinrich et al., 2013] and 90% of study participants [Mian et al., 2016], but in the latter study the participants were nodding inside the scanner, which would have substantially altered the study design compared to all other studies. Differences in the occurrence of dizziness―depending on direction of movement or comparing movement relative to the isocenter―were also reported by Versluis et al. [2013] (34% and 30% of subjects when moving into or out of the 7 T scanner, respectively) and by Heilmaier et al. [2011] (60% of subjects when moving into the scanner and 32% at the isocenter). In our study we used the term “inconsistent movement,” as also used by Glover et al. [2007], to summarize our interpretation of sensations described as body movement in a direction other than the actual straight direction through the scanner tunnel, perception of rotation such as travelling along a curvilinear path through the scanner [Mian et al., 2013], a feeling of “tipping backwards” [Mian et al., 2016], or a feeling of unreality [Theysohn et al., 2008] or of insubstantiality [Heilmaier et al., 2011; Rauschenberg et al., 2014]. The occurrence of inconsistent movement has been reported for 70% of research examinations in our study, and its strength was reported as severe in 19% of them (according to adapted VAS values “much” and “very much”). This is fully comparable with the findings of Glover et al. [2007], who reported an overall occurrence of inconsistent movement in 70% of study participants, and was severe in 20%. Heilmaier et al. [2011] and Theysohn et al. [2008] reported inconsistent movement as a mean score for the whole population, ranging from 0.1−0.3 for movement and 0.0−0.3 at the isocenter. When translating our VAS scale from 0−100 to 0−10, our mean scores for inconsistent movement for the whole population when moving into the scanner was 2.2, and 0.9 at the isocenter, which is considerably higher than the values previously reported. In our study, an AS magnet was used compared to PS magnets in the previous studies. AS magnets have a higher magnetic field gradient at the bore opening, but lower magnetic field strength in the direct vicinity of the magnet compared to PS magnets. Since the table speed is commonly reduced for an AS magnet to avoid high dB/dt, the exposure due to movement in the gradient static magnetic field might be very similar to that of a PS magnet. This would speak against higher dB/dt—change in magnetic field per time unit—as an explanation of the higher prevalence of perceived symptoms in our study; this explanation, however, cannot be ruled out, and several authors proposed this as cause for short‐term effects with dizziness as the most commonly reported [Theysohn et al., 2007; Heilmaier et al., 2011; Cosottini et al., 2014; Rauschenberg et al., 2014]. To allow better comparability, we illustrate magnetic field exposure during table top movement in our system for a head exam, which is comparable to the exposure measurements published by Mian et al. [2013] for a PS 7 T system (Fig. 1). Movement in a static or spatially varying magnetic field has been associated with vertigo as described by Glover et al. [2007]. On the other hand, considering findings regarding eye movement (nystagmus) in subjects exposed to a strong static magnetic field, Roberts et al. [2011] proposed constant Lorenz forces due to ionic current within the vestibular system to be the likely mechanism, thus not associated with subject movement. Mian et al. [2013] further studied the effects of exposure to a strong (7 T) static magnetic field with respect to nystagmus and vertigo and the possibility of a common origin. Mian et al. [2015] and Ward et al. [2015] discuss possible biological mechanisms in detail including central adaptation to a continuous vestibular stimulation. Considering these findings and a possible adaptation process, one might notice a previously not‐discussed possibility to explain the higher prevalence of symptoms in our study. The static magnetic field outside an AS magnet is typically lower than the static magnetic field outside a PS magnet at the position of a subject's head during preparation. If the subject is exposed to (and adapts to) a lower baseline magnetic field during preparation, might it be that the threshold for vertigo will also be lower when entering the magnet bore, leading to a higher prevalence?
The present study design does not allow us to draw any conclusions about the role of homogenous static magnetic field exposure and perceived symptoms, but this might be an interesting track to follow in further studies.
Nausea, headache, and metallic taste were less commonly reported than dizziness and inconsistent movement, which is in line with the literature [Theysohn et al., 2008; Heilmaier et al., 2011; Mian et al., 2013; Versluis et al., 2013]. Nausea was rated to be significantly worse when moving than when stationary in our study. This was also reported by Theysohn et al. [2008], and a similar trend but without statistical significance was found by Heilmaier et al. [2011]. Approximately 2% of the participants in the study by Versluis et al. [2013] reported that they felt little nausea during the examination.
In our study and in the study by Theysohn et al. [2008], headache was rated to be significantly more when lying still at the isocenter than during movement with a similar trend reported by Heilmaier et al. [2011]. Head pressure was reported by Mian et al. [2013] in a few cases. Having a metallic taste has been reported earlier, with a mean score of between 0.3 and 0.5 during movement and at the isocenter [Theysohn et al., 2008; Heilmaier et al., 2011], occurring in 11% of subjects [Versluis et al., 2013], or only occurring in a few cases [Mian et al., 2013]. In our study, a higher proportion of participants reported having a metallic taste (43%), but with a low mean strength of 12 (VAS scale 0−100).
Nausea prevention was addressed by Thormann et al. [2013], who showed that even a low dose of diphenhydramine reduces the strength of vertigo at 7 T examinations. These data, together with the significant but very weak relationship between nausea and self‐estimated motion sickness shown in this study, indicate that future clinical patients who undergo UHF MR and who have a high self‐estimated sensitivity for motion sickness in combination with disease‐related nausea or vertigo might gain from receiving preventive medication to reduce such unpleasant effects. In accordance with Theysohn et al. [2014], showing that exposure to the 7 T static magnetic field causes temporary dysfunction or “over‐compensation” of the vestibular system, we have also noticed study participants swaying after examinations, although we have not studied sway path and body axis rotation after examinations in detail. To give research subjects some time to recover, we invite them to sit down and have a drink of water and a snack before leaving the facility.
The occurrence of PNS measured as muscle twitching was higher in our study (67% of examinations) than reported in earlier studies―with 44% of study participants in the study by Theysohn et al. [2008], 15% at the Magdeburg site in the study by Rauschenberg et al. [2014], 17% at the Jülich site in the same publication [Rauschenberg et al., 2014], and with lowest frequencies being reported by Heinrich et al. [2013] and Versluis et al. [2013] (2.4% and 1%, respectively). In the latter two studies, however, PNS was not primarily targeted in the questionnaire. Twitching was rated as source of discomfort in two studies, showing values of >3 on a 0−10 scale in 20% of cases [Heilmaier et al., 2011] as compared to a mean score of 1 (scale 0−10) for a whole study population [Theysohn et al., 2008]. Thus, twitching has been reported by occurrence and by the source of discomfort, but not by the strength of twitches, which has been addressed in the present study (mean strength for our study population as a whole was 24 on a 0−100 VAS scale, and 35 for individuals who experienced twitching). We do not see one single explanation for the high occurrence of PNS in our material, but with respect to the MR scanner we believe that a systematic difference compared to other systems regarding the geometry or the current pattern of the gradient coil, or a systematic difference in the estimation of dB/dt in relation to the limits in the IEC‐standard, could be possible explanations. Another possible objective explanation could be an unusually high level of dB/dt for protocols used in the research projects performing the scans our individuals were reporting on; however, as data on dB/dt are sparse for other studies, this can only be assumed.
From comments made by study participants in our study, it became clear that the experiencing and/or strength of twitching could affect the degree of discomfort experienced by individual study participants very differently. Some individuals might experience single mild twitches as being very uncomfortable while other study participants might experience even several severe twitches as being absolutely acceptable, and not relate the experience to discomfort.
To further investigate whether predicted PNS values may be considered important for comfort/discomfort experienced in UHF MR examinations, it will be necessary to address all three parameters of PNS experience: occurrence, strength, and discomfort, which will be part of a follow‐up study.
The body parts that are mainly affected by twitching have also varied between studies. In contrast to Theysohn et al. [2008], who reported that the arms, legs, and back were the body parts mainly affected, the study participants in our study mainly reported twitching in the torso, hand, and arm, with the highest mean and median VAS values for strength of twitching experienced in the torso, abdomen, and eyes. The study protocols used for the study participants in this study could vary regarding the switched gradient field. Since PNS is dependent on the strength of the gradient field (dB/dt), this could also be a factor that would explain part of the difference in prevalence of twitching between subjects, and also the somewhat different results between studies.
The occurrence (number of cases) of PNS in examinations performed head‐first was rather similar to feet‐first examinations; however, the body parts affected differed as feet‐first examinations only resulted in PNS affecting the extremities of the body (primarily the lower extremity), while head‐first position predominantly affected the torso and upper extremity. The induced electric field in the subject due to the switched gradient field depends on many parameters such as coil design, size, and stature of the subject, and the position of the subject inside the bore and applied sequences (which all differ substantially between scans in this study). In further dedicated studies, it would be of interest to collect more precise information on anatomical position of PNS in subjects and correlate them to body stature and field profiles of the gradient coil and compare findings to simulations, such as proposed by Davids et al. [2019]. Such studies might also further focus on individual differences in perception of PNS regarding number and strength of twitches under comparable conditions.
Light flashes were reported by 7% [Theysohn et al., 2008] and 20% [Heinrich et al., 2013] of the study participants in earlier studies, as compared to 23% in the present study. Compared to other studies, such as, for example, Glover et al. [2007] and Mian et al. [2013], we did not ask study subjects to close their eyes while being in the scanner. This might lead to an increased frequency of eye movement potentially causing magnetophosphene.
Differences in occurrence and strength of experienced short‐term effects reported in the literature raise the question of possible biases influencing study results and comparability. Some of the differences observed between different studies on short‐term effects might be explained by their use of different scales and questionnaires, and different ways of presentation of the results and further bias factors. Information regarding expected short‐term effects given to study subjects prior to the examinations performed is not sufficiently detailed in all publications and may span from unstandardized minimal information to exact information on which short‐term effects should be reported at a specific time point of the examination/experiment. The amount of information given in our study is described in the Materials and Methods section and was designed to balance the aim of keeping information bias as low as possible with requirements from the ethical board and patient care, the latter aiming at high compliance and patient comfort. Over‐reporting of short‐term effects as a consequence of information bias can of course not be excluded, neither for this nor any other study. Recognition bias might be a potential drawback for individuals who have undergone several examinations either on scanners with other field strengths or repetitive scans at the 7 T. However, this is true for larger studies in the literature, usually not excluding subjects with several scans or earlier MR experience. These subjects might further experience various examinations differently, for example, regarding PNS depending on the used sequences or body part examined, but also due to adaptation bias, a factor reported by several subjects but not within the scope of this study. Expectation bias might not only be of importance regarding given information but also how individuals will approach an MR examination. The expectation of a patient undergoing a clinical MR scan will primarily focus on the test result while healthy volunteers in research examinations, not least at UHF facilities, might in general focus on the experience itself, possibly leading to higher reported frequencies of short‐term effects independent of prior knowledge. Some of these biases affecting descriptive studies such as ours might be better controlled by designing larger cross‐sectional studies with control groups from systems with different properties regarding, for example, field strength, shielding, other aspects of magnet design, and with different expectations.
Body temperature was generally reported as being comfortable in our study. The increase in temperature experienced primarily in the head, torso, and arms can partly be attributed to radiant heat from hardware, which increases in temperature during scans with high gradient amplitude and switching rate (close proximity of upper extremity to gradient coils in the bore and to transmit/receive coil in head examinations). Some study participants experienced a decrease in body temperature mostly in the feet and hands, which can easily be prevented by offering a blanket to prevent these body parts from being exposed to the air flow from ventilation in the tunnel. This might, however, conflict with recommendations given in user manuals.
Noise has been considered to be a cause of discomfort during MR examination [Theysohn et al., 2008; Heilmaier et al., 2011], and it was reported to be uncomfortable by 33% of the subjects in one study [Versluis et al., 2013]. The two other studies mentioned above [Theysohn et al., 2008; Heilmaier et al., 2011] reported contradictory results regarding perception of noise at 7 T and 1.5 T. In our study, the maximum noise levels were considered to be unacceptable by 13% of the study participants, but this interestingly did not lead to termination of scans by the study participants. The noise levels were experienced as significantly more disturbing in the head‐first orientation than in the feet‐first orientation, which can be explained by lower noise levels outside the scanner in feet‐first orientation, and the provided headphones. The different scan protocols that were used correspond to varying sequences needed for different projects, so different noise is experienced.
All physical and cognitive experiences related to examinations must be regarded as potential sources of discomfort, as there are very little data on how the occurrence and strength of short‐term effects correlate to experiences of discomfort in individuals. Even though study participants experience short‐term effects, most are still willing to undergo another 7 T examination [Theysohn et al., 2008]. Willingness to undergo a future 7 T examination was high, 90% willingness as a research subject and 96% for healthcare purposes in our study, which is in line with numbers found in other studies: 79% as a research subject, 88% as a patient [Heilmaier et al., 2011]; and 82% as a research subject, 99% as a patient [Theysohn et al., 2008].
Compliance with 7 T MR examinations was high; however, it not only depends on single factors but reflects the sum of different experiences such as temperature, noise, contact with personnel, observed short‐term effects, and personal motivation and expectations as well as earlier experiences. Nursing care is an important factor in comfort during examinations, contributing to high diagnostic quality, with information as a key factor along with person‐centered care, focusing on the individual's experience and not generalizing short‐term effects [Törnqvist et al., 2006]. Duration of the examination has been reported as a major source of discomfort, with mean scan times of 73 min [Theysohn et al., 2008]. Our mean scan times were lower (<60 min), and scan time was not evaluated as a factor causing discomfort. However, scanner noise, function of communication systems, and the communication and information needs of study participants were taken into account, and are important factors when considering compliance. These factors can at least be partly addressed with nursing care―aiming to make examinations as comfortable as possible for study participants and patients alike, and to achieve the best diagnostic quality possible. It is important to take the needs of every individual study participant into account and allow enough time to collect all the information necessary to provide individualized patient care [McCabe, 2004]. In the present study, 96% of the study participants reported that they were well‐informed before the examination and had good contact with personnel attending the examination (this could be a radiographer, a physicist, a medical doctor, or a responsible researcher). The proportion decreased to 88% during the examination, which indicates that there is room for improvement. During the examination, it is very important to maintain contact with the research subject through the communication system, and to make sure that he/she hears and fully understands what is being said. Future studies need to further monitor how we can improve nursing care strategies in the context of UHF MR.
CONCLUSION
Dizziness, inconsistent movement, and PNS are the most frequently reported short‐term effects in our AS 7 T MR. The results of this study indicate that experience of short‐term effects may differ between actively and passively shielded 7 T MR scanners, although these differences may not only be related to the shielding of the system, but may also be related to other aspects of system design or study design differences. Patient comfort was generally experienced as high, but areas for improvement were identified regarding nursing care strategies, such as supplying better information and paying attention to the needs and the comfort of the individual at all times.
ACKNOWLEDGMENTS
This work was supported by Academy of Care Science, Skåne University Hospital, Lund, and Skåne Region, Sweden.
Conflicts of interest: None.
REFERENCES
- Chakeres DW, Bornstein R, Kangarlu A. 2003a. Randomized comparison of cognitive function in humans at 0 and 8 Tesla. J Magn Reson Imaging 18:342–345. [DOI] [PubMed] [Google Scholar]
- Chakeres DW, de Vocht F. 2005. Static magnetic field effects on human subjects related to magnetic resonance imaging systems. Prog Biophys Mol Biol 87:255–265. [DOI] [PubMed] [Google Scholar]
- Chakeres DW, Kangarlu A, Boudoulas H, Young DC. 2003b. Effect of static magnetic field exposure of up to 8 Tesla on sequential human vital sign measurements. J Magn Reson Imaging 18:346–352. [DOI] [PubMed] [Google Scholar]
- Cosottini M, Frosini L, Biagi L, Pesaresi I, Costagli M, Tiberi G, Symms M, Tosetti M. 2014. Short‐term side‐effects of brain MR examination at 7T: A single‐centre experience. Eur Radiol 24:1923–1928. [DOI] [PubMed] [Google Scholar]
- Davids M, Guérin B, Endt A, Schad LR, Wald LL. 2019. Prediction of peripheral nerve stimulation thresholds of MRI gradient coils using coupled electromagnetic and neurodynamic simulations. Magn Reson Med 81:686–701. [DOI] [PMC free article] [PubMed] [Google Scholar]
- Glover PM. 2009. Interaction of MRI field gradients with the human body. Phys Med Biol 54:R99–R115. [DOI] [PubMed] [Google Scholar]
- Glover PM. 2015. Magnetic field‐induced vertigo in the MRI environment. Curr Radiol Rep 3:29. [Google Scholar]
- Glover PM, Cavin I, Qian W, Bowtell R, Gowland PA. 2007. Magnetic‐field‐induced vertigo: A theoretical and experimental investigation. Bioelectromagnetics 28:349–361. [DOI] [PubMed] [Google Scholar]
- Glover PM, Li Y, Antunes A, Mian OS, Day BL. 2014. A dynamic model of the eye nystagmus response to high magnetic fields. Phys Med Biol 59:631–645. [DOI] [PubMed] [Google Scholar]
- Hawksworth DG, McDougall IL, Bird JM, Black D. 1987. Considerations in the design of MRI magnets with reduced stray fields. T Magn 23:1309–1314. [Google Scholar]
- Heilmaier C, Theysohn JM, Maderwald S, Kraff O, Ladd ME, Ladd SC. 2011. A large‐scale study on subjective perception of discomfort during 7 and 1.5T MRI examinations. Bioelectromagnetics 32:610–619. [DOI] [PubMed] [Google Scholar]
- Heinrich A, Szostek A, Meyer P, Nees F, Rauschenberg J, Gröbner J, Gilles M, Paslakis G, Deuschle M, Semmler W, Floer H. 2013. Cognition and sensation in very high static magnetic fields: A randomized case‐crossover study with different field strengths. Radiology 266:236–245. [DOI] [PubMed] [Google Scholar]
- Houpt TA, Pittman DW, Barranco JM, Brooks EH, Smith JC. 2003. Behavioral effects of high‐strength static magnetic magnetic fields on rats. J Neurosci 23:1498–1505. [DOI] [PMC free article] [PubMed] [Google Scholar]
- ICNIRP, International Commission on Non‐Ionizing Radiation Protection. 2014. Guidelines for limiting exposure to electric fields induced by movement of the human body in a static magnetic field and by time‐varying magnetic fields below 1 Hz. Health Phys 106:418–425. [DOI] [PubMed] [Google Scholar]
- McCabe C. 2004. Nurse‐patient communication: An exploration of patientś experiences. J Clin Nurs 13:41–49. [DOI] [PubMed] [Google Scholar]
- McRobbie DW. 2012. Occupational exposure in MRI. BR J Radiol 85:293–312. [DOI] [PMC free article] [PubMed] [Google Scholar]
- Mian OS, Li Y, Antunes A, Glover PM, Day BL. 2013. On the vertigo due to static magnetic fields. PLoS ONE 8:e78748. [DOI] [PMC free article] [PubMed] [Google Scholar]
- Mian OS, Li Y, Antunes A, Glover PM, Day BL. 2016. Effect of head pitch and roll orientations on magnetically induced vertigo. J Physiol 595:1051–1067. [DOI] [PMC free article] [PubMed] [Google Scholar]
- Mian OS, Li Y, Glover PM, Day BL. 2015. Reconciling magnetically induced vertigo and nystagmus. Front Neurol 6:201. [DOI] [PMC free article] [PubMed] [Google Scholar]
- Moser E. 2010. Ultra‐high‐field magnetic resonance: Why and when? World J Radiol 2:37–40. [DOI] [PMC free article] [PubMed] [Google Scholar]
- Moser E, Ståhlberg F, Ladd ME, Trattnig S. 2012. 7‐T MR—From research to clinical applications? NMR Biomed 25:695–716. [DOI] [PubMed] [Google Scholar]
- Rauschenberg J, Nagel AM, Ladd SC, Theysohn JM, Ladd ME, Möller HE, Trampel R, Turner R, Pohman R, Scheffler K, Brechmann A, Stadler J, Felder J, Shah JN, Semmler W. 2014. Multicenter study of subjective acceptance during magnetic resonance imaging at 7 and 9.4T. Invest Radiol 49:249–259. [DOI] [PubMed] [Google Scholar]
- Roberts DC, Marcelli V, Gillen JS, Carey JP, Della Santina CC, Zee DS. 2011. MRI magnetic field stimulates rotational sensors of the brain. Curr Biol 21:1635–1640. [DOI] [PMC free article] [PubMed] [Google Scholar]
- Schaap K, Christopher‐de Vries Y, Crozier S, de Vocht F, Kromhout H. 2014b. Exposure to static and time‐varying magnetic fields from working in the static magnetic stray fields of MRI scanners: A comprehensive survey in the Netherlands. Ann Occup Hyg 58:1094–1110. Erratum in: Ann Occup Hyg 2015.59(6):817‐820. [DOI] [PubMed] [Google Scholar]
- Schaap K, Christoffer‐de Vries Y, Mason CK, deVocht F, Portengen L, Kromhout H. 2014. Occupational exposure of healthcare and research staff to static magnetic stray fields from 1.5‐7 Tesla MRI scanners is associated with reporting of transient symptoms. Occup Environ Med 71:423–429. [DOI] [PMC free article] [PubMed] [Google Scholar]
- Schenck JF. 2000. Safety of strong, static magnetic fields. J Magn Reson Imaging 12:2–19. [DOI] [PubMed] [Google Scholar]
- Schlamann M, Voigt MA, Maderwald S, Bitz A, Kraff O, Ladd M, Forsting M, Wilhelm H. 2010a. Exposure to high‐field MRI does not affect cognitive function. J Magn Reson Imaging 31:1061–1066. [DOI] [PubMed] [Google Scholar]
- Schlamann M, Yoon MS, Maderwald S, Pietrzyk T, Bitz AK, Gerwig M, Forsting M, Ladd SC, Ladd ME, Kastrup O. 2010b. Short term effects of magnetic resonance imaging on excitability of the motor cortex at 1.5T and 7T. Acad Radiol 17:277–281. [DOI] [PubMed] [Google Scholar]
- Shellock FG, Crues JV. 2004. MR procedures: Biologic effects, safety, and patient care. Radiology 232:635–652. [DOI] [PubMed] [Google Scholar]
- Streiner DL, Norman GR, Cairney J. 2015. Health Measurement Scales − A Practical Guide to Their Development and Use. Oxford, United Kingdom: Oxford University Press; pp 38–53. [Google Scholar]
- Theysohn JM, Kraff O, Eilers K, Andrade D, Gerwig M, Timmann D, Schmitt F, Ladd ME, Ladd SC, Bitz AK. 2014. Vestibular effects of a 7 Tesla MRI examination compared to 1.5 T and 0 T in healthy volunteers. PLoS ONE 9:e92104. [DOI] [PMC free article] [PubMed] [Google Scholar]
- Theysohn JM, Maderwald S, Kraff O, Moenninghoff C, Ladd ME, Ladd SC. 2008. Subjective acceptance of 7 Tesla MRI for human imaging. MAGMA 21:63–72. [DOI] [PubMed] [Google Scholar]
- Thormann M, Amthauer H, Adolf D, Wollrab A, Ricke J, Speck O. 2013. Efficacy of diphenhydramine in the prevention of vertigo and nausea at 7 T MRI. Eur J Radiol 82:768–772. [DOI] [PubMed] [Google Scholar]
- Törnqvist E, Månsson Å, Larsson EM, Hallström I. 2006. It́s like being in another world—Patients’ lived experience of magnetic resonance imaging. J Clin Nurs 15:954–961. [DOI] [PubMed] [Google Scholar]
- Versluis M, Teeuwisse WM, Kan HE, van Buchem MA, Webb AG, van Osch MJ. 2013. Subject tolerance of 7 T MRI examination. J Magn Reson Imaging 38:722–725. [DOI] [PubMed] [Google Scholar]
- Ward B, Roberts D, Della Santina C, Carey J, Zee D. 2015. Vestibular stimulation by magnetic fields. Ann N Y Acad Sci 1343:69–79. [DOI] [PMC free article] [PubMed] [Google Scholar]
- Yang M, Christoforidis G, Abduljali A, Beversdorf D. 2006. Vital signs investigation in subjects undergoing MR imaging at 8T. AJNR Am J Neuroradiol 27:922–928. [PMC free article] [PubMed] [Google Scholar]