

Abstract
The Impact of Weight on Quality of Life‐Lite (IWQOL‐Lite) is widely used in evaluations of weight‐loss interventions, including pharmaceutical trials. Because this measure was developed using input from individuals undergoing intensive residential treatment, the IWQOL‐Lite may include concepts not relevant to clinical trial populations and may be missing concepts that are relevant to these populations. An alternative version, the IWQOL‐Lite Clinical Trials Version (IWQOL‐Lite‐CT), was developed and validated according to the US Food and Drug Administration's (FDA's) guidance on patient‐reported outcomes. Psychometric analyses were conducted to validate the IWQOL‐Lite‐CT using data from two randomized trials (NCT02453711 and NCT02906930) that included individuals with overweight/obesity, with and without type 2 diabetes. Additional measures included the SF‐36, global items, weight and body mass index. The IWQOL‐Lite‐CT is a 20‐item measure with two primary domains (Physical [seven items] and Psychosocial [13 items]). A five‐item Physical Function composite and Total score were also supported. Cronbach's alpha and intraclass correlation coefficients exceeded 0.77 at each time point; patterns of construct validity correlations were consistent with hypotheses; and scores demonstrated treatment benefit. The IWQOL‐Lite‐CT is appropriate for assessing weight‐related physical and psychosocial functioning in populations commonly targeted for obesity clinical trials. Qualification from the FDA is being sought for use of the IWQOL‐Lite‐CT in clinical trials to support product approval and labelling claims.
Keywords: health‐related quality of life, Impact of Weight on Quality of Life‐Lite (IWQOL‐Lite), Impact of Weight on Quality of Life‐Lite Clinical Trials Version (IWQOL‐Lite‐CT), patient functioning, psychometric validation
WHAT IS ALREADY KNOWN ABOUT THIS SUBJECT
While the Impact of Weight on Quality of Life‐Lite (IWQOL‐Lite) is in widespread use and has demonstrated strong psychometric properties, the content was initially based on the input of individuals undergoing intensive residential treatment for obesity and related comorbid conditions.
The IWQOL‐Lite may be missing some concepts that are relevant to clinical trial populations and may include concepts that are not relevant to these populations.
As a result of these potential content validity limitations, the US Food and Drug Administration (FDA) has not allowed clinical trial results based on this measure to be described in product labelling.
WHAT THIS STUDY ADDS
An alternative version of the IWQOL‐Lite questionnaire optimized for use in patient populations typically targeted for weight loss clinical trials, the IWQOL‐Lite Clinical Trials Version (IWQOL‐Lite‐CT), has been developed.
The IWQOL‐Lite‐CT is a reliable, valid and responsive measure of weight‐related functioning in the populations commonly targeted for clinical trials of new weight loss medications.
The Physical Function scale may be particularly appropriate to support product labelling based on the proximal nature of changes in the underlying construct to changes in patients' weight.
Abbreviations
- ANOVA
analysis of variance
- BMI
body mass index
- CFA
confirmatory factor analysis
- CFI
comparative fit index
- FDA
US Food and Drug Administration
- HRQOL
health‐related quality of life
- ICC
intraclass correlation coefficient
- IWQOL‐Lite
Impact of Weight on Quality of Life‐Lite
- IWQOL‐Lite‐CT
IWQOL‐Lite Clinical Trials Version
- MCS
Mental Component Summary
- MH
mental health
- PCS
Physical Component Summary
- PF
physical functioning
- PGI‐C
Patient Global Impression of Change
- PGI‐S
Patient Global Impression of Status
- PRO
patient‐reported outcome
- PS
psychosocial
- QoL
quality of life
- RMSEA
root mean square error of approximation
- SF‐36
SF‐36 Health Survey
- SRM
standardized response mean
- TLI
Tucker‐Lewis Index
- WRMR
weighted root mean square residual
1. INTRODUCTION
Obesity has a negative impact on many aspects of health‐related quality of life (HRQOL),1 a multi‐dimensional concept encompassing the impact of one's health status on their physical, mental, social and role functioning; some measures address additional concepts such as spirituality, sexual function, life satisfaction and environment.2 Conversely, weight loss has the potential to improve functioning and physical health among individuals with obesity.3 Accordingly, HRQOL is an important secondary outcome in clinical trials of new interventions for weight loss. Whereas HRQOL may be broadly assessed using generic measures such as the SF‐36 Health Survey (SF‐36)4 and the Sickness Impact Profile,5 disease‐specific measures evaluate these impacts within the context of a specific health condition. Several obesity‐specific measures of HRQOL have been developed,6, 7, 8, 9, 10 including the Impact of Weight on Quality of Life‐Lite (IWQOL‐Lite) questionnaire,11 which is widely used in evaluations of diverse weight‐loss interventions.12, 13, 14, 15, 16, 17
While the IWQOL‐Lite has demonstrated strong psychometric properties,11, 18, 19 the content was initially based on the input of individuals undergoing intensive residential treatment for obesity and related comorbid conditions. As such, the IWQOL‐Lite may include concepts that are not relevant to clinical trial populations (eg, aspects of mobility; experiencing teasing, ridicule or unwanted attention) and may be missing concepts relevant to these populations (eg, energy/stamina; emotional impacts related to weight). Due to these potential limitations in the content validity of the IWQOL‐Lite within this context of use, the US Food and Drug Administration (FDA) has not allowed clinical trial results based on this measure to be described in product labelling. Thus, an alternative version of the IWQOL‐Lite optimized for use in patient populations typically targeted for obesity clinical trials, the IWQOL‐Lite Clinical Trials Version (IWQOL‐Lite‐CT) has been developed based on the input of clinical experts and qualitative research conducted with patients, including both concept elicitation and cognitive debriefing interviews, as well as input from the FDA.20 Specifically, items for the initial 23‐item version of the IWQOL‐Lite‐CT were derived from the IWQOL‐Lite or developed de novo based on interviews conducted with individuals with body mass index (BMI) ≥ 30 kg/m2 (obesity); one item was subsequently removed and several others refined based on interviews conducted with patients with type 2 diabetes and BMI ≥ 27 kg/m2 (overweight or obesity), resulting in a 22‐item version of the IWQOL‐Lite‐CT. The objective of the current study was to finalize the content and evaluate the psychometric properties of the IWQOL‐Lite‐CT in accordance with the FDA patient‐reported outcome (PRO) guidance.21
2. MATERIALS AND METHODS
2.1. Study population
Psychometric analyses of the IWQOL‐Lite‐CT were conducted using data from two randomized trials. Study NCT02453711 (Study 1) was a multi‐national, randomized, double‐blind, placebo‐controlled phase 2 trial of treatment with subcutaneous semaglutide for 52 weeks conducted among individuals with obesity (BMI ≥ 30 kg/m2) and without diabetes. Psychometric analyses were conducted among the subset of US patients who completed the IWQOL‐Lite‐CT at baseline, using baseline through end‐of‐treatment data (n = 329). Study NCT02906930 (Study 2) was a multi‐national, randomized, double‐blind, placebo‐controlled phase 3a trial of treatment with oral semaglutide for 26 weeks in patients with type 2 diabetes mellitus treated with diet and exercise only (not a weight‐loss trial). Psychometric analyses were conducted using baseline through end‐of‐treatment data among the subset of English‐speaking US patients with BMI ≥ 27 kg/m2 who completed the IWQOL‐Lite‐CT at baseline (n = 145). Both trials were conducted in accordance with Good Clinical Practice and the ethical principles of the Declaration of Helsinki and were approved by the clinical study sites' institutional review board or independent ethics committee. In addition, all patients provided informed consent prior to their participation in the clinical trials.
2.2. Measures
The psychometric evaluation utilized four PRO measures in addition to body weight and BMI. Table S1 in the Supporting Information presents the measures included in each study and the time points at which each was assessed. Specifically, developmental versions of the IWQOL‐Lite‐CT were included in Study 1 (the initial 23‐item version) and Study 2 (the 22‐item version). Items were scored with 5‐point graded response scales (1 = never, 2 = rarely, 3 = sometimes, 4 = usually, 5 = always; or 1 = not at all true, 2 = a little true, 3 = moderately true, 4 = mostly true, 5 = completely true), where lower item scores indicate higher levels of functioning.
The following PRO measures also were included in the analyses:
The SF‐36—a generic self‐reported measure of perceived health status, with 36 items scored as eight multiple‐item subscales (physical functioning, role limitations due to physical health problems, bodily pain, general mental health, role limitations due to emotional problems, social functioning, vitality and general health perceptions); both a Physical Component Summary (PCS) score and a Mental Component Summary (MCS) score can also be computed
Patient Global Impression of Change (PGI‐C) items pertaining to physical functioning, mental health and overall quality of life, which assessed change compared with the beginning of the study using a 7‐point graded response scale (1 = much better, 2 = moderately better, 3 = a little better, 4 = no difference, 5 = a little worse, 6 = moderately worse, 7 = much worse)
Patient Global Impression of Status (PGI‐S) items, which assessed current physical functioning and mental health using a 5‐point graded response scale (1 = poor, 2 = fair, 3 = good, 4 = very good, 5 = excellent)
SF‐36 subscale, PCS and MCS scores were computed based on data collected in Studies 1 and 2. PGI‐C items pertaining to physical functioning and mental health were included in Studies 1 and 2, and the PGI‐C item pertaining to overall quality of life was included in Study 1 only. PGI‐S items pertaining to physical functioning and mental health were included in Study 2 only.
2.3. Analytic methods
Standard descriptive statistics were computed to characterize the samples. In addition, item‐level response frequency distributions were examined for floor and ceiling effects for each IWQOL‐Lite‐CT item. A floor or ceiling effect would require that more than 40% of the patients select the worst or best response category, respectively.
Exploratory factor analyses (EFAs) (Study 1) and confirmatory factor analyses (CFAs) (Study 2) were conducted to inform and confirm the structure of the IWQOL‐Lite‐CT, respectively. Factor structure was estimated with mean‐ and variance‐adjusted weighted least squares estimation, and the results of the factor analyses were interpreted using model fit indices, including the root mean square error of approximation (RMSEA), comparative fit index (CFI), Tucker‐Lewis Index (TLI) and standardized and weighted root mean square residual (SRMR and WRMR), as well as the sizes and patterns of the factor loadings and the reasonableness of modifications suggested by the CFAs. Inter‐item correlations were computed to identify potentially redundant items and further inform the scoring method. Consistent with the scoring of the IWQOL‐Lite, items comprising the IWQOL‐Lite‐CT were reverse scored and the composites rescaled to range between 0 and 100, such that higher composite scores indicate higher levels of functioning.
Internal consistency and test‐test reliability of the IWQOL‐Lite‐CT were evaluated. Specifically, Cronbach's coefficient alpha was computed to evaluate the internal consistency of the IWQOL‐Lite‐CT Total score and proposed composites (Physical, Physical Function and Psychosocial).22 The approximate range of optimal alphas suggested by Streiner and Norman for health‐related measures is between 0.70 and 0.90, indicating a set of strongly related items capable of supporting a unidimensional scoring structure but not redundant.23 To evaluate test‐retest reliability, weighted kappa statistics were computed for the IWQOL‐Lite‐CT items, and intraclass correlation coefficients (ICCs) were computed for the IWQOL‐Lite‐CT Total, as well as the Physical, Physical Function and Psychosocial composite scores. Kappa statistics can range from −1 to 1 and are interpreted such that ≤0 is poor, 0‐0.2 indicates slight agreement, 0.21‐0.4 indicates fair agreement, 0.41‐0.6 indicates moderate agreement, 0.61‐0.80 indicates substantial agreement and 0.81‐1.00 indicates almost perfect agreement.24 It is generally recommended that ICCs be at least 0.70 for multi‐item scales (eg, Nunnally and Bernstein25). In Study 1, “test” and “retest” data were IWQOL‐Lite‐CT responses obtained at week 48 and week 52, respectively—a relatively brief time interval during which little change was expected in subjects' weight. To further ensure a suitable sample for this analysis, only patients with less than 5% change in body weight from week 48 to week 52 were used in the test‐retest reliability analyses. In Study 2, “test” and “retest” data were IWQOL‐Lite‐CT responses at week 0 and week 8, respectively. Analyses were conducted using only the subset of patients with less than 5% change in body weight from week 0 to week 8 who rated themselves the same on the corresponding PGI‐S at both time points.
Tests of validity involved evaluations of construct validity and discriminating ability. To evaluate construct validity, cross‐sectional and longitudinal correlations were computed between IWQOL‐Lite‐CT scores and scores on the SF‐36 (PCS, MCS and subscale scores), PGI‐C items and PGI‐S items. In Study 1, at least moderate correlations (|r| ≥ 0.30) were hypothesized between scores on the following measures at each study assessment, as well as for the corresponding change scores (unless otherwise noted):
IWQOL‐Lite‐CT Physical and Physical Function composites and the SF‐36 PCS, as well as the Physical Functioning, Role‐Physical and Vitality subscales
IWQOL‐Lite‐CT Psychosocial composite and the SF‐36 MCS, as well as the Mental Health and Social Functioning subscales
IWQOL‐Lite‐CT Physical and Physical Function composites (change scores only) and the PGI‐C Physical Functioning
IWQOL‐Lite‐CT Psychosocial composite (change scores only) and the PGI‐C Mental Health
IWQOL‐Lite‐CT Total (change scores only) and PGI‐C Quality of Life
In Study 2, at least moderate (positive) correlations (|r| ≥ 0.30) were hypothesized between scores on the following measures at each study assessment, as well as for the corresponding change scores (unless otherwise noted):
IWQOL‐Lite‐CT Physical and Physical Function composites and the SF‐36 PCS; SF‐36 Physical Functioning, Role‐Physical and Vitality subscales; and the PGI‐S Physical Functioning
IWQOL‐Lite‐CT Physical and Physical Function composites (change scores only) and the PGI‐C Physical Functioning
IWQOL‐Lite‐CT Psychosocial composite and the SF‐36 MCS; the SF‐36 Mental Health and Vitality subscales; and the PGI‐S Mental Health
IWQOL‐Lite‐CT Psychosocial composite (change scores only) and the PGI‐C Mental Health
To evaluate discriminating ability, known‐groups analyses of variance (ANOVAs) examined mean differences in IWQOL‐Lite‐CT composite scores between patients classified into subgroups based on BMI and percentage weight loss.
Finally, to evaluate responsiveness, effect sizes, standardized response means and Cohen's d statistics were computed.26 Effect size estimates of approximately 0.20 are considered small, those of approximately 0.50 are moderate and those greater than approximately 0.80 are large.26
3. RESULTS
3.1. Participant characteristics
Table 1 presents the participant characteristics at baseline from Studies 1 and 2.
Table 1.
Patient characteristics at baseline
| Patient characteristic | Study 1 (NCT02453711) (N = 329) | Study 2 (NCT02906930) (N = 145) |
|---|---|---|
| Age (ye), mean (SD), median | 47.86 (11.9), 49.0 | 55.13 (11.5), 56.0 |
| Min, Max | 19.0, 76.0 | 28.0‐79.0 |
| Sex, n (%) | ||
| Male | 116 (35.3) | 77 (53.1) |
| Female | 213 (64.7) | 68 (46.9) |
| Height (m), mean (SD), median | 1.69 (0.1), 1.7 | 1.67 (0.1), 1.7 |
| Min, Max | 1.4, 2.0 | 1.5‐2.0 |
| Weight (kg), mean (SD), median | 113.76 (24.3), 109.8 | 97.92 (22.7), 92.5 |
| Min‐Max | 74.8‐216.3 | 62.6‐210.9 |
| BMI, mean (SD), median | 39.94 (7.6), 38.1 | 34.80 (5.8), 33.2 |
| Min, Max | 29.8, 77.1 | 27.1‐63.1 |
| Race, n (%) | ||
| Asian | 2 (0.6) | 4 (2.8) |
| Black or African American | 57 (17.3) | 29 (20.0) |
| White | 261 (79.3) | 105 (72.4) |
| Native Hawaiian/Pacific Islander | 1 (0.3) | 1 (0.7) |
| American Indian/Alaska Native | 4 (1.2) | 3 (2.1) |
| Other | 4 (1.2) | 3 (2.1) |
| Hispanic or Latino, n (%) | 40 (12.2) | 49 (33.8) |
Abbreviation: BMI, body mass index.
3.2. Response distributions
In Study 1, item‐level frequency distributions generally supported the appropriateness of the response categories. However, at baseline, the following IWQOL‐Lite‐CT items exhibited ceiling effects (ie, reporting “never” or “not at all true”): “Unable to stand comfortably,” “Self‐conscious eating in social settings” and “Avoid social gatherings.” In Study 2, 10 items displayed substantial ceiling effects (ie, reporting “never” or “not at all true”): “Self‐conscious eating in social settings,” “Feel judged by others,” “Less important/worthy of respect,” “Down or depressed about weight,” “Avoid social gatherings,” “Less productive,” “Decreased self‐esteem,” “Self‐conscious about weight” and “Frustrated or upset about weight.” Of note, the amount of time referenced in the item related to standing was increased prior to Study 2 (based on patient input) and did not demonstrate a ceiling effect in that subsequent study.
In Studies 1 and 2, standard descriptive statistics for each IWQOL‐Lite‐CT item were computed at baseline and at each assessment time point to characterize the extent to which patients with obesity and patients with overweight/obesity and type 2 diabetes experience weight‐related functional impacts, and how these impacts change over time (see Tables S2 and S3). Frequency distributions of item‐level responses at baseline and the end of treatment in both studies describe the behaviour of each item, including the assessment of floor and ceiling effects and other potential response biases (see Tables S4 and S5). Descriptive statistics for all IWQOL‐Lite‐CT composite scores are presented in Tables S6 and S7. In Study 1, the mean change of each composite was more than 20 points and exceeded 1 SD of the change scores, and in Study 2, IWQOL‐Lite‐CT composite scores changed only slightly from baseline to week 26, with the Psychosocial composite showing the largest average improvement of 3.58 points. (On the IWQOL‐Lite‐CT composite scores, positive change indicates improvement, in contrast with item scores.) It should also be noted that Study 2 was a trial for treatment of type 2 diabetes mellitus and not a weight‐loss trial.
3.3. Structure and scoring
Inter‐item correlations identified several redundancies. In Study 1, correlations between “Less important/worthy of respect” and “Feel judged by others” were 0.90 at week 28 and 0.93 at week 52, and “Decreased self‐esteem” correlated excessively highly with “Self‐conscious about weight” (0.92 at week 52), “Frustrated or upset about weight” (0.90 at week 28) and “Less confident” (0.91 at week 52). In Study 2, “Decreased self‐esteem” correlated excessively highly with “Self‐conscious about weight” and “Frustrated or upset about weight” at baseline, week 8 and week 26. Table S8 (Study 1) and Table S9 (Study 2) display the inter‐item correlations for the IWQOL‐Lite‐CT.
Scoring was evaluated using EFAs and CFAs. Across the time points in Study 1, the EFA solutions with two factors best balanced model parsimony with acceptable fit indices (ie, RMSEA: 0.079‐0.095; CFI and TLI > 0.95; SRMR < 0.05). Table 2 displays two‐factor EFA solutions at week 28 and week 52 in Study 1. In the two‐factor solutions at all time points, the first factor was dominated by the Physical Function items with the highest loadings, and the items related to discomfort and pain with just slightly smaller loadings. The item “Uncomfortable in small seats” also had minor loadings on the second factor at week 28 and week 52, and “Not physically active” loaded on both factors at all three time points, but was stronger on (Physical) factor 1. The second factor of the two‐factor solutions contained the Psychosocial items, most of which had strong loadings. Only the items “Less productive,” “Lack sufficient energy” and “Worried about health” had dual loadings on both factors at all time points, with stronger loadings on the second (Psychosocial) factor at week 28 and week 52. Table 3 presents three sets of CFA models for Study 2, analysed at all three time points using a two‐factor (Psychosocial and Physical) and a three‐factor (Psychosocial, Physical Function and Pain/Discomfort) structure. The first confirmatory factor structures with no cross‐loading were used for simple raw scoring, and the other two were modified with double loadings to attain best fit. The strongest loadings were consistently shown in the proposed structure across CFAs. Thus, analyses supported the structure of the IWQOL‐Lite‐CT shown in Figure 1.
Table 2.
IWQOL‐Lite‐CT exploratory factor analysis factor loadings (SEs) at week 28 and week 52: Study 1 (NCT02453711)
| IWQOL‐Lite‐CT item | Week 28 two factors | Week 52 two factors | ||
|---|---|---|---|---|
| 1 | 2 | 1 | 2 | |
| Trouble bending over | 0.92 (0.04) | −0.06 (0.04) | 0.82 (0.05) | 0.09 (0.06) |
| Tired or winded | 0.91 (0.04) | −0.02 (0.05) | 0.88 (0.05) | 0.03 (0.05) |
| Unable to stand comfortably | 0.88 (0.05) | −0.09 (0.05) | 0.96 (0.04) | −0.17 (0.03) |
| Uncomfortable in small seats | 0.55 (0.06) | 0.33 (0.06) | 0.56 (0.07) | 0.34 (0.07) |
| Bodily pain | 0.53 (0.07) | 0.21 (0.07) | 0.63 (0.07) | 0.16 (0.08) |
| Self‐conscious eating in social settings | 0.27 (0.07) | 0.56 (0.06) | 0.22 (0.08) | 0.66 (0.07) |
| Less confident | 0.05 (0.05) | 0.84 (0.03) | 0.02 (0.04) | 0.93 (0.03) |
| Feel judged by others | 0.05 (0.05) | 0.85 (0.04) | 0.08 (0.05) | 0.87 (0.04) |
| Less important/worthy of respect | 0.00 (0.05) | 0.88 (0.04) | 0.09 (0.06) | 0.83 (0.04) |
| Frustrated shopping for clothes | 0.05 (0.06) | 0.79 (0.04) | 0.21 (0.06) | 0.74 (0.05) |
| Feel bad or upset about pictures of self | −0.01 (0.04) | 0.90 (0.03) | −0.02 (0.04) | 0.95 (0.03) |
| Down or depressed about weight | −0.01 (0.04) | 0.86 (0.03) | −0.05 (0.04) | 0.96 (0.03) |
| Less interested in sexual activity | 0.04 (0.06) | 0.75 (0.05) | 0.233 (0.06) | 0.63 (0.06) |
| Avoid social gatherings | 0.12 (0.07) | 0.73 (0.06) | 0.18 (0.07) | 0.72 (0.07) |
| Less productive | 0.43 (0.06) | 0.53 (0.06) | 0.42 (0.07) | 0.57 (0.07) |
| Lack energy | 0.43 (0.05) | 0.56 (0.05) | 0.45 (0.05) | 0.53 (0.05) |
| Not physically active | 0.41 (0.06) | 0.49 (0.06) | 0.52 (0.06) | 0.40 (0.07) |
| Unable to walk far/quickly | 0.64 (0.06) | 0.30 (0.06) | 0.76 (0.05) | 0.14 (0.06) |
| Worried about health | 0.39 (0.06) | 0.50 (0.06) | 0.30 (0.06) | 0.56 (0.05) |
| Decreased self‐esteem | −0.09 (0.04) | 0.98 (0.02) | −0.10 (0.08) | 0.99 (0.03) |
| Self‐conscious about weight | −0.10 (0.04) | 0.98 (0.02) | −0.15 (0.03) | 1.10 (0.02) |
| Frustrated or upset about weight | −0.08 (0.03) | 0.99 (0.02) | −0.06 (0.04) | 0.97 (0.02) |
Note: One item (“I get frustrated choosing what to wear”) was eliminated prior to the evaluation based on qualitative data.
Abbreviation: IWQOL‐Lite‐CT, Impact of Weight on Quality of Life‐Lite Clinical Trials Version.
Table 3.
Confirmatory factor analysis fit indices: Study 2 (NCT02906930)
| Time point | Two factors | Three factors | ||||||
|---|---|---|---|---|---|---|---|---|
| RMSEA | CFI | TLI | WRMR | RMSEA | CFI | TLI | WRMR | |
| First set of CFAs—no double loadings | ||||||||
| Baseline | 0.110 | 0.937 | 0.929 | 1.239 | 0.112 | 0.936 | 0.927 | 1.233 |
| Week 8 | 0.107 | 0.956 | 0.950 | 1.112 | 0.109 | 0.955 | 0.949 | 1.110 |
| Week 26 | 0.116 | 0.948 | 0.942 | 1.215 | 0.117 | 0.948 | 0.941 | 1.211 |
| Second set of CFAs—double loadings for Items 4, 14, 15, 16 and 19 as shown in previous EFAs | ||||||||
| Baseline | 0.084 | 0.965 | 0.959 | 0.940 | 0.085 | 0.964 | 0.957 | 0.937 |
| Week 8 | 0.086 | 0.973 | 0.968 | 0.864 | 0.088 | 0.971 | 0.967 | 0.863 |
| Week 26 | 0.082 | 0.975 | 0.971 | 0.863 | 0.083 | 0.974 | 0.970 | 0.856 |
| Third set of CFAs—double loadings for Items 4, 14, 15, 16, 19 and 12 as suggested in modification | ||||||||
| Baseline | 0.076 | 0.971 | 0.966 | 0.867 | 0.078 | 0.970 | 0.965 | 0.863 |
| Week 8 | 0.069 | 0.982 | 0.979 | 0.742 | 0.072 | 0.981 | 0.978 | 0.741 |
| Week 26 | 0.076 | 0.978 | 0.975 | 0.806 | 0.077 | 0.978 | 0.974 | 0.797 |
Note: One item (“I get frustrated choosing what to wear”) was eliminated prior to the evaluation based on qualitative data.
Abbreviations: CFA, confirmatory factor analysis; CFI, comparative fit index; RMSEA, root mean square error of approximation; TLI, Tucker‐Lewis Index; WRMR, weighted root mean square residual.
Figure 1.
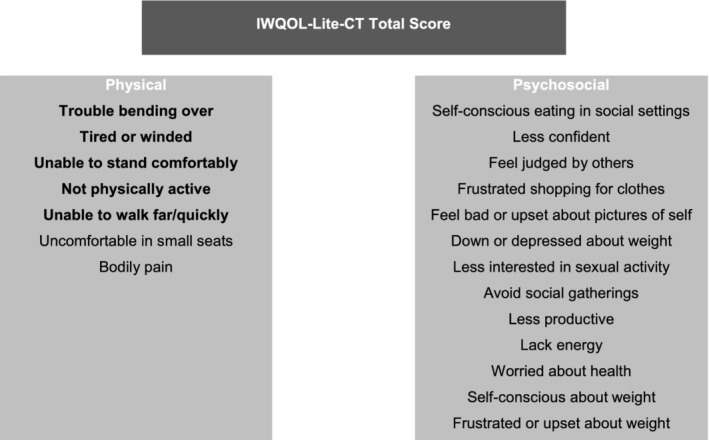
Impact of Weight on Quality of Life‐Lite‐Clinical Trials Version structure. The Physical Function composite includes the items in bold. Abbreviation: IWQOL‐Lite‐CT, Impact of Weight on Quality of Life‐Lite Clinical Trials Version
3.4. Reliability
Internal consistency reliability was satisfactory for all composite scores at each time point in both studies (alpha ≥0.77) (see Table S10). In Study 1, alphas for the Physical composite were 0.87 at baseline and 0.90 at week 52, while alphas for the Physical Function composite were 0.84 at baseline and 0.86 at week 52; alphas for the Psychosocial composite were 0.94 and 0.96 at baseline and week 52, respectively. Alphas for the IWQOL‐Lite‐CT Total score were 0.95 at baseline and 0.96 at week 52. In Study 2, alphas for the Physical composite were 0.81 at baseline and 0.87 at week 26, while alphas for the Physical Function composite were 0.77 at baseline and 0.84 at week 26; alphas for the Psychosocial composite were 0.92 and 0.94 at baseline and week 26, respectively. Alphas for the IWQOL‐Lite‐CT Total score were 0.93 at baseline and 0.94 at week 26.
Item‐ and composite‐level test‐retest reliabilities were satisfactory. ICCs were ≥ 0.80 for all composite scores at each time point in both studies (Table S11). In addition, in Study 1, item‐level kappas ranged from 0.67 (“Less productive”) to 0.82 (“Feel bad or upset about pictures of self”), indicating substantial test‐retest agreement from week 48 to week 52 (data not shown).
3.5. Validity
Cross‐sectional correlational analyses provided support for the construct validity of the IWQOL‐Lite‐CT composite scores (Tables S12 and S13). In Study 1, IWQOL‐Lite‐CT Physical and Physical Function scores correlated strongly with the SF‐36 PCS score (0.74 and 0.71, respectively, at baseline; 0.78 and 0.76 at week 52) and the SF‐36 Physical Functioning (0.71 and 0.70, respectively, at baseline; 0.75 and 0.75 at week 52), Role‐Physical (0.62 and 0.60, respectively, at baseline; 0.66 and 0.67 at week 52) and Vitality (0.61 and 0.59, respectively, at baseline; 0.57 and 0.56 at week 52) subscale scores. In addition, IWQOL‐Lite‐CT Psychosocial scores correlated moderately to strongly with scores on the SF‐36 MCS (0.49 at baseline; 0.41 at week 52), as well as the Mental Health (0.55 at baseline; 0.43 at week 52) and Social Functioning (0.51 at baseline; 0.36 at week 52) subscales. In Study 2, IWQOL‐Lite‐CT Physical and Physical Function scores correlated strongly with the PGI‐S Physical Functioning, SF‐36 PCS and SF‐36 Physical Functioning, Role‐Physical and Vitality subscale scores, with correlations ranging from 0.54 to 0.69 at baseline and from 0.58 to 0.79 at week 26. IWQOL‐Lite‐CT Psychosocial scores correlated moderately with scores on the SF‐36 MCS (0.48 at baseline; 0.53 at week 26) and correlated strongly with the SF‐36 Mental Health (0.50 at baseline; 0.54 at week 26) and Vitality (0.59 at baseline; 0.64 at week 26) subscales, as well as with the PGI‐S Mental Health (0.73 at baseline; and 0.63 at week 26).
Longitudinal analyses provided additional support for the construct validity of the composite scores (Tables S14 and S15). In Study 1, changes in IWQOL‐Lite‐CT Physical and Physical Function scores were strongly correlated with changes in the SF‐36 PCS (r = 0.70 and 0.69), as well as the SF‐36 Physical Functioning (r = 0.63 and 0.64), Role‐Physical (r = 0.59 and 0.57) and Vitality (r = 0.55 and 0.54) subscales and were moderately correlated with the PGI‐C Physical Function (r = −0.43 and − 0.43), as hypothesized. Also as hypothesized, changes in the IWQOL‐Lite‐CT Psychosocial composite score were moderately correlated with changes in the SF‐36 MCS (r = 0.37), the Mental Health (r = 0.39) and Social Functioning (r = 0.37) subscales and the PGI‐C Mental Health (r = −0.39). The IWQOL‐Lite‐CT Total score was moderately correlated with the PGI‐C Quality of Life (−0.40). In Study 2, most correlations were smaller than predicted (r < 0.30), unsurprisingly given the limited ranges of changes. Specifically, correlations between changes in IWQOL‐Lite‐CT Physical and Physical Function scores and changes in SF‐36 PCS scores were both 0.24. Changes in IWQOL‐Lite‐CT Physical and Physical Function scores correlated weakly to moderately with changes in the SF‐36 Physical Functioning (r = 0.22 and r = 0.24, respectively), Role‐Physical (r = 0.19 and r = 0.21, respectively) and Vitality (r = 0.29 and r = 0.30, respectively) subscales, as well as with changes in the PGI‐S Physical Functioning (r = 0.21 and 0.24, respectively) and with the PGI‐C Physical Functioning (r = −0.30 and r = −0.26, respectively). Changes in the IWQOL‐Lite‐CT Psychosocial composite score correlated weakly with changes in SF‐36 MCS (r = 0.24), Mental Health (r = 0.22), Role‐Emotional (r = 0.12), Social Functioning (r = 0.15) and PGI‐C Mental Health (r = −0.24), but moderately with SF‐36 Vitality (r = 0.37) and PGI‐S Mental Health (r = 0.32).
Known‐groups ANOVAs supplied evidence of the discriminating ability of the IWQOL‐Lite‐CT composites. The first known‐groups analyses in Study 1 hypothesized that patients with weight loss of 5% or more would have better (higher) IWQOL‐Lite‐CT composite scores compared with patients who experienced weight gain. All mean differences were in the hypothesized direction. At week 28, subgroup differences for Physical and Physical Function scores were statistically significant (P < 0.01), but at week 52, subgroup differences were statistically significant only for the Physical Function score (P < 0.01) (Table S16). A second set of known‐groups analyses in Study 1 hypothesized that patients with BMIs < 35 kg/m2 would have better IWQOL‐Lite‐CT scores compared with patients with BMIs > 40 kg/m2. All composite scores demonstrated statistically significant group differences in the expected direction (Table S16). To yield results comparable with those from Study 2, a post hoc known‐groups analysis was conducted to compare the IWQOL‐Lite‐CT scores of patients with BMIs < 30 kg/m2 to those with patients with BMIs > 42 kg/m2. *All composite scores demonstrated significant differences between these two groups of patients in the expected direction (Table S17).
In the Study 2 known‐groups analyses, all composite scores were in the correct direction but were not significantly different for patients with ≥5% weight loss vs patients with weight gain at week 26 (Table S16). However, all composite scores demonstrated statistically significant group differences in the expected direction among patients with BMI < 30 kg/m2 vs patients with BMI > 42 kg/m2 at weeks 8 and 26 (P < 0.01) (Table S17).
3.6. Responsiveness
Table 4 presents the responsiveness of the IWQOL‐Lite‐CT effect‐size estimates, standardized response means (SRMs) and Cohen's d statistics. In Study 1, all IWQOL‐Lite‐CT composite scores achieved large SRMs (greater than 1.0) and effect‐size estimates at week 52. The Cohen's d statistics for all composite scores also demonstrated the proper pattern. Specifically, Cohen's d statistics comparing the improved patients with the worsened patients were positive and greater (ranging from 0.5 to 1.1 at week 28 and from 1.1 to 1.3 at week 52) than either of the comparisons with the unchanged patients. The improved vs unchanged Cohen's d statistics based on 5% change in body weight at week 52 tended to be greater in size than those based on improved vs unchanged PGI‐C, although the week 28 analysis based on 5% change in body weight was uninformative due to the small sample size (n < 5). A parallel responsiveness analysis based on 10% change in body weight was similarly uninformative because sample sizes were less than 5 (data not shown). The IWQOL‐Lite‐CT items that exhibited ceiling effects (ie, “Unable to stand comfortably,” “Self‐conscious eating in social settings,” “Avoid social gatherings,” “Less important/worthy of respect,” “Less interested in sexual activity” and “Less productive”) had somewhat smaller responsiveness statistics, as expected (data not shown). Moreover, the items “Self‐conscious eating in social settings” and “Less important/worthy of respect” had smaller responsiveness statistics than expected.
Table 4.
Ability to detect change—Effect‐size estimates, standardized response means and Cohen's d statistics
| Cohen's d—PGI‐S | Cohen's d—PGI‐C | Cohen's d—5% change in weight | |||||||||
|---|---|---|---|---|---|---|---|---|---|---|---|
| Scores | Effect‐size estimate | SRM | Improved vs unchanged | Worsened vs unchanged | Improved vs worsened | Improved vs unchanged | Worsened vs unchanged | Improved vs worsened | Improved vs unchanged | Worsened vs unchanged | Improved vs worsened |
| Study 1 (NCT02453711) | |||||||||||
| Baseline to week 28 | |||||||||||
| IWQOL‐Lite‐CT totala | 0.9 | 1.1 | — | — | — | 0.2 | −2.3 | 1.1 | 0.5 | — | — |
| Physicalb | 0.8 | 1.0 | — | — | — | 0.3 | −0.8 | 0.6 | 0.6 | — | — |
| Physical functionb | 0.8 | 1.0 | — | — | — | 0.4 | −0.7 | 0.5 | 0.6 | — | — |
| Psychosocialc | 0.8 | 1.1 | — | — | — | 0.4 | −0.9 | 0.8 | 0.4 | — | — |
| Baseline to week 52 | |||||||||||
| IWQOL‐Lite‐CT totala | 1.1 | 1.2 | — | — | — | 0.6 | −0.6 | 1.3 | 0.7 | −0.8 | 2.5 |
| Physicalb | 1.0 | 1.0 | — | — | — | 0.4 | −0.6 | 1.3 | 0.6 | −1.0 | 3.2 |
| Physical functionb | 1.0 | 1.0 | — | — | — | 0.5 | −0.6 | 1.2 | 0.7 | −1.2 | 3.5 |
| Psychosocialc | 1.0 | 1.1 | — | — | — | 0.7 | −1.0 | 1.1 | 0.7 | −0.6 | 1.8 |
| Study 2 (NCT02906930) | |||||||||||
| IWQOL‐Lite‐CT total d | 0.1 | 0.2 | 0.4 | −0.5 | 0.9 | 0.7 | — | — | 0.2 | 0.2 | −0.0 |
| Physical e | 0.1 | 0.1 | 0.5 | −0.2 | 0.6 | 0.4 | — | — | 0.0 | −0.1 | 0.1 |
| Physical function e | 0.1 | 0.1 | 0.5 | −0.3 | 0.6 | 0.4 | — | — | −0.0 | −0.1 | 0.1 |
| Psychosocial f | 0.2 | 0.2 | 0.4 | −0.4 | 0.8 | 0.4 | −0.1 | 0.4 | 0.3 | 0.4 | −0.1 |
Abbreviations: IWQOL‐Lite‐CT, Impact of Weight on Quality of Life‐Lite Clinical Trials Version; MH, mental health; PF, physical functioning; PGI‐C, Patient Global Impression of Change; PGI‐S, Patient Global Impression of Status; PS, psychosocial; QoL, quality of life; SRM, standardized response mean.
Notes: PGI‐C improved = 1 (“much better”), 2 (“moderately better”), or 3 (“a little better”); unchanged = 4 (“no difference”); and worsened = 5 (“a little worse”), 6 (“moderately worse”), or 7 (“much worse”). Body weight improved = 5% or more weight loss, unchanged = weight change (gain or loss) less than 5%, worsened = 5% or more gain in weight.
Using PGI‐C QoL.
Using PGI‐C PF.
Using PGI‐C PS.
Using both PGI‐S PF and PGI‐S MH or PGI‐C PF and PGI‐C MH.
Using PGI‐S PF or PGI‐C PF.
Using PGI‐S MH or PGI‐C MH.
In Study 2, IWQOL‐Lite‐CT composite scores at week 26 yielded effect‐size estimates and SRMs that were smaller than those in Study 1, which was unsurprising given that there were only minor changes in BMI from baseline to the end of the study.
3.7. Final IWQOL‐Lite‐CT measure
Three items that were essentially redundant with others were eliminated from the initial 23‐item IWQOL‐Lite‐CT described by Kolotkin and colleagues.20 Specifically, qualitative research conducted by Kolotkin and colleagues recommended removal of the item “Frustrated choosing what to wear,” and Study 1 analyses confirmed the removal of this item. In addition, the Study 1 analyses suggested removal of the items “Less important/worthy of respect” and “Decreased self‐esteem” and Study 2 analyses confirmed removal of these items. The final 20‐item IWQOL‐Lite‐CT includes two primary domains: Physical (seven items) and Psychosocial (13 items) (Table S18). Based on feedback from the FDA and to facilitate labelling in the United States, a five‐item subset of the Physical domain, the Physical Function composite, was also evaluated and supported. In addition, the IWQOL‐Lite‐CT was evaluated with Spanish speakers in Study 2 (data not shown), and the results were generally satisfactory for the small sample.
4. DISCUSSION
The IWQOL‐Lite‐CT was rigorously developed to assess weight‐related changes in physical and psychosocial functioning in patients with overweight and obesity and in accordance with recommendations from the FDA's PRO guidance.21 The final 20‐item IWQOL‐Lite‐CT yields a Total score and three composite scores: Physical (seven items), including Physical Function (five items) and Psychosocial (13 items). Consistent with feedback from patients during the development of the IWQOL‐Lite‐CT, item‐level frequency distributions generally supported the appropriateness of the response categories. Two psychosocial items that were most relevant to qualitative research participants with higher BMIs, “Self‐conscious eating in social settings” and “Avoid social gatherings,” demonstrated ceiling effects at baseline in both studies but did not overtly impact the distributions of the composite scores or impair their responsiveness. Three items that exhibited excessively high inter‐item correlations and were essentially redundant with others were removed from the scale to reduce patient burden without sacrificing content validity.
The proposed scoring of the IWQOL‐Lite‐CT was evaluated and supported using both exploratory and CFA methods. Internal consistency reliabilities of the IWQOL‐Lite‐CT composite scores supported the mean scoring of the IWQOL‐Lite‐CT composites, and test‐retest reliabilities were satisfactory.25 Correlational analyses provided support for the construct validity of the IWQOL‐Lite‐CT composite scores, and known‐groups ANOVAs supported the discriminating ability of the IWQOL‐Lite‐CT scores. In Study 1, responsiveness statistics were large at week 52, providing evidence that the IWQOL‐Lite‐CT composites are easily capable of detecting changes in the physical and psychosocial functioning of patients with obesity. In Study 2, while responsiveness statistics were small at week 26, this is not surprising given that there were only minor changes in BMI from baseline to the end of the study.
Several established measures are available to assess the impact of obesity on patient functioning and HRQOL,6, 7, 8, 9, 10 including the original 31‐item IWQOL‐Lite, developed in 2001.11 The original IWQOL‐Lite is still widely used to evaluate the impact of obesity and the potential benefits of weight‐loss interventions, and the evidence base established since its development in 2001 provides valuable knowledge for use in clinical research and clinical practice. While the IWQOL‐Lite and the IWQOL‐Lite CT are intended to capture weight‐related functioning in different contexts, both versions include items pertaining to physical functioning, mobility, bodily pain, self‐confidence/self‐esteem, productivity and sexual life. In addition, both measures emphasize physical functioning and self‐confidence/self‐esteem: whereas the IWQOL‐Lite‐CT contains five items relating to physical functioning and five items relating to self‐confidence/self‐esteem, the IWQOL‐Lite contains 14 items and seven items, respectively, relating to these concepts.
Because the IWQOL‐Lite‐CT has been specifically developed for use in obesity clinical trials, it addresses concerns that are specifically relevant to participants in these trials. Further, the content of the IWQOL‐Lite‐CT is comprehensive, covering the full range of concerns in this population, and previous qualitative research has shown that the items are easily understood.20 Thus, the measure may yield results that are more informative and may be more sensitive to change than results of other measures of HRQOL and functioning. Moreover, the IWQOL‐Lite‐CT was developed and validated according to the FDA guidance on PROs, which describes the developmental rigour required to support the use of PRO measures in US labelling claims.
The selection of outcomes based on the IWQOL‐Lite‐CT can also be tailored to the goals of the clinical trial sponsor and context of use. In particular, the five‐item Physical Function composite has been developed for the purpose of supporting labelling in the US; however, the seven‐item Physical, 13‐item Psychosocial and Total scores provide a more comprehensive assessment of treatment benefit for description in publications, as well as submissions to payers and regulators outside of the United States.
Some limitations of this study must be noted. The psychometric analyses were conducted in the context of clinical trials that enrolled a primarily US population. Additional research will be required to validate the IWQOL‐Lite‐CT for other populations. Moreover, the measure was tested on participants in pharmaceutical clinical trials for obesity, and it is unknown whether results could be generalized to other populations or settings or would be influenced by the type of weight‐loss interventions. Finally, Study 2 was conducted in patients with type 2 diabetes mellitus (not a weight‐loss trial), was shorter than Study 1 (26 vs 52 weeks), and yielded modest average change in weight and, consequently, modest change in IWQOL‐Lite‐CT scores, even among participants receiving the active treatment, which limited the opportunities for evaluation of longitudinal psychometric properties, particularly responsiveness, in this study.
5. CONCLUSIONS
The IWQOL‐Lite‐CT is a reliable, valid, and responsive measure of weight‐related functioning in populations commonly targeted for obesity clinical trials, including those for new weight‐loss medications. The Physical Function scale may be particularly appropriate to support product labelling based on the proximal nature of changes in the underlying construct to changes in patients' weight. Qualification from the FDA is being sought for use of the IWQOL‐Lite‐CT in clinical trials to support product approval and labelling claims. Digital versions of the questionnaire, for both web and mobile applications, are also being developed to facilitate their use in trials and improve the accuracy and reliability of reported data.
CONFLICT OF INTEREST
This study was conducted under a research contract between Novo Nordisk and RTI Health Solutions and was funded by Novo Nordisk. R.L.K. is a consultant for Novo Nordisk and RTI Health Solutions. V.S.L.W., C.M.E., N.W., S.Q. and S.E.F. are salaried employees of RTI Health Solutions. H.H.M. and L.H.S. are salaried employees of Novo Nordisk.
AUTHOR CONTRIBUTION
H.H.M. and L.H.S. initiated the study. V.S.L.W., N.W., S.Q., C.M.E. and S.E.F. designed the study, with input from R.L.K., H.H.M. and L.H.S. V.S.L.W., N.W. and S.Q. conducted the psychometric analyses. All authors interpreted the data, were involved in writing the manuscript, and had final approval of the submitted version.
Supporting information
Table S1 Flow chart of key assessments and procedures for the IWQOL‐Lite‐CT validation analyses
Table S2. IWQOL‐Lite‐CT item‐level descriptive statistics: Study 1 (NCT02453711)
Table S3. IWQOL‐Lite‐CT item‐level descriptive statistics: Study 2 (NCT02906930)
Table S4. IWQOL‐Lite‐CT item‐level response frequency (%) distributions for analysis data set: Study 1 (NCT02453711)
Table S5. IWQOL‐Lite‐CT item‐level response frequency (%) distributions for analysis data set: Study 2 (NCT02906930)
Table S6. IWQOL‐Lite‐CT composite‐level descriptive statistics: Study 1 (NCT02453711)
Table S7. IWQOL‐Lite‐CT composite‐level descriptive statistics, English‐speaking patients: Study 2 (NCT02906930)
Table S8. IWQOL‐Lite‐CT inter‐item correlations—baseline and week 52 (n = 259): Study 1 (NCT02453711)
Table S9. IWQOL‐Lite‐CT inter‐item correlations—baseline and week 26 (n = 34‐145): Study 2 (NCT02906930)
Table S10. Internal consistency reliability—Cronbach's alphas: IWQOL‐Lite‐CT composite scores
Table S11. Test‐retest reliability: IWQOL‐Lite‐CT item and composite scores
Table S12. Construct validity correlations: Study 1 (NCT02453711)
Table S13. Construct validity correlations: Study 2 (NCT02906930)
Table S14. Correlations between change from baseline to week 52 (n = 259): Study 1 (NCT02453711)
Table S15. Correlations between change from baseline to week 26: Study 2 (NCT02906930) (English‐speaking patients, n = 130‐132)
Table S16. Known‐groups ANOVAs: Weight change
Table S17. Known‐groups ANOVAs: BMI classification
Table S18. IWQOL‐Lite‐CT concepts
ACKNOWLEDGEMENTS
Kate Lothman of RTI Health Solutions provided medical writing services, which were funded by Novo Nordisk.
Kolotkin RL, Williams VSL, Ervin CM, et al. Validation of a new measure of quality of life in obesity trials: Impact of Weight on Quality of Life‐Lite Clinical Trials Version. Clin Obes. 2019;9:e12310. 10.1111/cob.12310
Funding information Novo Nordisk A/S
The lower classification corresponds to patients who are overweight but do not have obesity, while the higher classification was based on empirical distributions of BMIs from previous research.
The lower classification corresponds to patients who are overweight but do not have obesity, while the higher classification was based on empirical distributions of BMIs from previous research.
REFERENCES
- 1. Ul‐Haq Z, Mackay DF, Fenwick E, Pell JP. Meta‐analysis of the association between body mass index and health‐related quality of life among adults, assessed by the SF‐36. Obesity (Silver Spring). 2013;21:E322‐E327. [DOI] [PubMed] [Google Scholar]
- 2. Andresen EM, Meyers AR. Health‐related quality of life outcomes measures. Arch Phys Med Rehabil. 2000;81 (12 Suppl 2):S30‐S45. [DOI] [PubMed] [Google Scholar]
- 3. Warkentin LM, Das D, Majumdar SR, Johnson JA, Padwal RS. The effect of weight loss on health‐related quality of life: systematic review and meta‐analysis of randomized trials. Obes Rev. 2013;15:169‐182. [DOI] [PubMed] [Google Scholar]
- 4. Optum Inc . SF health surveys. http://campaign.optum.com/optum-outcomes/what-we-do/health-surveys/sf-36v2-health-survey.html. Accessed October 10, 2018.
- 5. Bergner M, Bobbitt RA, Carter WB, Gilson BS. The sickness impact profile: development and final revision of a health status measure. Med Care. 1981;19:787‐805. [DOI] [PubMed] [Google Scholar]
- 6. Patrick DL, Bushnell DM, Rothman M. Performance of two self‐report measures for evaluating obesity and weight loss. Obes Res. 2004;12:48‐57. [DOI] [PubMed] [Google Scholar]
- 7. Karlsson J, Taft C, Sjostrom L, Torgerson JS, Sullivan M. Psychosocial functioning in the obese before and after weight reduction: construct validity and responsiveness of the obesity‐related problems scale. Int J Obes Relat Metab Disord. 2003;27:617‐630. [DOI] [PubMed] [Google Scholar]
- 8. Moorehead MK, Ardelt‐Gattinger E, Lechner H, Oria HE. The validation of the Moorehead‐Ardelt quality of life questionnaire II. Obes Surg. 2003;13:684‐692. [DOI] [PubMed] [Google Scholar]
- 9. Weiner S, Sauerland S, Fein M, Blanco R, Pomhoff I, Weiner RA. The bariatric quality of life index: a measure of well‐being in obesity surgery patients. Obes Surg. 2005;15:538‐545. [DOI] [PubMed] [Google Scholar]
- 10. Tayyem RM, Atkinson JM, Martin CR. Development and validation of a new bariatric‐specific health‐related quality of life instrument “bariatric and obesity‐specific survey (BOSS)”. J Postgrad Med. 2014;60:357‐361. [DOI] [PubMed] [Google Scholar]
- 11. Kolotkin RL, Crosby RD, Kosloski KD, Williams GR. Development of a brief measure to assess quality of life in obesity. Obes Res. 2001;9:102‐111. [DOI] [PubMed] [Google Scholar]
- 12. Pearl RL, Wadden TA, Tronieri JS, et al. Short‐ and long‐term changes in health‐related quality of life with weight loss: results from a randomized controlled trial. Obesity. 2018;26:985‐991. [DOI] [PMC free article] [PubMed] [Google Scholar]
- 13. Cai J, Delahanty LM, Akapame S, Slee A, Traina S. Impact of canagliflozin treatment on health‐related quality of life among people with type 2 diabetes mellitus: a pooled analysis of patient‐reported outcomes from randomized controlled trials. Patient. 2018;11:341‐352. [DOI] [PMC free article] [PubMed] [Google Scholar]
- 14. Morales‐Conde S, Alarcón del Agua I, Busetto L, et al. Implanted closed‐loop gastric electrical stimulation (CLGES) system with sensor‐based feedback safely limits weight regain at 24 months. Obes Surg. 2018;28:1766‐1774. [DOI] [PubMed] [Google Scholar]
- 15. Halseth A, Shan K, Gilder K, Malone M, Acevedo L, Fujioka K. Quality of life, binge eating, and sexual function in participants treated for obesity with sustained release naltrexone/bupropion. Obes Sci Pract. 2018;4:141‐152. [DOI] [PMC free article] [PubMed] [Google Scholar]
- 16. Apovian CM, Shah SN, Wolfe BM, et al. Two‐year outcomes of vagal nerve blocking (vBloc) for the treatment of obesity in the ReCharge trial. Obes Surg. 2017;27:169‐176. [DOI] [PMC free article] [PubMed] [Google Scholar]
- 17. Kolotkin RL, Kim J, Davidson LE, Crosby RD, Hunt SC, Adams TD. 12‐year trajectory of health‐related quality of life in gastric bypass patients vs. comparison groups. Surg Obes Related Dis. 2018;14:1359‐1365. [DOI] [PubMed] [Google Scholar]
- 18. Kolotkin RL, Crosby RD. Psychometric evaluation of the impact of weight on quality of life‐lite questionnaire (IWQOL‐lite) in a community sample. Qual Life Res. 2002;11:157‐171. [DOI] [PubMed] [Google Scholar]
- 19. Kolotkin RL, Crosby RD, Williams GR, Hartley GG, Nicol S. The relationship between health‐related quality of life and weight loss. Obes Res. 2001;9:564‐571. [DOI] [PubMed] [Google Scholar]
- 20. Kolotkin RL, Ervin CM, Meincke HH, Højbjerre L, Fehnel SE. Development of a clinical trials version of the impact of weight on quality of life‐lite questionnaire (IWQOL‐lite clinical trials version): results from two qualitative studies. Clin Obes. 2017;7(5):290‐299. [DOI] [PMC free article] [PubMed] [Google Scholar]
- 21. Food and Drug Administration . Guidance for industry. Patient‐reported outcome measures: use in medical product development to support labeling claims. December 2009. http://www.fda.gov/downloads/Drugs/GuidanceComplianceRegulatoryInformation/Guidances/UCM193282.pdf. Accessed August 22, 2018.
- 22. Cronbach L. Coefficient alpha and the internal structure of tests. Psychometrika. 1951;16:294‐334. [Google Scholar]
- 23. Streiner DL, Norman GR. Health Measurement Scales: A Practical Guide to Their Development and Use. 2nd ed. New York, NY: Oxford University Press; 1995. [Google Scholar]
- 24. Landis JR, Koch GG. The measurement of observer agreement for categorical data. Biometrics. 1977;33:159‐174. [PubMed] [Google Scholar]
- 25. Nunnally JC, Bernstein IH. Psychometric Theory. 3rd edn. New York, NY: McGraw‐Hill; 1994. [Google Scholar]
- 26. Cohen J. Statistical Power Analysis for the Behavioral Sciences. 2nd ed. Hillsdale NJ: Erlbaum; 1988. [Google Scholar]
Associated Data
This section collects any data citations, data availability statements, or supplementary materials included in this article.
Supplementary Materials
Table S1 Flow chart of key assessments and procedures for the IWQOL‐Lite‐CT validation analyses
Table S2. IWQOL‐Lite‐CT item‐level descriptive statistics: Study 1 (NCT02453711)
Table S3. IWQOL‐Lite‐CT item‐level descriptive statistics: Study 2 (NCT02906930)
Table S4. IWQOL‐Lite‐CT item‐level response frequency (%) distributions for analysis data set: Study 1 (NCT02453711)
Table S5. IWQOL‐Lite‐CT item‐level response frequency (%) distributions for analysis data set: Study 2 (NCT02906930)
Table S6. IWQOL‐Lite‐CT composite‐level descriptive statistics: Study 1 (NCT02453711)
Table S7. IWQOL‐Lite‐CT composite‐level descriptive statistics, English‐speaking patients: Study 2 (NCT02906930)
Table S8. IWQOL‐Lite‐CT inter‐item correlations—baseline and week 52 (n = 259): Study 1 (NCT02453711)
Table S9. IWQOL‐Lite‐CT inter‐item correlations—baseline and week 26 (n = 34‐145): Study 2 (NCT02906930)
Table S10. Internal consistency reliability—Cronbach's alphas: IWQOL‐Lite‐CT composite scores
Table S11. Test‐retest reliability: IWQOL‐Lite‐CT item and composite scores
Table S12. Construct validity correlations: Study 1 (NCT02453711)
Table S13. Construct validity correlations: Study 2 (NCT02906930)
Table S14. Correlations between change from baseline to week 52 (n = 259): Study 1 (NCT02453711)
Table S15. Correlations between change from baseline to week 26: Study 2 (NCT02906930) (English‐speaking patients, n = 130‐132)
Table S16. Known‐groups ANOVAs: Weight change
Table S17. Known‐groups ANOVAs: BMI classification
Table S18. IWQOL‐Lite‐CT concepts