Abstract
Purpose
The goal of this study was to achieve high temporal resolution, multi‐time point pseudo‐continuous arterial spin labeling (pCASL) MRI in a time‐efficient manner, while maintaining whole‐brain coverage.
Methods
A Hadamard 8‐matrix was used to dynamically encode the pCASL labeling train, thereby providing the first source of temporal information. The second method for obtaining dynamic arterial spin labeling (ASL) signal consisted of a Look‐Locker (LL) readout of 4 phases that are acquired with a flip‐angle sweep to maintain constant sensitivity over the phases. To obtain whole‐brain coverage in the short LL interval, 4 slices were excited simultaneously by multi‐banded radiofrequency pulses. After subtraction according to the Hadamard scheme, the ASL signal was corrected for the use of the flip‐angle sweep and background suppression pulses. The BASIL toolkit of the Oxford Centre for FMRIB was used to quantify the ASL signal.
Results
By combining a time‐encoded pCASL labeling scheme with an LL readout and simultaneous multi‐slice acquisition, 28 time points of 16 slices with a 75‐ or 150‐ms time resolution were acquired in a total scan time of 10 minutes 20 seconds, from which cerebral blood flow (CBF) maps, arterial transit time maps, and arterial blood volume could be determined.
Conclusion
Whole‐brain ASL images were acquired with a 75‐ms time resolution for the angiography and 150‐ms resolution for the perfusion phase by combining the proposed techniques. Reducing the total scan time to 1 minute 18 seconds still resulted in reasonable CBF maps, which demonstrates the feasibility of this approach for practical studies on brain hemodynamics.
Keywords: arterial spin labeling, cerebral blood flow, magnetic resonance imaging, perfusion MRI, simultaneously multi‐slice
1. INTRODUCTION
Arterial spin labeling (ASL) is a noninvasive method that utilizes blood as an endogenous tracer to measure tissue perfusion. Arterial blood is magnetically labeled by means of inversion, because it flows through the labeling slab, which is proximally located with respect to the imaging region. This labeled blood is imaged after a certain delay time (also known as postlabel delay [PLD]), when it has arrived in the brain tissue. Subtraction of this labeled image from a control image, which is acquired without labeling, provides a perfusion image without any contribution from stationary tissue. By varying the PLD, multi‐time point data can be acquired to sample the tracer kinetic curve, which allows for minimization of tissue perfusion quantification errors, such as over‐ or underestimating of cerebral blood flow (CBF)1, 2 attributed to transit‐time artefacts, as well as to obtain additional hemodynamic parameters, such as arterial transit time (ATT). Timing parameters, such as ATT, have proven to provide important information in, for example, stroke, transient ischemic attack, and Alzheimer’s disease.3, 4 Such multi‐time point data can be acquired with multiple separate ASL scans; however, the temporal resolution of these scans is practically limited, signal‐to‐noise ratio (SNR) is reduced, and/or additional scan time is necessary.5
The goal of the current study was to achieve high temporal resolution multi‐time point pseudo‐continuous ASL (pCASL) acquisition in a time‐efficient manner, while maintaining whole‐brain coverage. A Hadamard, also known as time‐encoded (te), labeling scheme was combined with a Look‐Locker (LL) readout to achieve a high temporal resolution of 75 ms during passage of the label through the vasculature (i.e., the angiography phase) and 150 ms during the perfusion phase. Because of this very dense sampling of the dynamic ASL signal, coverage of an LL readout would normally be limited to 5 to 7 slices.6 Since the recent introduction of simultaneous multi‐slice (SMS; i.e., multiband) acquisition, new opportunities were provided to maintain whole‐brain coverage in the short LL readouts by exciting multiple slices simultaneously.
2. METHODS
2.1. MRI experiments
Six healthy volunteers (23–58 years old, 2 males/4 females) were scanned using a 32‐channel head coil on a 3T scanner (Ingenia; Philips Healthcare, Best, The Netherlands). All volunteers provided informed consent, and the study was approved by the local institutional review board.
2.2. Time‐encoded pCASL
A Hadamard 8‐matrix was used to dynamically encode the pCASL labeling train providing the first source of temporal information within this sequence. This approach delivers multi‐time point data in a time‐efficient manner and with the same SNR compared to separate ASL scans.2, 5, 7 In accord with a Hadamard (or Hadamard‐like matrix such as Walsh encoding8) matrix, the labeling period is divided into multiple sub‐boli that are either label or control for a given number of subsequent measurements. In postprocessing, the same matrix is applied for decoding, which enables separation of the signal of each individual sub‐bolus.9 The duration of the different sub‐boli can be varied to meet specific requirements. For this study, the total label duration of the te‐pCASL labeling was chosen to be 2325 ms, which was divided into 7 blocks of 2 × 600 ms for the longer delays and 5 × 225 ms with a minimum PLD of 100 ms (Figure 1). For background suppression, 2 frequency offset corrected inversion (FOCI) pulses were applied at 1060 and 2020 ms.
Figure 1.
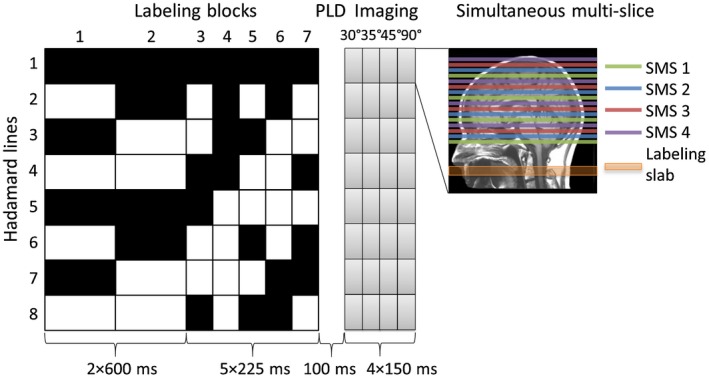
Overview of the proposed sequence based upon a Hadamard 8‐labeling scheme for time‐encoded pCASL in combination with an LL readout. The total label duration of 2325 ms was divided into 7 blocks of 2 × 600 and 5 × 225 ms with a minimum PLD of 100 ms. The black blocks indicate labeling; the white blocks indicate control condition, and the numbers below the blocks represent the duration in milliseconds. Background suppression pulses were played out at 1060 and 2020 ms after start of labeling. By means of the LL readout, 4 phases of 150 ms were acquired with each a different flip‐angle: 30°, 35°, 45°, and 90°. Four slices were excited simultaneously by using an SMS acquisition
2.3. Look‐Locker readout
With an LL readout, multiple low flip‐angle readouts are performed after a single labeling module, which is a time‐efficient manner to obtain multi‐time point data.6, 10 By employing an LL readout, 4 images were acquired for each Hadamard line at an interval of 150 ms, providing the second source of temporal information within this sequence (Figure 1). One of the major advantages of this readout, in combination with the te‐pCASL labeling scheme, is that it provides an interpolation of the temporal encoding by te‐pCASL by acquiring 4 differently timed images for each Hadamard labeling block.6 To maintain a constant signal over the 4 LL readouts, a flip‐angle sweep of 30°, 35°, 45°, and 90° was applied. The temporal SNR (tSNR) was calculated as follows (Equation 1):
| (1) |
The tSNR of these readouts was compared with the tSNR of an LL readout with a constant flip‐angle of 35° for all 4 phases using a Wilcoxon signed‐rank test.
2.4. Timing of Hadamard labeling blocks and Look‐Locker readouts
Monitoring of the arrival and passage of the label through the vasculature should be done at a high temporal resolution to sample the steep upslope of the tracer kinetic curve, which allows for accurate measurement of the ATT. To this end, the duration of the Hadamard labeling blocks and LL readouts were chosen such that the LL readout effective PLDs interleave the time‐encoded data (Figure 2). This provided a temporal resolution of 75 ms for the first 1525 ms when the labeled blood will mainly traverse the larger arteries and arterioles. Whereas a 150 ms time resolution was achieved for the perfusion phase of the dynamic ASL signal, during which a more‐shallow slope of the tracer kinetic curve can be expected.
Figure 2.
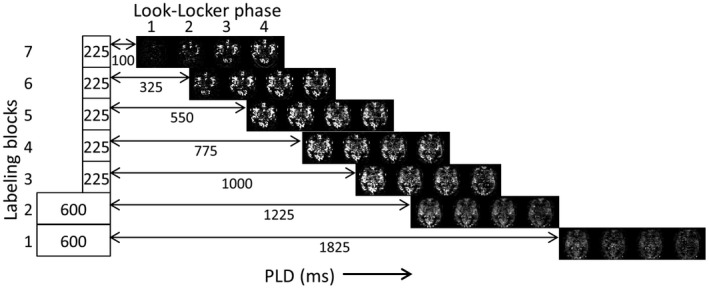
Single‐slice example of the 28 ASL maps that are reconstructed. The duration of the labeling blocks 3 to 7 are only 225 ms, which, in combination with the LL interval of 150 ms, results in an effective interleaving of PLDs, rendering a temporal resolution of 75 ms during the angiography phase
2.5. Simultaneous multi‐slice acquisition
To obtain whole‐brain coverage within the short LL interval of 150 ms, an SMS acquisition was applied; a parallel imaging method that excites multiple slices simultaneously with multi‐banded radiofrequency (RF) pulses, which allows for a narrower readout time window while keeping whole‐brain coverage.6, 11 In this study, 4 slices were excited simultaneously, which led to a total coverage of 16 slices.
For these 16 slices, a total of 24 repeats of the 8 Hadamard encoded images (192 acquisitions) were acquired in 10m20s (TR/TE = 3100/9.52 ms; fat suppression by means of spectral presaturation with inversion recovery [SPIR]; single‐shot echo planar imaging) with a field of view of 220 × 220 mm2 and a voxel size of 3 × 3 × 8 mm3. A sensitivity encoding factor of 1.9 was used in combination with a partial Fourier imaging factor of 0.7. For calibration purposes, an M0 image with the same geometry and a TR of 2000 ms was acquired without utilizing LL or SMS.
2.6. Comparison with low temporal resolution
To investigate whether this higher temporal resolution, as described in the previous section, allows an improved estimation of the CBF, ATT, and the macrovascular contribution to the ASL signal, also a low temporal resolution scan was acquired. The same Hadamard labeling scheme was used as the only source for the temporal information with a total label duration of 2325 ms divided into 5 blocks of 225 ms for the angiography and 2 blocks of 600 ms for the perfusion phase. Except for the flip‐angle (set to 90°), all other parameters were kept constant compared to the high temporal resolution scan that included an LL readout; importantly, the total scan duration was kept constant at 10m20s. A Wilcoxon signed‐rank test was used to test for significant differences.
2.7. Data analysis
After subtraction according to the appropriate Hadamard scheme, the ASL signal was corrected for the use of 2 background suppression pulses in 2 different ways. First, the decrease of the effective label duration of the 2 particular Hadamard labeling blocks during which the FOCI pulses were played out was taken into account. Second, the loss of ASL signal attributed to the imperfect inversion efficiency of these background suppression pulses was corrected for by dividing the ASL signal of all blocks (or part thereof) preceding a single inversion pulse by the inversion efficiency, which was assumed to be 93%, or division by the square of the inversion efficiency when preceding both pulses. Also, the ASL signal was corrected for the effects of the flip‐angle sweep by (1) dividing each scan with the sine of the flip‐angle and (2) to correct for the loss of label attributed to the preceding RF pulses. To quantify the ASL signal, the BASIL toolkit of the Oxford Centre for Functional MRI of the BRAIN (FMRIB)’s software library (FSL) was used.12, 13 Within this framework, the macrovascular contribution to the ASL signal was fitted, ATT maps were derived, and the variance on the perfusion values were estimated.14 BASIL corrects for the labeling efficiency with a value of 0.85 in the calculation of the perfusion. By only including a subset of the acquired repeated measurements, shorter total scan times can be mimicked.
3. RESULTS
Figures 3, 4, and 5 provide examples of the obtained image quality: Figure 3 shows an ASL data set, that is, 14 chronological time points of 8 slices of 1 volunteer (volunteer no. 2). Only the odd time points and slices are shown; see Supporting Information Figure S1 for the complete ASL data set. Figure 4 shows 28 chronological time points for a single slice of the same volunteer. Figure 5 shows for each volunteer 14 chronological time points for a single slice. Only the odd time points are shown in this figure. By combining te‐pCASL with LL readout and a flip‐angle sweep, multiple time points were acquired for each Hadamard labeling block, which resulted in 28 time points for every slice. Images from different Hadamard blocks with the short PLDs were interleaved; hence, a higher temporal resolution of 75 ms was achieved, allowing high temporal resolution monitoring of the inflow of labeled spins. Three pairs of ASL images, indicated with the white lines in Figure 4, had the same bolus duration (225 ms) and PLD (550, 750, and 1000 ms), but originated from different LL phases and labeling blocks. In addition, the first acquisition of the second labeling block had the same PLD (1225 ms) as the fourth acquisition of the fourth labeling block, indicated with the white dotted line in Figure 4, although the label duration for these images differed. For the longer PLDs, a temporal resolution of 150 ms was obtained.
Figure 3.
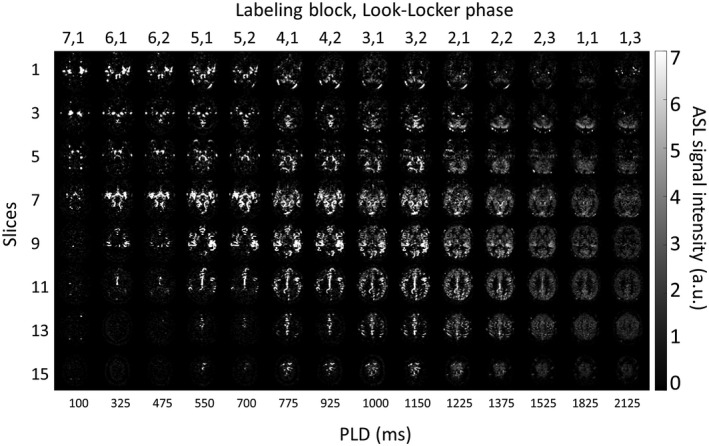
ASL data set (i.e., 14 chronological time points of 8 slices). Only the odd time points and slices are shown of the total 28 time points and 16 slices. For the interleaved acquisitions, a temporal resolution of 75 ms was acquired, and for the noninterleaved acquisitions, a temporal resolution of 150 ms was obtained. The readouts with the shorter PLDs show the inflow of the blood into the arteries, whereas the longer PLDs show the label moving into the tissue. a.u. = arbitrary units
Figure 4.
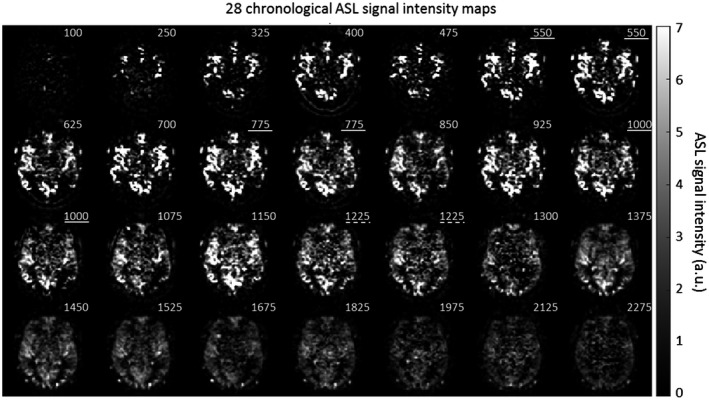
Subtracted ASL signal intensity maps of 28 chronological time points for slice 8 of volunteer no. 2. The numbers in the upper right corner indicate the PLD (ms) for each image. Images with the same PLD are indicated with a white line. The white dotted line indicates images with the same PLD, but from which the effective labeling duration differed. a.u. = arbitrary units
Figure 5.
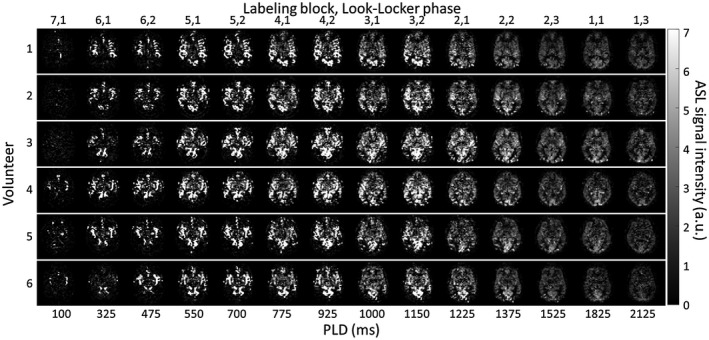
Subtracted ASL signal intensity maps of 14 chronological time points for 1 slice in all 6 volunteers. Only the odd time points are shown from the total 28 time points. a.u. = arbitrary units
Because a very high temporal resolution of 75 ms was achieved during angiography and a high temporal resolution of 150 ms during the perfusion phase, a more complex model, such as supported by the BASIL toolkit in FSL, can be used to quantify the ASL signal. This model includes both a tissue compartment as well as a macrovascular compartment (i.e., arterial signal). The resulting CBF maps for the same volunteer as shown in Figure 3 are presented in the upper row of Figure 6A. The ATT map, in the third row, demonstrates higher ATT values for the border zones and white matter compared to the ATT values for the gray matter (GM). The macrovascular contribution to the ASL images is shown in the fourth row.15 The second row in Figure 6A shows the CBF maps obtained when the arterial compartment is not included in the Bayesian analysis, resulting in an apparent overestimation of the CBF.
Figure 6.
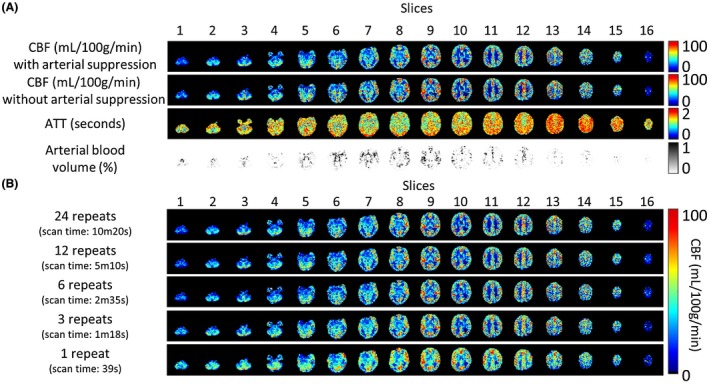
A, CBF, ATT, and arterial blood volume maps for a single subject. The BASIL toolkit was used to quantify the acquired data, with the first row showing the CBF map including the macrovascular contribution in the Bayesian analysis and the second row the CBF map without inclusion of the arterial compartment in the model. When the macrovascular contribution is not taken into account, CBF is overestimated because of intravascular label. The ATT and arterial blood volume maps are shown in, respectively, the third and fourth row. B, Comparison of CBF maps for different number of repeats included in the postprocessing; only fully sampled Hadamard matrices were included. The CBF maps of 3 repeats are visually comparable to the CBF maps obtained from 24 repeats, whereas the acquisition time is limited to 1m18s
Figure 6B shows the CBF quantification for volunteer no. 2 when only part of the data (i.e., less repeats of the complete Hadamard matrix) are taken into account. The mean GM CBF value for the full data set of 24 repeats was 37.23 mL/100 g/min with a mean per‐voxel standard deviation of 7.02, which was calculated as the mean overall GM voxels of the square root of the variance of the perfusion estimate as obtained from the Bayesian analysis. This standard deviation will therefore both reflect physiological and measurement noise as well as deviations from the applied tracer kinetic model. Visual inspection of the CBF maps obtained from a total of 3 repeats (1m18s) shows an almost similar quality to the full data set. For this acquisition, the mean GM CBF value was 38.61 mL/100 g/min with a mean per‐voxel standard deviation of 12.54. Degradation of image quality becomes evident when only a single Hadamard scheme (1 repeat) is included in the analysis. Decrease in image quality is most clear in the depiction of the basal ganglia, which become very hard to distinguish from each other. The mean GM CBF value for this acquisition was 39.81 mL/100 g/min with a standard deviation of 16.64.
Figure 7 shows the CBF, ATT, and arterial cerebral blood volume (aCBV) maps for the low temporal resolution scan for volunteer no. 2. Table 1 shows the mean GM CBF and mean aCBV values for all volunteers for the high and low temporal resolution scans. The CBF estimation is increased for all volunteers, whereas the aCBV is significantly decreased when comparing the low with the high temporal resolution scan. Moreover, the standard deviation of the CBF estimation was significantly increased when fewer time points were used to sample the kinetic curve. Finally, the ATT was also decreased for the low temporal resolution scan.
Figure 7.

CBF, ATT, and arterial blood volume (aCBV) maps for a single subject for the low temporal resolution scan. CBF values were increased whereas aCBV values were significantly deceased compared to the high temporal resolution scan
Table 1.
CBF values and arterial blood volumes (aCBV) for the high and low temporal resolution scan
| High temporal resolution | Low temporal resolution | |||
|---|---|---|---|---|
| Mean GM CBF (mL/100g/min) | Mean aCBV signal (%) | Mean GM CBF (mL/100g/min) | Mean aCBV signal (%) | |
| Volunteer 1 | 40.62 ± 6.12 | 0.65 | 44.71 ± 13.71 | 0.32 |
| Volunteer 2 | 37.23 ± 7.02 | 0.70 | 38.82 ± 12.97 | 0.32 |
| Volunteer 3 | 47.91 ± 8.95 | 0.59 | 49.81 ± 16.30 | 0.24 |
| Volunteer 4 | 37.69 ± 6.08 | 0.70 | 42.29 ± 12.17 | 0.33 |
| Volunteer 5 | 38.99 ± 7.38 | 0.88 | 38.69 ± 14.20 | 0.35 |
| Volunteer 6 | 33.83 ± 6.57 | 0.71 | 33.20 ± 12.60 | 0.35 |
| Mean | 39.38 ± 7.02 | 0.71* | 41.25 ± 13.66 | 0.32* |
Statistically significant, high (left) or low temporal resolution scan (right), Wilcoxon signed‐rank test, p<0.05.
The flip‐angle sweep that was used for the LL readouts led to more constant signal in the different LL phases (see Figure 8), when compared to a constant flip‐angle of 35°. As expected, the first LL readout showed a higher tSNR for the acquisition with a constant flip‐angle of 35°. However, the tSNR for the next 3 LL readouts is decreased, whereas the tSNR for the flip‐angle sweep remained more constant. The tSNR for the second LL readout is very similar for both acquisitions, because the same flip‐angle was used. Especially, the third and fourth LL readouts showed an improved tSNR for the acquisitions with the flip‐angle sweep. Significant difference (P < 0.05) is indicated with an asterisk. The sudden increase of tSNR between the fifth and sixth time point in the four graphs is attributed to the difference in the block durations from which these data points were achieved (600 versus 225 ms).
Figure 8.
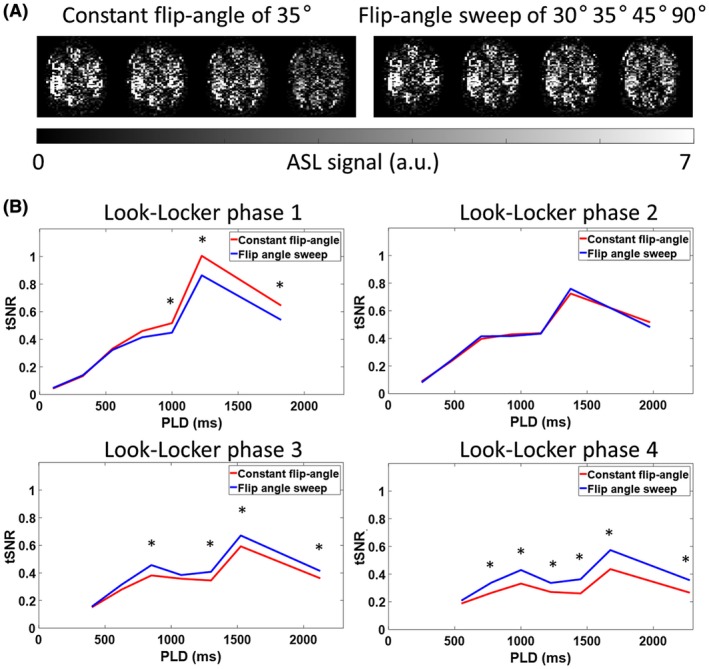
Signal intensity and tSNR comparison for the acquisitions with a constant flip‐angle and the data acquired with a flip‐angle sweep. A, The 4 LL readouts of the fourth Hadamard labeling block. The ASL signal decreased over the multiple LL readouts when a constant flip‐angle of 35° was used, which would lead to modulations in the SNR of the ASL signal over the 28 time points. A constant signal over the 4 LL readouts was obtained by using a flip‐angle sweep of 30°, 35°, 45°, and 90°. B, Mean GM and arterial tSNR of all volunteers for both acquisitions over time, that is, either with constant flip‐angle or by using a flip‐angle sweep, demonstrating a higher tSNR for the third and fourth LL phase when a flip‐angle sweep is utilized as compared to the tSNR for the acquisitions with a constant flip‐angle. The constant flip‐angle readout train resulted in higher tSNR for the first phase for the longer PLDs. Significant difference (P < 0.05) is indicated with an asterisk. a.u. = arbitrary units
4. DISCUSSION
The main innovation of the proposed sequence is the acquisition of very high temporal resolution multi‐PLD ASL while keeping whole‐brain coverage. This high temporal resolution allows precise fitting of the ASL data and thereby better characterization of, for example, the arrival time and the CBF. Having this amount of rich ASL data opens up new avenues for advanced modeling of the ASL data, and the presented analysis should only be regarded as a first illustration of the opportunities and not as the most optimal model. By limiting the number of repeats to a total scan time of little more than 1 minute, the reasonable image quality of the resulting CBF maps prove that the high temporal resolution did not lead to severe degradation of image quality, which would limit practical applications. Evaluation of this sequence in a clinical study is of great importance in the near future. Following the concept as proposed by Dai et al,16 such a fast sequence can serve as a quick survey of the hemodynamic status of a patient and as input for optimal settings of the labeling duration and PLD for a high spatial resolution single PLD pCASL scan.
The timing of the Hadamard labeling scheme and the LL readout resulted in interleaved acquisitions wherein some images were acquired with the same PLD, but in a different LL phase. Theoretically, these images should be identical, but some signal differences could be observed. Most probably, this can be attributed to either (physiological) noise or B1 inhomogeneities that will locally result in a suboptimal correction for previous LL excitation pulses. Use of a B1 map in the ASL postprocessing should be considered to correct for the latter.
The total scan time to acquire 28 time points and 16 slices was 10m20s. Up to this point, only healthy volunteers were scanned, and, before starting the postprocessing, it was checked whether a substantially amount of motion was present in the data sets. No disruptive motion artefacts were observed; therefore, we did not apply motion correction. However, when this protocol would be used in a clinical setting, motion will most likely be more prominent, making motion correction necessary. Given that an SMS acquisition was used together with background suppression, a more‐advanced motion correction method, such as described by Suzuki et al,17 would be needed to overcome severe background suppression subtraction errors after motion correction. Moreover, shorter scan times than the 10 minutes of this study would be possible as evident from, for example, Figure 6B.
Besides the potential motion artefacts over the entire 10m20s during scan, other variabilities, such as the cardiac and respiratory cycle, may also affect data stability, leading to quantification errors and decreased t‐SNR. This effect would mainly affect the angiography phase of the data, given that, for the perfusion blocks, signal is averaged over a significant part of the cardiac cycle, PLDs are longer than the heart‐rate interval, and the extravascular compartments are acting as a sink as opposed to the flow‐through character of arteries. Of course, blood velocities are changing over the cardiac cycle, and given that the velocity is directly related to the amount of label that is produced and also affects labeling efficiency in pCASL, cardiac triggering has been suggested.5 However, use of cardiac triggering would have had little effect on the signal stability of the angiography phases, given that the labeling of these blocks happens 1 to 2 heartbeats after the start of the time‐encoded labeling. Any heart‐rate variability would still lead to different heart phases for the angiography blocks, even when the start of labeling would have been triggered. Finally, in our experimental in vivo data, we observed little evidence of artefacts attributed to pulsatility. Moreover, other studies from the literature showed only minor differences between triggered and nontriggered data for the mean ASL signal or temporal ASL signal stability.18
To demonstrate the advantage of this high temporal resolution, the CBF, ATT, and aCBV maps were compared with a low temporal resolution scan. For the low temporal resolution scan, only 7 time points were acquired for sampling of the tracer kinetic curve. This resulted in a significant decrease of the obtained aCBV values, probably because the steep upslope of the tracer kinetic curve was sampled less densely. As a consequence, GM CBF values were found to be increased for the lower temporal resolution scan, given that less macrovascular signal was excluded from the tissue perfusion estimation. Furthermore, variance on the perfusion estimations was significantly increased for the low temporal resolution scan.
The estimated mean GM CBF values are lower compared to the reported normal values by, for example, the white paper: 40 to 100 mL/min/100 mL.19 Because the combination of the Hadamard labeling scheme and LL readout provided 28 time points, a two‐component model could be used that separates the ASL signal into a perfusion and macrovascular component. This way, the high signal from the macrovascular component is no longer contaminating the perfusion estimation, thereby resulting in lower CBF values. The kinetic model fits significantly more macrovascular signal for the high temporal resolution data compared to the low temporal resolution (Table 1). This resulted in even lower CBF values for the high temporal resolution data compared to the CBF values for the low temporal resolution data.
To obtain a high temporal resolution, different methods were considered before the presented protocol was selected. Lee et al proposed to use a fair labeling sequence in combination with an LL‐SMS readout to acquire 20 slices with a temporal resolution of 259 ms.20 By using a pulsed ASL technique, they were able to observe the blood inflow into the arteries right after the short labeling duration. For a pCASL sequence, this is more difficult given that this technique requires a longer labeling duration. In this study, a time‐encoded pCASL labeling scheme was combined with an LL readout and SMS acquisition. When omitting time encoding from this sequence, 16 LL phases could be acquired at an interval of 158 ms with a constant flip‐angle of 10° (Figure 9A). The label duration was limited to 600 ms to allow the visualization of the inflow of the label in the larger arteries. Figure 9B shows the results for the 16 different time points for a single slice. The limitation of this method is the fact that after (approximately) the ninth LL readout, little ASL signal is left, resulting in poor ASL images for the later LL readouts. Consequently, only the first 9 time points could be used to determine the CBF, thereby severely limiting its usability. Therefore, the addition of the Hadamard labeling scheme in our method is essential to obtain ASL information over the complete 28 time points, both for covering the angiography phase as well as to provide good‐quality perfusion images. Moreover, this approach allowed an increase in temporal resolution to 75 ms for the shorter PLDs.
Figure 9.
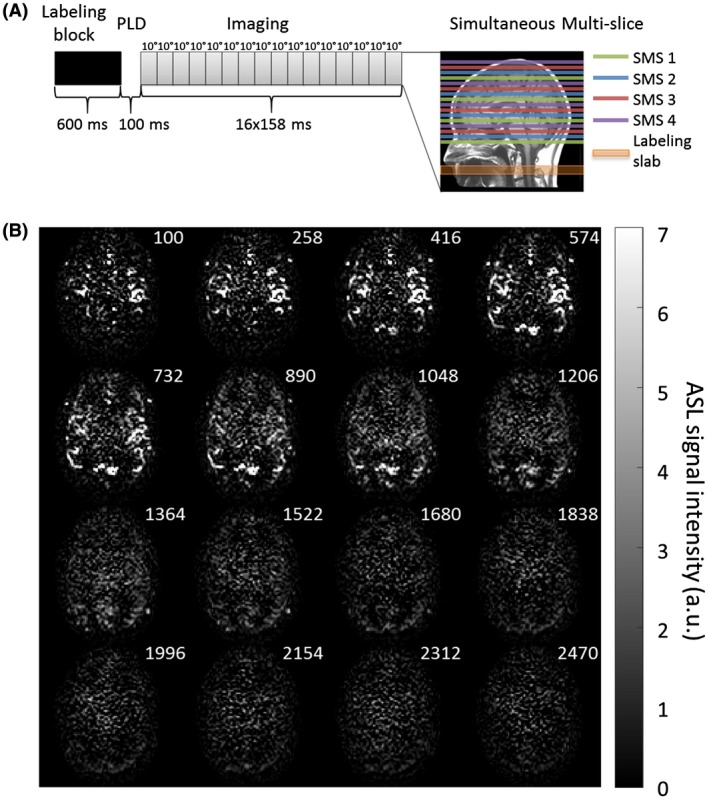
A, Overview of the non‐time‐encoded pCASL labeling scheme with a label duration of 600 ms and a minimum PLD of 100 ms. For the LL readout 16 phases of 158 ms were acquired with a constant flip‐angle of 10°. Four slices were excited simultaneously by using a simultaneous multi‐slice acquisition to acquire 16 slices. B, Single‐slice example of the ASL data set when using this conventional pCASL labeling resulting in 16 chronological time points. The numbers in the upper right corner indicate the PLDs in milliseconds. After the ninth LL phase, little ASL signal was left for the remaining 7 LL acquisitions to provide sufficient image quality. a.u. = arbitrary units
To achieve an even higher temporal resolution, it was studied in a single volunteer whether omission of the fat‐suppression pulses would be feasible. Although without the SPIR pulses the temporal resolution of the perfusion phase could be reduced to 130 ms, fat signal disrupted the SMS reconstruction leading to artefacts, which were deemed too disruptive. Improved reconstruction algorithms might be able to alleviate these issues, thereby enabling such a higher temporal resolution.
5. CONCLUSION
By combining te‐pCASL labeling with an LL readout and an SMS acquisition, high temporal resolution, multi‐PLD data can be acquired with whole‐brain coverage in a time‐efficient manner. In a total scan time of 10m20s (24 repeats of the 8 Hadamard encoded images), 16 slices were acquired spanning 28 time points from which CBF, ATT, as well as arterial blood volume maps could be determined. Moreover, reducing the amount of repeats to 3 (1m18s) still resulted in reasonable image quality, demonstrating the feasibility of this approach for studying brain hemodynamics at a high temporal resolution in a clinical setting.
Supporting information
FIGURE S1 Complete ASL data set (i.e., 28 chronological time points of 16 slices). For the interleaved acquisitions, a temporal resolution of 75 ms was acquired, and for the noninterleaved acquisitions, a temporal resolution of 150 ms was obtained. The readouts with the shorter PLDs show the inflow of the blood into the arteries, whereas the longer PLDs show the label moving into the tissue. Images with the same PLD are indicated with a red line. The red dotted line indicates images with the same PLD, but from which the effective labeling duration differed. a.u. = arbitrary units
ACKNOWLEDGMENTS
This work is part of the research program Innovational Research Incentives Scheme Vici with project number 016.160.351, which is financed by the Netherlands Organisation for Scientific Research (NWO).
van der Plas MCE, Teeuwisse WM, Schmid S, Chappell M, van Osch MJP. High temporal resolution arterial spin labeling MRI with whole‐brain coverage by combining time‐encoding with Look‐Locker and simultaneous multi‐slice imaging. Magn Reson Med. 2019;81:3734–3744. 10.1002/mrm.27692
Funding information Stichting voor de Technische Wetenschappen, Grant/Award Number: 016.160.351; Netherlands Organisation for Scientific Research.
REFERENCES
- 1. Wu W‐C, St Lawrence KS, Licht DJ, Wang DJJ. Quantification issues in arterial spin labeling perfusion magnetic resonance imaging. Top Magn Reson Imaging. 2010;21:65–73. [DOI] [PubMed] [Google Scholar]
- 2. Dai W, Shankaranarayanan A, Alsop DC. Volumetric measurement of perfusion and arterial transit delay using hadamard encoded continuous arterial spin labeling. Magn Reson Med. 2013;69:1014–1022. [DOI] [PMC free article] [PubMed] [Google Scholar]
- 3. MacIntosh BJ, Lindsay AC, Kylintireas I, et al. Multiple inflow pulsed arterial spin‐labeling reveals delays in the arterial arrival time in minor stroke and transient ischemic attack. Am J Neuroradiol. 2010;31:1892–1894. [DOI] [PMC free article] [PubMed] [Google Scholar]
- 4. Yoshiura T, Hiwatashi A, Yamashita K, et al. Simultaneous measurement of arterial transit time, arterial blood volume, and cerebral blood flow using arterial spin‐labeling in patients with Alzheimer disease. Am J Neuroradiol. 2009;30:1388–1393. [DOI] [PMC free article] [PubMed] [Google Scholar]
- 5. Teeuwisse WM, Schmid S, Ghariq E, Veer IM, Van Osch MJP. Time‐encoded pseudocontinuous arterial spin labeling: basic properties and timing strategies for human applications. Magn Reson Med. 2014;72:1712–1722. [DOI] [PubMed] [Google Scholar]
- 6. Zhang K, Yun SD, Shah NJ. Tripled readout slices in multi time‐point pCASL using multiband look‐locker EPI. PLoS ONE. 2015;10:e0141108. [DOI] [PMC free article] [PubMed] [Google Scholar]
- 7. Wells JA, Lythgoe MF, Gadian DG, Ordidge RJ, Thomas DL. In vivo Hadamard encoded continuous arterial spin labeling (H‐CASL). Magn Reson Med. 2010;63:1111–1118. [DOI] [PubMed] [Google Scholar]
- 8. von Samson‐Himmelstjerna F, Madai VI, Sobesky J, Guenther M. Walsh‐ordered hadamard time‐encoded pseudocontinuous ASL (WH pCASL). Magn Reson Med. 2016;76:1814–1824. [DOI] [PubMed] [Google Scholar]
- 9. Günther M. Highly efficient accelerated acquisition of perfusion inflow series by cycled arterial spin labeling In Proceedings of the 15th Annual Meeting of the ISMRM, Berlin, Germany, 2007. Abstract 380. [Google Scholar]
- 10. Gunther M, Bock M, Schad LR. Arterial spin labeling in combination with a look‐locker sampling strategy: Inflow turbo‐sampling EPI‐FAIR (ITS‐FAIR). Magn Reson Med. 2001;46:974–984. [DOI] [PubMed] [Google Scholar]
- 11. Feinberg DA, Beckett A, Chen L. Arterial spin labeling with simultaneous multi‐slice echo planar imaging. Magn Reson Med. 2013;70:1500–1506. [DOI] [PMC free article] [PubMed] [Google Scholar]
- 12. Chappell MA, Groves AR, Whitcher BWM. Variational Bayesian inference for a non‐linear forward model. IEEE Trans Med Imaging. 2009;57:223–236. [Google Scholar]
- 13. Groves AR, Chappell MA, Woolrich MW. Combined spatial and non‐spatial prior for inference on MRI time‐series. NeuroImage. 2009;45:795–809. [DOI] [PubMed] [Google Scholar]
- 14. Chappell MA, MacIntosh BJ, Donahue MJ, Günther M, Jezzard P, Woolrich MW. Separation of macrovascular signal in multi‐inversion time arterial spin labelling MRI. Magn Reson Med. 2010;63:1357–1365. [DOI] [PubMed] [Google Scholar]
- 15. Chappell MA, Macintosh BJ, Okell TW. Perfusion Quantification Using Arterial Spin Labelling, 1st ed Oxford, UK: Oxford University Press; 2018. [Google Scholar]
- 16. Dai W, Robson PM, Shankaranarayanan A, Alsop DC. Reduced resolution transit delay prescan for quantitative continuous arterial spin labeling perfusion imaging. Magn Reson Med. 2012;67:1252–1265. [DOI] [PMC free article] [PubMed] [Google Scholar]
- 17. Suzuki Y, Okell TW, Chappell MA, van Osch MJP. A framework for motion correction of background suppressed arterial spin labeling perfusion images acquired with simultaneous multi‐slice EPI. Magn Reson Med. 2019;81:1553–1565. [DOI] [PMC free article] [PubMed] [Google Scholar]
- 18. Verbree J, van Osch MJP. Influence of the cardiac cycle on pCASL: cardiac triggering of the end‐of‐labeling. MAGMA. 2018;31:223–233. [DOI] [PMC free article] [PubMed] [Google Scholar]
- 19. Alsop DC, Detre JA, Golay X, et al. Recommended implementation of arterial spin labeled perfusion MRI for clinical applications: a consensus of the ISMRM Perfusion Study Group and the European Consortium for ASL in Dementia. Magn Reson Med. 2015;73:102–116. [DOI] [PMC free article] [PubMed] [Google Scholar]
- 20. Lee Y, Kim T. Assessment of hypertensive cerebrovascular alterations with multiband Look‐Locker arterial spin labeling. J Magn Reson Imaging. 2018;47:663–672. [DOI] [PubMed] [Google Scholar]
Associated Data
This section collects any data citations, data availability statements, or supplementary materials included in this article.
Supplementary Materials
FIGURE S1 Complete ASL data set (i.e., 28 chronological time points of 16 slices). For the interleaved acquisitions, a temporal resolution of 75 ms was acquired, and for the noninterleaved acquisitions, a temporal resolution of 150 ms was obtained. The readouts with the shorter PLDs show the inflow of the blood into the arteries, whereas the longer PLDs show the label moving into the tissue. Images with the same PLD are indicated with a red line. The red dotted line indicates images with the same PLD, but from which the effective labeling duration differed. a.u. = arbitrary units


