Abstract
A growing number of studies provide epidemiological evidence linking obstructive sleep apnea (OSA) with a number of chronic disorders. Transcriptional analyses have been conducted to analyze the gene expression data. However, the weighted gene coexpression network analysis (WGCNA) method has not been applied to determine the transcriptional consequence of continuous positive airway pressure (CPAP) therapy in patients with severe OSA. The aim of this study was to identify key pathways and genes in patients with OSA that are influenced by CPAP treatment and uncover/unveil potential molecular mechanisms using WGCNA. We analyzed the microarray data of OSA (GSE 49800) listed in the Gene Expression Omnibus database. Coexpression modules were constructed using WGCNA. In addition, Gene Ontology and Kyoto Encyclopedia of Genes and Genomes enrichment analysis were also conducted. After the initial data processing, 5101 expressed gene profiles were identified. Next, a weighted gene coexpression network was established and 16 modules of coexpressed genes were identified. The interaction analysis demonstrated a relative independence of gene expression in these modules. The black module, tan module, midnightblue module, pink module, and greenyellow module were significantly associated with the alterations in circulating leukocyte gene expression at baseline and after exposure to CPAP. The five hub genes were considered to be candidate OSA‐related genes after CPAP treatment. Functional enrichment analysis revealed that steroid biosynthesis, amino sugar and nucleotide sugar metabolism, protein processing in the endoplasmic reticulum, and the insulin signaling pathway play critical roles in the development of OSA in circulating leukocyte gene expression at baseline and after exposure to CPAP. Using this new systems biology approach, we identified several genes and pathways that appear to be critical to OSA after CPAP treatment, and these findings provide a better understanding of OSA pathogenesis.
Keywords: continuous positive airway pressure (CPAP), obstructive sleep apnea (OSA), weighted gene coexpression network analysis (WGCNA)
1. INTRODUCTION
Obstructive sleep apnea (OSA) is a common disease in adults, and it is the most common form of sleep apnea caused by the obstruction of the upper airway.1 Patients with OSA are characterized by recurrent episodes of pharyngeal obstruction during sleep. The prevalence of OSA in the general population is approximately 3% to 7% for adult men and 2% to 5% for adult women.2, 3 OSA has been recognized as an independent risk factor for cardiovascular events,4 metabolic dysregulation,5 cancer incidence,6, 7 and all‐cause mortality.8 Presently, continuous positive airway pressure (CPAP) has been recognized to be an effective treatment, because it improves sleep‐disordered breathing as well as sleep quality.9, 10 Application of CPAP to patients with OSA leads to a reduction in blood pressure,11, 12 improvement of left ventricular function,13 endothelial cell dysfunction,14 and dyslipidemia.15 However, the molecular and pathological mechanisms of CPAP therapy in patients with OSA remain unknown.
Weighted correlation network analysis (WGCNA), a comprehensive collection of R functions, is a commonly used method in the correlation network analysis, and in the identification of disease‐related gene modules and key genes that contribute to the phenotypic traits.16, 17 In system biology, the WGCNA approach has provided functional interpretation tools, and it is widely used in many diseases, such as cancer as well as diabetes.18, 19, 20 Unlike the conventional microarray‐based expression profiling method, WGCA allows a global interpretation of gene expression data by constructing gene networks based on similarities in expression profiles among samples. However, the analysis of microarray‐based gene expression data by the WGCNA has so far not been applied to the OSA‐related data. To better understand and explore the intricate/complex mechanisms of OSA, the WGCNA method would be a good choice for studying the disease. In the present study, the WGCNA method was applied to the OSA‐related gene expression dataset to identify the biologically relevant modules associated with OSA after CPAP treatment.
2. MATERIALS AND METHODS
2.1. Gene expression data and preprocession
Gene expression profiles of OSA were accessed from the Gene Expression Omnibus (GEO) database using the accession number GSE 49800.21 Raw CEL files of 36 microarray‐based gene expression datasets were downloaded. Gene expression profiles were calculated using the R software statistical environment and Bioconductor. Raw data from each microarray datasets were preprocessed identically with the R package affy using robust multi‐array average (RMA) function for background correction and normalization using the quantiles method.22 The probe data were summarized in gene‐level information, and the mean value was used to represent the expression level if one gene was detected by multiple probes. Annotated files of microarray platform (GPL 6244) were also downloaded from GEO. The top 25% variance gene expression data was selected as the study object in this work, and a matrix of pairwise correlations among all pairs of genes in all selected samples was constructed.
2.2. Construction of gene coexpression network analysis
The R package WGCNA was used to identify the highly connected modules and genes. The process is summarized as follows. First, cluster analysis was performed on the samples, using the function hclust to eliminate the outliers. The appropriate soft threshold power and the standard scale‐free network were then established by condition of scale independent as greater than 0.8. The matrix was then transformed into a Topological Overlap Matrix (TOM) using the WGCNA function TOM similarity. The weighted adjacency matrix was constructed using the WGCNA function adjacency function by imputing the Pearson correlation between each gene pair to determine the concordances of the gene expression. Module eigengenes (ME) were the first principal components in the principal component analysis for each module and summarized the expression patterns of all genes into a single characteristic expression profile within a specific module. Lastly, module identification was carried out with the dynamic tree cut method by hierarchically clustering the genes using 1‐TOM as the distance measured with a deep split value of 2 and minimum module size (minClusterSize) of 50 for the resulting dendrogram. Highly similar modules were clustered and merged with a height cut‐off of 0.25. The calculation of network adjacencies and topological overlap dissimilarities, scaling of topological overlap matrices, and calculation of consensus topological overlap was performed.
2.3. Interaction analysis of coexpression modules
Interaction relationships among the different coexpression modules were imputed by WGCNA. Heatmap tool package in the R software was used in the evaluation of the strength of the relationship. The clustering coefficient was correlated with connectivity by a module in the unweighted network, and the heatmap gene expression profiles in the individual module were also shown.
2.4. Functional enrichment analysis of genes in the coexpression modules
The number of genes in the constructed modules was put in an ascending order. Functional enrichment analysis was then conducted on the genes in these modules. The Gene Ontology (GO) Biological Process term and Kyoto Encyclopedia of Genes and Genomes (KEGG) pathway analyses were conducted using the DAVID (database for annotation, visualization, and integrated discovery, https://david.ncifcrf.gov/).23, 24 Functional enrichment analysis was based on the cut‐off value of P less than 0.05.
2.5. Identification of modules and hub genes in coexpression networks
To evaluate the interaction of module genes and to identify hub genes in tan, black, cyan, red, and greenyellow module, the connectivity in the above modules to weighted coexpression network was established. The dynamic decision‐making tree, node‐splitting method, and cluster analysis of the square Euclidean distance were used to identify MEs related to these clinical features. Spearman's correlation analysis was carried out to determine the most relevant object module between the MEs and clinical traits. The hub modulates the related clinical characteristics to have the highest Spearman's correlation coefficient. A subnetwork with module genes was extracted from coexpression network using Cytoscape plug‐in MCODE.25, 26 The hub genes that had been chosen in the intervention features were obtained in a subnetwork in the critical module.
3. RESULTS
3.1. Microarray data collection and gene expression analysis
To identify eligible studies, the keywords “obstructive sleep apnea” and “OSA” were used to retrieve data from the Pubmed GEO database. From the initial search, we considered an independent GEO database (GSE 49800), containing gene expression derived from 36 microarray gene expression profiles of 18 patients with OSA at baseline and after exposure to CPAP. The sequencing platform was (HuGene‐1_0‐st) Affymetrix Human Gene 1.0 ST Array (transcript [gene] version). The raw CEL files were transformed into microarray gene expression profiles. The mean value was used to represent the expression level if one gene was detected by multiple probes. As a result, a total of 20 391 genes expression data were obtained. To select the most varying genes, the top 25% variance expression profiles were chosen for the WGCNA analysis.
3.2. Coexpression network construction
A total of 5101 genes from 36 samples containing 18 patients with OSA at baseline and after exposure to CPAP was used. The gene hierarchical clustering plot in each sample was divided into two clusters, on the whole, using the flashClust tool package of WGCNA algorithm method (Figure 1). The connections between the genes in the gene network were in accordance with a scale‐free network distribution with a higher mean connectivity when the soft threshold power β was set at nine (Figure 2). After highly similar modules were merged, a total of 16 coexpression modules were identified (Figure 3). Fifty‐three genes in the gray module did not belong to other modules, accounting for 0.10% in all total genes. The number of genes included in these modules was 181 (black module), 721 (blue module), 559 (brown module),83 (cyan module), 408 (green module), 114 (greenyellow module), 55 (midnightblue module), 170 (pink module), 154 (magenta module), 149 (purple module), 334 (red module), 108 (tan module), 1443 (turquoise module), and 484 (yellow module). The average number of genes in these 16 modules was 319 and the median was 162.
Figure 1.
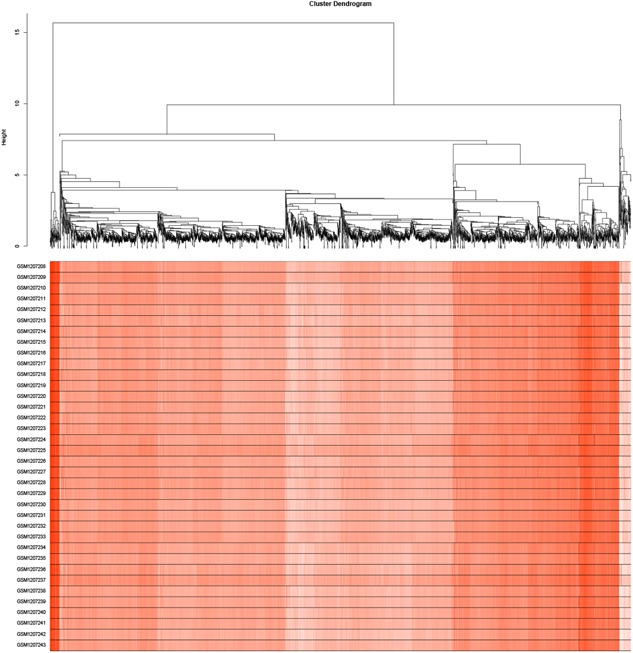
Gene hierarchical clustering plot in each sample with OSA. OSA, obstructive sleep apnea
Figure 2.
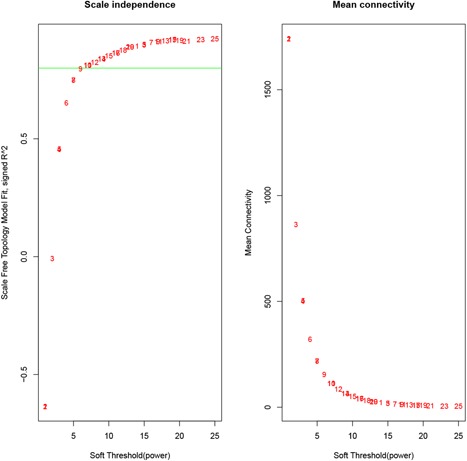
To choose a cut‐off value of soft threshold power using the Scale‐Free Topology Criterion
Figure 3.
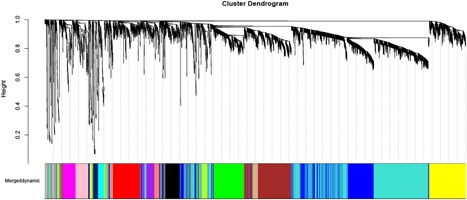
Sixteen significant coexpression gene modules shared in the nine random sampling set were observed with WGCNA. WGCNA, weighted gene coexpression network analysis
3.3. Interaction analysis of coexpression module
The interactions among 16 coexpression modules were further analyzed, and the dynamic tree cut method identified modules with similar expression profiles (Figure 4). No significant difference among the different modules was observed, suggesting a relative independence of gene expression in these modules. Further, a higher scale independence among these modules was also detected.
Figure 4.
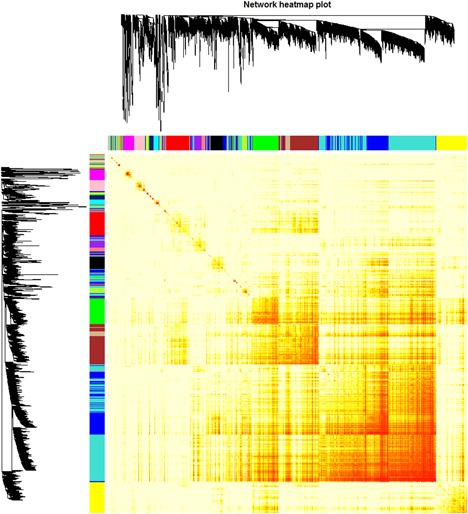
Heatmap view of topological overlap of coexpressed genes in different modules in top 1500 genes
Connectivity of eigengenes analysis was performed to evaluate the interactions among the constructed coexpression modules (Figure 5). A cluster analysis was first conducted on these eigengenes. These modules were then divided into two clusters, including seven modules (green module, yellow module, cyan module, greenyellow module, red module, brown module, and tan module) and eight modules (midnightblue module, pink module, black module, blue module, turquoise module, magenta module, purple module, and salmon module). An obvious difference in connectivity effect among the different modules was observed. Several pairs of modules were found to have a higher interaction connectivity, such as pink module, midnightblue module, red module, tan module, greenyellow module, and black module. The relationship between gene significance (GS) and the individual module was also analyzed (Figure 5). It was found that the black module, tan module, midninghtblue module, pink module, and greenyellow module had a high mean value of gene significance (Figure 6). The samples (arrays) along the module eigengenes (Figure 7) are represented using a scatter plot. The results indicated that the module eigengenes (first PC) of different modules could be highly correlated.
Figure 5.
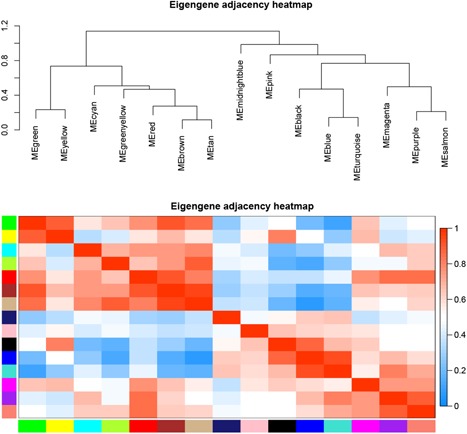
Analysis of connectivity of eigengenes in different modules
Figure 6.
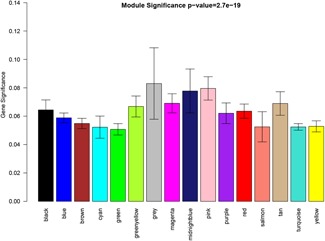
Module significance in different modules
Figure 7.
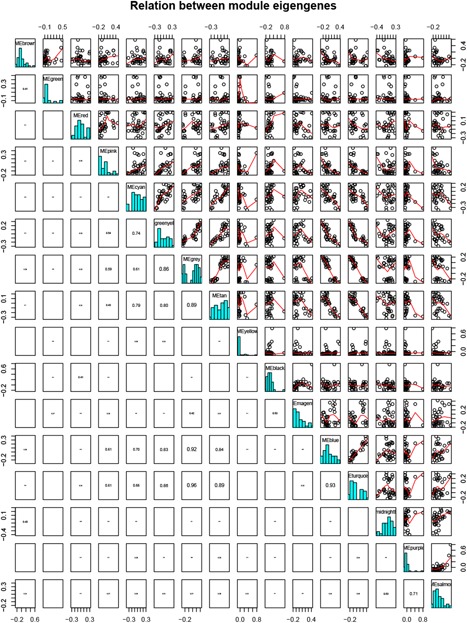
The relation between module eigengenes
3.4. Functional enrichment analysis of included genes among the general modules
GO and KEGG functional enrichment analysis of included genes among individual modules was constructed. A significant difference was realized in the results of functional enrichment analysis among different modules. The GO terms of an individual module are exhibited in Table 1. Among these modules, genes in the black module were mainly enriched in GO:0006641—triglyceride metabolic process, GO:0034447—very low‐density lipoprotein particle clearance, GO:0005977—glycogen metabolic process, GO:0004616—phosphogluconate dehydrogenase (decarboxylating) activity, and GO:0042593—glucose homeostasis. Genes in the cyan module were largely enriched in the biological process, such as GO:0005149—interleukin‐1 receptor binding, GO:0042127—regulation of cell proliferation, GO:0005109—frizzled binding, GO:1990405—protein antigen binding, and GO:0030246—carbohydrate binding. Genes in the greenyellow module were mainly enriched in GO:0019740—nitrogen utilization, GO:0008519—ammonium transmembrane transporter activity, GO:0072488—ammonium transmembrane transport, GO:0016485—protein processing, and GO:0015695—organic cation transport. Genes in the red module were largely enriched in GO:0019787—ubiquitin‐like protein transferase activity, GO:0030141—secretory granule, GO:0016567—protein ubiquitination, GO:0000281—mitotic cytokinesis, and GO:0004842—ubiquitin‐protein transferase activity. Genes in the tan module were mainly enriched in GO:0033344—cholesterol efflux, GO:0000062—fatty‐acyl‐CoA binding, GO:0034736—cholesterol O‐acyltransferase activity, GO:0016567—protein ubiquitination, and GO:0034435—cholesterol esterification.
Table 1.
The top five Gene Ontology of genes in each module
| Module | GO term | Gene count | Percentage | P value |
|---|---|---|---|---|
| Black module | GO:0006641—triglyceride metabolic process | 4 | 0.016838 | 0.003504 |
| GO:0034447—very low‐density lipoprotein particle clearance | 2 | 0.008419 | 0.026035 | |
| GO:0005977—glycogen metabolic process | 3 | 0.012628 | 0.02648 | |
| GO:0004616—phosphogluconate dehydrogenase (decarboxylating) activity | 2 | 0.008419 | 0.026597 | |
| GO:0042593—glucose homeostasis | 4 | 0.016838 | 0.036994 | |
| Blue module | GO:0000045—autophagosome assembly | 8 | 0.008831 | 3.91E−04 |
| GO:0031225—anchored component of membrane | 13 | 0.014351 | 4.15E−04 | |
| GO:0000422—mitophagy | 7 | 0.007727 | 9.98E−04 | |
| GO:0035615—clathrin adaptor activity | 4 | 0.004416 | 0.00366 | |
| GO:0048333—mesodermal cell differentiation | 4 | 0.004416 | 0.005108 | |
| Brown module | GO:0005149—interleukin‐1 receptor binding | 5 | 0.006932 | 2.72E−04 |
| GO:0009822—alkaloid catabolic process | 3 | 0.004159 | 0.002084 | |
| GO:0005694—chromosome | 9 | 0.012478 | 0.006028 | |
| GO:0016339—calcium‐dependent cell‐cell adhesion via plasma membrane cell adhesion molecules | 5 | 0.006932 | 0.006113 | |
| GO:0046688—response to copper ion | 4 | 0.005546 | 0.006717 | |
| Cyan module | GO:0005149—interleukin‐1 receptor binding | 5 | 0.006932 | 2.72E−04 |
| GO:0042127—regulation of cell proliferation | 12 | 0.016638 | 0.010821 | |
| GO:0005109—frizzled binding | 7 | 0.068001 | 7.87E−09 | |
| GO:1990405—protein antigen binding | 4 | 0.038858 | 7.09E−07 | |
| GO:0030246—carbohydrate binding | 9 | 0.08743 | 1.63E−06 | |
| Green module | GO:0004693—cyclin‐dependent protein serine/threonine kinase activity | 7 | 0.013092 | 4.08E−05 |
| GO:0000502—proteasome complex | 6 | 0.011221 | 0.006056 | |
| GO:0005737—cytoplasm | 124 | 0.23191 | 0.006231 | |
| GO:0008565—protein transporter activity | 6 | 0.011221 | 0.012393 | |
| GO:0002544—chronic inflammatory response | 3 | 0.005611 | 0.013021 | |
| Greenyellow module | GO:0019740—nitrogen utilization | 4 | 0.031204 | 1.07E−06 |
| GO:0008519—ammonium transmembrane transporter activity | 4 | 0.031204 | 3.81E−06 | |
| GO:0072488—ammonium transmembrane transport | 4 | 0.031204 | 8.90E−06 | |
| GO:0016485—protein processing | 6 | 0.046806 | 2.50E−05 | |
| GO:0015695—organic cation transport | 4 | 0.031204 | 4.72E−05 | |
| Magenta module | GO:0005525—GTP binding | 9 | 0.046536 | 0.010217 |
| GO:0008236—serine‐type peptidase activity | 4 | 0.020683 | 0.012926 | |
| GO:0043198—dendritic shaft | 3 | 0.015512 | 0.021781 | |
| GO:0050859—negative regulation of B cell receptor signaling pathway | 2 | 0.010341 | 0.028982 | |
| GO:0005911—cell‐cell junction | 5 | 0.025853 | 0.034829 | |
| Midnightblue module | GO:0048208—COPII vesicle coating | 3 | 0.068666 | 0.00369 |
| GO:0097461—ferric iron import into cell | 2 | 0.045777 | 0.007423 | |
| GO:0008823—cupric reductase activity | 2 | 0.045777 | 0.007678 | |
| GO:0052851—ferric‐chelate reductase (NADPH) activity | 2 | 0.045777 | 0.007678 | |
| GO:0031013—troponin I binding | 2 | 0.045777 | 0.009207 | |
| Pink module | GO:0004013—adenosylhomocysteinase activity | 3 | 0.01313 | 1.81E−04 |
| GO:0019510—S‐adenosylhomocysteine catabolic process | 3 | 0.01313 | 1.89E−04 | |
| GO:0033353—S‐adenosylmethionine cycle | 3 | 0.01313 | 3.75E−04 | |
| GO:0033857—diphosphoinositol‐pentakisphosphate kinase activity | 2 | 0.008753 | 0.015578 | |
| GO:0019838—growth factor binding | 3 | 0.01313 | 0.018746 | |
| Purple module | GO:0017134—fibroblast growth factor binding | 3 | 0.016672 | 0.011684 |
| GO:0007155—cell adhesion | 9 | 0.050017 | 0.012356 | |
| GO:0008305—integrin complex | 3 | 0.016672 | 0.013554 | |
| GO:0004871—signal transducer activity | 6 | 0.033344 | 0.015787 | |
| GO:0004888—transmembrane signaling receptor activity | 6 | 0.033344 | 0.01901 | |
| Red module | GO:0019787—ubiquitin‐like protein transferase activity | 3 | 0.006797 | 0.006085 |
| GO:0030141—secretory granule | 6 | 0.013594 | 0.006222 | |
| GO:0016567—protein ubiquitination | 13 | 0.029453 | 0.009057 | |
| GO:0000281—mitotic cytokinesis | 4 | 0.009062 | 0.009449 | |
| GO:0004842—ubiquitin‐protein transferase activity | 12 | 0.027187 | 0.012324 | |
| Salmon module | GO:0032228—regulation of synaptic transmission, GABAergic | 3 | 0.024876 | 8.10E‐04 |
| GO:0003682—chromatin binding | 6 | 0.049751 | 0.017248 | |
| GO:0001841—neural tube formation | 2 | 0.016584 | 0.028236 | |
| GO:0032403—protein complex binding | 4 | 0.033167 | 0.045062 | |
| GO:0004065—arylsulfatase activity | 2 | 0.016584 | 0.045254 | |
| Tan module | GO:0033344—cholesterol efflux | 4 | 0.025066 | 3.04E−04 |
| GO:0000062—fatty‐acyl‐CoA binding | 3 | 0.018799 | 0.009724 | |
| GO:0034736—cholesterol O‐acyltransferase activity | 2 | 0.012533 | 0.009928 | |
| GO:0016567—protein ubiquitination | 7 | 0.043865 | 0.012043 | |
| GO:0034435—cholesterol esterification | 2 | 0.012533 | 0.015817 | |
| Turquoise module | GO:0046943—carboxylic acid transmembrane transporter activity | 22 | 22/1068 | 2.75E−05 |
| GO:0005342—organic acid transmembrane transporter activity | 22 | 22/1068 | 8.51E−05 | |
| GO:0000990—transcription factor activity, core RNA polymerase binding | 5 | 5/1068 | 9.92E−05 | |
| GO:0015171—amino acid transmembrane transporter activity | 15 | 15/1068 | 0.00012 | |
| GO:0008514—organic anion transmembrane transporter activity | 26 | 26/1068 | 0.000126 | |
| Yellow module | GO:0008168—methyltransferase activity | 12 | 0.019774 | 7.26E−06 |
| GO:0032259—methylation | 8 | 0.013183 | 0.001149 | |
| GO:0051006—positive regulation of lipoprotein lipase activity | 4 | 0.006591 | 0.001153 | |
| GO:0008016—regulation of heart contraction | 5 | 0.008239 | 0.004648 | |
| GO:0070469—respiratory chain | 4 | 0.006591 | 0.009315 |
Abbreviation: GO, gene ontology.
The results of KEGG analysis are exhibited in Table 2. Among these modules, genes in the black module were mainly enriched in biological processes as hsa00520: amino sugar and nucleotide sugar metabolism and hsa04390: Hippo signaling pathway. Genes in the cyan module were mainly enriched in hsa04390: Hippo signaling pathway, hsa04916: melanogenesis, hsa05205: proteoglycans in cancer, hsa04310: Wnt signaling pathway, and hsa04550: signaling pathways regulating pluripotency of stem cells. Genes in the red module were largely enriched in hsa04668: TNF signaling pathway, hsa05168: herpes simplex infection, hsa00600: sphingolipid metabolism, and hsa04141: protein processing in the endoplasmic reticulum. Genes in the greenyellow module were largely enriched in hsa04910: insulin signaling pathway. Genes in the tan module were mainly enriched in hsa04144: endocytosis and hsa00100: steroid biosynthesis.
Table 2.
The KEGG pathway of genes in each module
| Module | Pathway ID | Name | Gene Count | Percentage | P value |
|---|---|---|---|---|---|
| Black module | hsa00520 | Amino sugar and nucleotide sugar metabolism | 3 | 0.012628 | 0.045186 |
| hsa04390 | Hippo signaling pathway | 4 | 0.016838 | 0.047069 | |
| Blue module | hsa04144 | Endocytosis | 18 | 0.019871 | 0.004138 |
| hsa04721 | Synaptic vesicle cycle | 6 | 0.006624 | 0.006681 | |
| hsa00330 | Arginine and proline metabolism | 5 | 0.00552 | 0.029789 | |
| Brown module | hsa04120 | Ubiquitin mediated proteolysis | 10 | 0.013865 | 0.002843 |
| hsa05140 | Leishmaniasis | 6 | 0.008319 | 0.018629 | |
| hsa05166 | HTLV‐I infection | 11 | 0.015251 | 0.03135 | |
| hsa04380 | Osteoclast differentiation | 7 | 0.009705 | 0.045 | |
| Cyan module | hsa04390 | Hippo signaling pathway | 8 | 0.077715 | 1.23E−05 |
| hsa04916 | Melanogenesis | 7 | 0.068001 | 1.28E−05 | |
| hsa05205 | Proteoglycans in cancer | 8 | 0.077715 | 7.54E−05 | |
| hsa04310 | Wnt signaling pathway | 7 | 0.068001 | 7.95E−05 | |
| hsa04550 | Signaling pathways regulating pluripotency of stem cells | 7 | 0.068001 | 8.61E−05 | |
| Greenyellow module | hsa04910 | Insulin signaling pathway | 3 | 0.023403 | 0.048142 |
| Midnightblue module | hsa05321 | Inflammatory bowel disease (IBD) | 2 | 0.045777 | 0.04432 |
| Pink module | hsa04110 | Cell cycle | 5 | 0.021883 | 0.015659 |
| hsa00270 | Cysteine and methionine metabolism | 3 | 0.01313 | 0.035222 | |
| hsa00071 | Fatty acid degradation | 3 | 0.01313 | 0.046016 | |
| hsa04360 | Axon guidance | 4 | 0.017506 | 0.049474 | |
| hsa05210 | Colorectal cancer | 3 | 0.01313 | 0.05423 | |
| Purple module | hsa04620 | Toll‐like receptor signaling pathway | 4 | 0.02223 | 0.022536 |
| hsa05134 | Legionellosis | 3 | 0.016672 | 0.038277 | |
| hsa04810 | Regulation of actin cytoskeleton | 5 | 0.027787 | 0.041896 | |
| hsa04514 | Cell adhesion molecules (CAMs) | 4 | 0.02223 | 0.048926 | |
| Red module | hsa04668 | TNF signaling pathway | 6 | 0.013594 | 0.034553 |
| hsa05168 | Herpes simplex infection | 8 | 0.018125 | 0.036667 | |
| hsa00600 | Sphingolipid metabolism | 4 | 0.009062 | 0.045715 | |
| hsa04141 | Protein processing in endoplasmic reticulum | 7 | 0.015859 | 0.048733 | |
| hsa04668 | TNF signaling pathway | 6 | 0.013594 | 0.034553 | |
| Salmon module | hsa05034 | Alcoholism | 4 | 0.033167 | 0.015651 |
| hsa04550 | Signaling pathways regulating pluripotency of stem cells | 3 | 0.024876 | 0.036596 | |
| hsa04151 | PI3K‐Akt signaling pathway | 4 | 0.033167 | 0.044344 | |
| hsa05034 | Alcoholism | 4 | 0.033167 | 0.015651 | |
| Tan module | hsa04144 | Endocytosis | 5 | 0.031332 | 0.0332 |
| hsa00100 | Steroid biosynthesis | 2 | 0.012533 | 0.041422 | |
| Turquoise module | hsa05134 | Legionellosis | 9 | 0.005112 | 0.01348 |
| hsa00330 | Arginine and proline metabolism | 8 | 0.004544 | 0.026941 | |
| hsa04512 | ECM‐receptor interaction | 10 | 0.00568 | 0.03171 | |
| hsa05321 | Inflammatory bowel disease (IBD) | 8 | 0.004544 | 0.043367 | |
| hsa03018 | RNA degradation | 9 | 0.005112 | 0.044812 | |
| Yellow module | hsa04622 | RIG‐I‐like receptor signaling pathway | 6 | 0.009887 | 0.010586 |
| hsa04932 | Nonalcoholic fatty liver disease (NAFLD) | 8 | 0.013183 | 0.025204 | |
| hsa05010 | Alzheimer's disease | 8 | 0.013183 | 0.04148 | |
| hsa00190 | Oxidative phosphorylation | 7 | 0.011535 | 0.041518 | |
| hsa05203 | Viral carcinogenesis | 9 | 0.01483 | 0.042105 | |
| hsa05012 | Parkinson's disease | 7 | 0.011535 | 0.05405 |
Abbreviation: Akt, Akt/Protein Kinase B; ECM, extracellular matrix; HTLV, human T‐lymphotropic virus 1; KEGG, Kyoto Encyclopedia of Genes and Genomes; PI3K, phosphatidylinositol 3‐kinase; TNF, tumor necrosis factor.
Genes in tan, black, cyan, red, and greenyellow module played critical roles in the energy‐related processes pathway involved in process of sugar and amino, steroid biosynthesis and insulin signaling pathway. Therefore, hsa00100: steroid biosynthesis, hsa00520: amino sugar and nucleotide sugar metabolism, hsa04141: protein processing in the endoplasmic reticulum, and hsa04910: insulin signaling pathway play critical roles in the development of OSA in circulating leukocyte gene expression at baseline and after exposure to CPAP.
3.5. Identification of hub genes in the critical modules
For each identified module, a coexpression network was constructed using Cytoscape. The subnetwork was also identified via Cytoscape plug‐in MCODE. A focus was made on the modules that played critical roles in process of OSA, such as black, cyan, red, tan, and greenyellow modules. The coexpression network and sub‐coexpression network in the rank 1 cluster in the tan module are shown in Figure 8. The genes in the rank 1 cluster in the tan module were SOX18, SOX14, SOWAHB, SOD2, SON, SOCS7, SOCS6, TRAPPC3, STH, TNIP2, and ORC6. Among these genes, SOD2 was the hub gene in the subnetwork. The coexpression network and sub‐coexpression network in rank 1 in the black module are shown in Figure 9. The genes in the rank 1 cluster of the tan module were SH3BP5L, GNG7, and NUAK2. Among these genes, SH3BP5L was the hub gene in the subnetwork. The coexpression network and sub‐coexpression network in rank 1 cluster of the cyan module is shown in Figures 10 and 11. The genes in the rank 1 cluster of the tan module were WNT7A, WSB2, WNT6, WRAP73, WNT5B, WRAP53, WNT9A, WNT8B, WNT8A, and WNT7B. The hub gene was WSB2. The coexpression network and sub‐coexpression network in the rank 1 cluster in the red module are shown in Figure 11. The genes in the rank 1 cluster in the tan module were MUL1, IL10RB, MTHFD2L, ALDH8A1, MIR153‐2, MIR153‐1, SLC27A6, HERC2P4, SLA2, DNAL1, TMEM50A, GSS, LMAN1, C19orf48, LRRC26, DBT, UBQLN2, LOC105370792, CYSRT1, KSR2, UBA1, ZC3H12C, LSM12, UGT8, GPR83, TSPYL2, LDHAL6A, ATP6V0A4, DST, UBQLN4, KRTAP13‐1, ST3GAL4, TPTE, TAGLN3, and RNF169. Among these genes, MTHFD2L was the hub gene in the subnetwork. The coexpression network and sub‐coexpression network in the rank 1 cluster in the greenyellow module are shown in Figure 12. The genes in the rank 1 cluster in the tan module were WSB2, WNT6, WRAP73, WNT5B, WRAP53, WNT9A, WNT8B, WNT8A, WNT7B, and WNT7A. Among which, WSB2 was the hub gene in the subnetwork.
Figure 8.
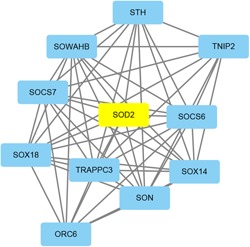
Visualization of the network connections among the most connected genes in the tan module
Figure 9.
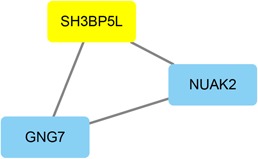
Visualization of the network connections among the most connected genes in the black module
Figure 10.
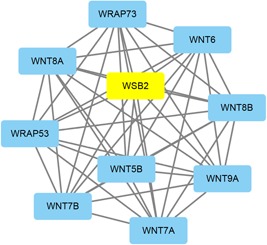
Visualization of the network connections among the most connected genes in the cyan module
Figure 11.
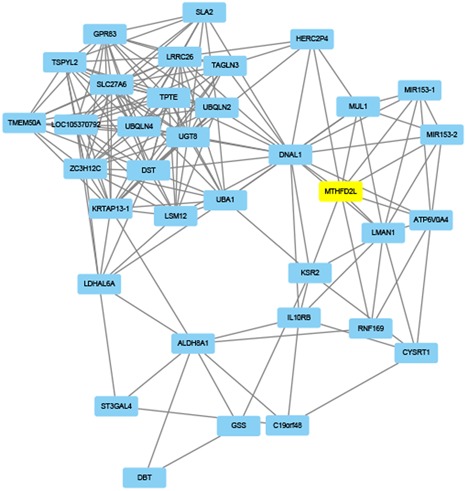
Visualization of the network connections among the most connected genes in the red module
Figure 12.
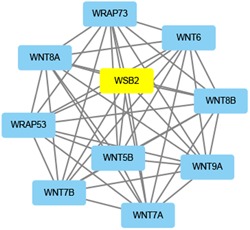
Visualization of the network connections among the most connected genes in the greenyellow module
4. DISCUSSION
It has been recognized that OSA is a complex disorder that exerts profound pathophysiologic and molecular disturbances across multiple organs.27 OSA is associated with an increased risk of obesity‐related diseases, such as diabetes,28 hypertension,29 and dyslipidemia.30 CPAP is the primary treatment of OSA and has been proven to improve the outcomes such as daytime sleepiness, cognitive performance, blood pressure, glucose control, cardiovascular status, quality of life, and mortality.31, 32, 33 Treatment efficacy is however limited by variable adherence. OSA is affected by a complex network of gene interactions. Presently, CPAP is the standard treatment of OSA, but owing to the limited data about the molecular and pathological mechanisms, the interactions of target genes induced by CPAP therapy in patients with OSA are unknown. In this study, GSE 49800 which included the gene expression derived from 36 circulating leukocyte microarray gene expression profiles in 18 patients with OSA at baseline and after exposure to CPAP from GEO databases were comprehensively profiled for circulating leukocyte transcriptome.
The WGCNA method was used to reconstruct robust gene coexpression networks (modules). These modules were established in terms of large‐scale gene expression profiles and the distinction of centrally located genes (hub genes), which drive key cellular signaling pathways.34 The WGCNA approach has provided functional interpretation tools in systems biology and led to new insights into the molecular and pathological mechanisms in several diseases, such as breast cancer and endometrial cancer.18, 35 There are no reports applying WGCNA to systematically identify gene coexpression networks associated with the circulating leukocyte transcriptome in subjects with OSA at baseline and after effective CPAP therapy. To fill this gap, we conducted a WGCNA and calculated the module‐trait correlations based on one public microarray datasets (GSE78000), which included 36 samples and 22 615 genes.
To our best knowledge, this is the first time that the genome‐based profile dataset in patients with OSA after CPAP therapy is explored through the construction of coexpression modules of genes using WGCNA method. A total of 16 distinct modules from 5101 gene expression profiles were identified by the WGCNA package. Among these identified modules, the tan, black, cyan, red, and greenyellow modules were related to the interactions of target genes induced by CPAP therapy in patients with OSA. Further, functional enrichment analysis was also performed on these modules and a subnetwork was constructed via Cytoscape plug‐in MCODE. The results suggested that SOD2, SH3BP5L, WSB2, MTHFD2L, and YPEL4 were the hub genes in these modules. However, further studies are needed to explore and validate these hub genes.
In this study, the critical modules and key genes were determined by GO and KEGG functional modules. The tan, black, cyan, red, and greenyellow modules were considered as the most critical modules in the circulating leukocyte genetic alteration in patients with OSA after CPAP treatment. GO analysis demonstrated that GO:0006641—triglyceride metabolic process, GO:0034447—very low‐density lipoprotein particle clearance, GO:0005977—glycogen metabolic process, GO:0042593—glucose homeostasis, GO:1990405—protein antigen binding, GO:0030246—carbohydrate binding, GO:0016485—protein processing, GO:0019787—ubiquitin‐like protein transferase activity, GO:0030141—secretory granule, GO:0016567—protein ubiquitination, GO:0004842—ubiquitin‐protein transferase activity, GO:0033344—cholesterol efflux, GO:0000062—fatty‐acyl‐CoA binding, GO:0034736—cholesterol O‐acyltransferase activity, and GO:0034435—cholesterol esterification played an important role in the pathogenesis of OSA. KEGG analysis indicated that hsa00100: steroid biosynthesis, hsa00520: amino sugar and nucleotide sugar metabolism, hsa04141: protein processing in the endoplasmic reticulum, and hsa04910: insulin signaling pathway play critical roles in the development of OSA after CPAP treatment of samples. The insulin signaling regulates glucose homeostasis and plays an essential role in metabolism, organ growth, development, fertility, and lifespan.36 A previous study indicated that insulin resistance played an important role in obesity.37, 38
Insulin resistance is common among obese adolescents.39 The pathogenesis of obesity‐associated insulin resistance involves increased free fatty acids and several hormones released by adipose tissue. Adipose tissue constitutes an important site for steroid hormone synthesis and metabolism. Steroid biosynthesis is involved in the adipose tissue, and the presence of the entire steroidogenic apparatus plays the potential roles of local steroid products in modulating the adipose tissue activity and other metabolic parameters. Classical steroidogenic tissues, such as the gonads, adrenals, and placenta, synthesize steroid hormones de novo from cholesterol. Adipose tissue, one of the largest endocrine tissues in the human body, has been established as an important site for steroid storage and metabolism.40 Protein processing and sugar metabolism also play an important role in the development of obesity. Obesity has been recognized as the most risk factor in the development of OSA.41 Therefore, hsa00100: steroid biosynthesis, hsa00520: amino sugar and nucleotide sugar metabolism, hsa04141: protein processing in endoplasmic reticulum, and hsa04910: insulin signaling pathway play critical roles in the development of OSA in circulating leukocyte gene expression at baseline and after exposure to CPAP.
In summary, 16 gene coexpression modules from the GSE 49800 database were identified using WGCNA. The black module, tan module, midninghtblue module, pink module, and greenyellow module were related to interactions of the target genes induced by CPAP therapy in the patient with OSA. Several pathways and hub genes were identified using Cytoscape plug‐in MCODE. Nevertheless, further in vivo and in vitro experiments are still needed to validate these hub genes and to explore additional potential molecular mechanisms.
CONFLICTS OF INTEREST
The authors declare that there are no conflicts of interest
ACKNOWLEDGMENT
This study was financially supported by a grant from the Program for Innovation Team Building at Institutions of Higher Education, Chongqing, China in 2016, no. CXTDG201602006. Application of cone beam CT in the treatment of anterior teeth in the anterior teeth of adults with skeletal class II and III malocclusion (No. 2014 Zhuwei Technology Contract No. 028).
Peng J, Zhou J, Yin X, Song J, and Song J. Effects of CPAP on the transcriptional signatures in patients with obstructive sleep apnea via coexpression network analysis. J Cell Biochem. 2019;120:9277‐9290. 10.1002/jcb.28203
Juxiang Peng and Jukun Song are contributed equally to this article.
References
REFERENCES
- 1. Loube DI, Gay PC, Strohl KP, Pack AI, White DP, Collop NA. Indications for positive airway pressure treatment of adult obstructive sleep apnea patients: a consensus statement. Chest. 1999;115:863‐866. [DOI] [PubMed] [Google Scholar]
- 2. Bixler EO, Vgontzas AN, Lin HM, et al. Prevalence of sleep‐disordered breathing in women: effects of gender. Am J Respir Crit Care Med. 2001;163:608‐613. [DOI] [PubMed] [Google Scholar]
- 3. Bixler EO, Vgontzas AN, Ten have T, Tyson K, Kales A. Effects of age on sleep apnea in men: I. Prevalence and severity. Am J Respir Crit Care Med. 1998;157:144‐148. [DOI] [PubMed] [Google Scholar]
- 4. Zhao Y, Yu BYM, Liu Y, Liu Y. Meta‐analysis of the effect of obstructive sleep apnea on cardiovascular events after percutaneous coronary intervention. Am J Cardiol. 2017;120:1026‐1030. [DOI] [PubMed] [Google Scholar]
- 5. Lam JCM, Mak JCW, Ip MSM. Obesity, obstructive sleep apnoea and metabolic syndrome. Respirology. 2012;17:223‐236. [DOI] [PubMed] [Google Scholar]
- 6. Huyett P, Kim S, Johnson JT, Soose RJ. Obstructive sleep apnea in the irradiated head and neck cancer patient. Laryngoscope. 2017;127:2673‐2677. [DOI] [PubMed] [Google Scholar]
- 7. Gildeh N, Drakatos P, Higgins S, Rosenzweig I, Kent BD. Emerging co‐morbidities of obstructive sleep apnea: cognition, kidney disease, and cancer. J Thorac Dis. 2016;8:E901‐E917. [DOI] [PMC free article] [PubMed] [Google Scholar]
- 8. Jennum P, Tønnesen P, Ibsen R, Kjellberg J. Obstructive sleep apnea: effect of comorbidities and positive airway pressure on all‐cause mortality. Sleep Med. 2017;36:62‐66. [DOI] [PubMed] [Google Scholar]
- 9. Siccoli MM, Pepperell JCT, Kohler M, Craig SE, Davies RJO, Stradling JR. Effects of continuous positive airway pressure on quality of life in patients with moderate to severe obstructive sleep apnea: data from a randomized controlled trial. Sleep. 2008;31:1551‐1558. [DOI] [PMC free article] [PubMed] [Google Scholar]
- 10. Epstein LJ, Kristo D, Strollo PJ, Jr. , et al. Clinical guideline for the evaluation, management and long‐term care of obstructive sleep apnea in adults. J Clin Sleep Med. 2009;5:263‐276. [PMC free article] [PubMed] [Google Scholar]
- 11. Gottlieb DJ, Punjabi NM, Mehra R, et al. CPAP versus oxygen in obstructive sleep apnea. N Engl J Med. 2014;370:2276‐2285. [DOI] [PMC free article] [PubMed] [Google Scholar]
- 12. Iftikhar IH, Valentine CW, Bittencourt LRA, et al. Effects of continuous positive airway pressure on blood pressure in patients with resistant hypertension and obstructive sleep apnea: a meta‐analysis. J Hypertens. 2014;32:2341‐2350. [DOI] [PMC free article] [PubMed] [Google Scholar]
- 13. Mansfield DR, Gollogly NC, Kaye DM, Richardson M, Bergin P, Naughton MT. Controlled trial of continuous positive airway pressure in obstructive sleep apnea and heart failure. Am J Respir Crit Care Med. 2004;169:361‐366. [DOI] [PubMed] [Google Scholar]
- 14. Schwarz EI, Puhan MA, Schlatzer C, Stradling JR, Kohler M. Effect of CPAP therapy on endothelial function in obstructive sleep apnoea: a systematic review and meta‐analysis. Respirology. 2015;20:889‐895. [DOI] [PubMed] [Google Scholar]
- 15. Nadeem R, Singh M, Nida M, et al. Effect of CPAP treatment for obstructive sleep apnea hypopnea syndrome on lipid profile: a meta‐regression analysis. J Clin Sleep Med. 2014;10:1295‐1302. [DOI] [PMC free article] [PubMed] [Google Scholar]
- 16. Langfelder P, Horvath S. WGCNA: an R package for weighted correlation network analysis. BMC Bioinformatics. 2008;9:559. [DOI] [PMC free article] [PubMed] [Google Scholar]
- 17. Zhang B, Horvath S. A general framework for weighted gene co‐expression network analysis [published online ahead of print August 12, 2005]. Stat Appl Genet Mol Biol. 2005;4 10.2202/1544-6115.1128 [DOI] [PubMed] [Google Scholar]
- 18. Horvath S, Dong J. Geometric interpretation of gene coexpression network analysis. PLoS Comput Biol. 2008;4:e1000117. [DOI] [PMC free article] [PubMed] [Google Scholar]
- 19. Sengupta U, Ukil S, Dimitrova N, Agrawal S. Expression‐based network biology identifies alteration in key regulatory pathways of type 2 diabetes and associated risk/complications. PLoS One. 2009;4:e8100. [DOI] [PMC free article] [PubMed] [Google Scholar]
- 20. Sun Q, Zhao H, Zhang C, et al. Gene co‐expression network reveals shared modules predictive of stage and grade in serous ovarian cancers. Oncotarget. 2017;8:42983‐42996. [DOI] [PMC free article] [PubMed] [Google Scholar]
- 21. Gharib SA, Seiger AN, Hayes AL, Mehra R, Patel SR. Treatment of obstructive sleep apnea alters cancer‐associated transcriptional signatures in circulating leukocytes. Sleep. 2014;37:709‐714. [DOI] [PMC free article] [PubMed] [Google Scholar]
- 22. Irizarry RA, Hobbs B, Collin F, et al. Exploration, normalization, and summaries of high density oligonucleotide array probe level data. Biostatistics. 2003;4:249‐264. [DOI] [PubMed] [Google Scholar]
- 23. Huang DW, Sherman BT, Lempicki RA. Systematic and integrative analysis of large gene lists using DAVID bioinformatics resources. Nat Protoc. 2009;4:44‐57. [DOI] [PubMed] [Google Scholar]
- 24. Dennis G, Jr. , Sherman BT, Hosack DA, et al. DAVID: database for annotation, visualization, and integrated discovery. Genome Biol. 2003;4:R60. [PubMed] [Google Scholar]
- 25. Bader GD, Hogue CW. An automated method for finding molecular complexes in large protein interaction networks. BMC Bioinformatics. 2003;4:2. [DOI] [PMC free article] [PubMed] [Google Scholar]
- 26. Shannon P, Markiel A, Ozier O, et al. Cytoscape: a software environment for integrated models of biomolecular interaction networks. Genome Res. 2003;13:2498‐2504. [DOI] [PMC free article] [PubMed] [Google Scholar]
- 27. Sher AE. Obstructive sleep apnea syndrome: a complex disorder of the upper airway. Otolaryngol Clin North Am. 1990;23:593‐608. [PubMed] [Google Scholar]
- 28. Kurosawa H, Saisho Y, Fukunaga K, et al. Association between severity of obstructive sleep apnea and glycated hemoglobin level in Japanese individuals with and without diabetes. Endocr J. 2017;65:121‐127. [DOI] [PubMed] [Google Scholar]
- 29. Balanis T, Sanner B. [Obstructive sleep apnea and hypertension]. MMW Fortschr Med. 2017;159:62‐66. [DOI] [PubMed] [Google Scholar]
- 30. Xia Y, Fu Y, Wang Y, et al. Prevalence and predictors of atherogenic serum lipoprotein dyslipidemia in women with obstructive sleep apnea. Sci Rep. 2017;7:41687. [DOI] [PMC free article] [PubMed] [Google Scholar]
- 31. Antic NA, Catcheside P, Buchan C, et al. The effect of CPAP in normalizing daytime sleepiness, quality of life, and neurocognitive function in patients with moderate to severe OSA. Sleep. 2011;34:111‐119. [DOI] [PMC free article] [PubMed] [Google Scholar]
- 32. Javaheri S, Smith J, Chung E. The prevalence and natural history of complex sleep apnea. J Clin Sleep Med. 2009;5:205‐211. [PMC free article] [PubMed] [Google Scholar]
- 33. Weaver TE, Maislin G, Dinges DF, et al. Relationship between hours of CPAP use and achieving normal levels of sleepiness and daily functioning. Sleep. 2007;30:711‐719. [DOI] [PMC free article] [PubMed] [Google Scholar]
- 34. Miller JA, Horvath S, Geschwind DH. Divergence of human and mouse brain transcriptome highlights Alzheimer disease pathways. Proc Natl Acad Sci USA. 2010;107:12698‐12703. [DOI] [PMC free article] [PubMed] [Google Scholar]
- 35. Levine AJ, Miller JA, Shapshak P, et al. Systems analysis of human brain gene expression: mechanisms for HIV‐associated neurocognitive impairment and common pathways with Alzheimer's disease. BMC Med Genomics. 2013;6:4. [DOI] [PMC free article] [PubMed] [Google Scholar]
- 36. Zhang J, Liu F. Tissue‐specific insulin signaling in the regulation of metabolism and aging. IUBMB Life. 2014;66:485‐495. [DOI] [PMC free article] [PubMed] [Google Scholar]
- 37. Tarasenko KV, Gromova AM, Pikul KV, Lysenko RB, Nesterenko LA. Pathogenesis of insulin resistance in pregnant women with obesity. Wiad Lek. 2018;71:801‐806. [PubMed] [Google Scholar]
- 38. van der Kolk BW, Vogelzangs N, Jocken JWE, et al. Plasma lipid profiling of tissue‐specific insulin resistance in human obesity [published online ahead of print September 21, 2018]. Int J Obes. 2018. [DOI] [PubMed] [Google Scholar]
- 39. Thota P, Perez‐Lopez FR, Benites‐Zapata VA, Pasupuleti V, Hernandez AV. Obesity‐related insulin resistance in adolescents: a systematic review and meta‐analysis of observational studies. Gynecol Endocrinol. 2017;33:179‐184. [DOI] [PubMed] [Google Scholar]
- 40. Li J, Papadopoulos V, Vihma V. Steroid biosynthesis in adipose tissue. Steroids. 2015;103:89‐104. [DOI] [PubMed] [Google Scholar]
- 41. Young T, Peppard PE, Gottlieb DJ. Epidemiology of obstructive sleep apnea: a population health perspective. Am J Respir Crit Care Med. 2002;165:1217‐1239. [DOI] [PubMed] [Google Scholar]


