

Abstract
The objectives of this study were to characterize the concentration‐time profiles of total radioactivity equivalent and unchanged cefiderocol, the route(s) of elimination and mass balance, and safety of cefiderocol after intravenous administration of a single 1000‐mg (100 μCi) dose of [14C]‐cefiderocol as a 1‐hour infusion in healthy adult male subjects. Unchanged cefiderocol accounted for the majority of total radioactivity in plasma, and the partitioning of total radioactivity into red blood cells was negligible. The recovery of total radioactivity was complete in all subjects within 120 hours after initiation of the infusion (101.5% of the administered dose). Cefiderocol‐related material was primarily excreted into urine, with 98.7% of the administered dose of [14C]‐cefiderocol excreted as total radioactivity into urine and negligible excretion into feces. Based on the results of metabolite profiling, cefiderocol accounted for 92.3% of area under the concentration‐time curve of total radioactivity in plasma and accounted for 90.6% of the administered dose excreted into urine. Metabolism was a minor route of elimination for cefiderocol. Cefiderocol was generally safe and well tolerated in healthy adult male subjects. In conclusion, unchanged cefiderocol represents the majority of total radioactivity in plasma. Cefiderocol is primarily excreted as unchanged drug into urine. This study indicates that cefiderocol and drug‐related material did not remain in the body.
Keywords: cefiderocol, cephalosporin, pharmacokinetics, mass balance, metabolite profiling
Cefiderocol (also known as S‐649266) is being developed as a treatment for aerobic, Gram‐negative, bacterial infections, in particular, carbapenem‐resistant Enterobacteriaceae, multidrug‐resistant Pseudomonas aeruginosa, and multidrug‐resistant Acinetobacter baumannii.1, 2, 3, 4, 5 The intended dosing route of cefiderocol is intravenous administration. Siderophore antibiotics have been investigated for decades; however, none of them is available for clinical use in the treatment of bacterial infections.6, 7, 8, 9 Cefiderocol is a novel injectable siderophore cephem antibiotic with a catechol moiety, which enables it to form a chelating complex with ferric iron and utilize the iron transport system of bacteria to efficiently penetrate the outer cell wall.10 This concept of carrying compounds into other cells such as bacteria has been likened to the “Trojan Horse.”11, 12 After transport into the Gram‐negative periplasmic space, cefiderocol exhibits high binding affinity for penicillin‐binding proteins (mainly penicillin‐binding protein 3 of Enterobacteriaceae and nonfermenting bacteria), and inhibits bacterial growth by inhibiting bacterial cell wall synthesis.13 The kinetic studies using the purified carbapenemases such as imipenemase‐1, Verona integron‐encoded metallo‐β‐lactamase‐2 L‐1, and oxacillinase‐23 showed that cefiderocol has low k cat/Km values against all of these carbapenemases compared with the marketed products like meropenem.14 These results demonstrate that cefiderocol is highly stable to both serine‐type β‐lactamases such as class D and also metallo‐β‐lactamase (class B).
The safety, tolerability, and pharmacokinetics (PK) of cefiderocol have been characterized in single‐ and multiple‐dose studies in healthy subjects.15, 16 Cefiderocol is associated with linear PK over the dose range of 100 to 2000 mg. The terminal elimination half‐life of cefiderocol is 1.98 to 2.74 hours. Cefiderocol is primarily (60%‐70% of the administered dose) eliminated as unchanged drug into urine, and no major metabolites have been identified; however, information such as excretion route for the remaining 30% was unknown. Therefore, the objectives of this study were to investigate the PK profiles of total radioactivity equivalent of cefiderocol concentrations and unchanged cefiderocol to confirm whether there are any potential metabolites in plasma and to investigate the route(s) of elimination and mass balance of cefiderocol after intravenous administration of a single 1000‐mg (approximately 100‐μCi) dose of carbon 14–labeled cefiderocol ([14C]‐cefiderocol, Figure 1) in healthy adult male subjects.
Figure 1.
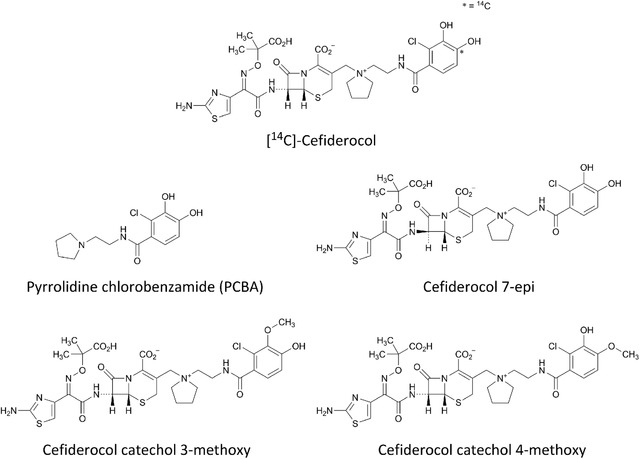
Structure of [14C]‐cefiderocol and metabolite reference standards.
Methods
Ethical Considerations
The clinical study was conducted at Celerion in Lincoln, Nebraska, in accordance with all appropriate regulatory requirements and under the protocol approved by the Chesapeake Institutional Review Board (Pro00014008), Columbia, Maryland. The study was conducted in accordance with current International Conference on Harmonization Good Clinical Practices, all appropriate subject privacy requirements, and the ethical principles outlined in the Declaration of Helsinki. Signed informed consent forms were obtained from all subjects prior to participation.
Study Subjects
Subjects who satisfied the eligibility criteria were entered into the study. The primary inclusion criteria were as follows: subjects were male; 19 to 50 years of age, inclusive; body weight of ≥50 kg; and body mass index of 18.5 to 30 kg/m2; continuous nonsmokers (≥ 6 months); considered to be medically healthy, as determined by the principal investigator, based on clinical evaluations including medical history, physical examination, 12‐lead electrocardiogram, vital sign measurements, and clinical laboratory tests performed at the screening visit and admission to the study. Exclusion criteria included a history of gastrointestinal surgery; <1 bowel movement every 2 days; abnormal bowel habits such as diarrhea, loose stools, or constipation; estimated creatinine clearance ≤80 mL/min based on the Cockcroft‐Gault equation; hypersensitivity to β‐lactam antibiotics; and radiolabeled substance/radiation exposure over the past or within the next 12 months.
Materials
Radiolabeled cefiderocol, [14C]‐cefiderocol was manufactured under the Good Manufacturing Practice processes by Ricerca Biosciences, Concord, Ohio. The final specific radioactivity of 0.1 μCi/mg of [14C]‐cefiderocol was prepared, and its chemical purity and radiochemical purity were 100% and 98.5%, respectively, with a water content of 13.0%. The sterile [14C]‐cefiderocol dosing solution for intravenous administration was prepared by Lincoln Celerion Pharmacy on the day of administration. Metabolite reference standards, pyrrolidine chlorobenzamide (PCBA), cefiderocol‐7‐epi, cefiderocol catechol 3‐methoxy, and cefiderocol catechol 4‐methoxy were synthesized by Shionogi, Co., Ltd., Osaka, Japan (Figure 1).
Study Design
This was an open‐label, nonrandomized, single‐dose study. The subjects received a single intravenous administration of 1000 mg of cefiderocol containing 100 μCi of [14C]‐cefiderocol over 1 hour. The 1000‐mg dose was selected based on the linear PK profile associated with cefiderocol up to 2000 mg for a 1‐hour infusion15 and in consideration of the limit of quantification for the parent drug and total radioactivity. Blood, urine, and fecal samples were collected for the determination of total radioactivity cefiderocol concentration equivalents in plasma, whole blood, urine, and feces; cefiderocol concentrations in plasma; and identification of potential metabolites in plasma, urine, and feces. On day 5 (96 hours after initiation of the infusion), the subjects could be discharged after completion of end‐of‐study procedures if both of the following criteria were met: (1) levels of total radioactivity in 2 consecutive blood samples were below the lower limit of quantification (LLOQ), and (2) if ≥90% of the administered radioactive dose had been collected, levels of total radioactivity in 2 consecutive 24‐hour urine and feces collections combined represented ≤1% of the administered radioactive dose. If the discharge criteria were not met, the subject remained at the clinical site for collection of blood, urine, and feces until the criteria were met or until day 15, whichever occurred first.
Blood, Urine, and Feces Sample Collection
Blood samples for determination of total radioactivity cefiderocol equivalent concentrations in plasma and whole blood and for cefiderocol concentrations in plasma were collected before dosing and at 0.5, 1 (just before the end of infusion), 1.5, 2, 3, 4, 5, 6, 8, 12, 16, 24, 36, 48, 72, and 96 hours after initiation of the infusion, and thereafter every 24 hours until discharge criteria were met. Blood samples for metabolic profiling in plasma were collected before dosing and at 1, 2, 4, 8, 12, 16, 24, 48, 72, and 96 hours after initiation of the infusion. Blood samples for determination of hematocrit values were collected at 1, 4, 16, 24, and 72 hours after initiation of the infusion. Total calculated volumes of blood drawn from each subject for the above samplings as well as all of the clinical laboratory tests during this study were within the range of 366.5 mL (up to 96 hours, day 5) to 496.5 mL (day 15); the actual blood volumes collected were 366.5 mL to 392.5 mL.
Urine was obtained in the appropriate urine collection containers during the following timed intervals: before dosing from –12 to 0 hours and after initiation of the infusion from 0 to 6 hours, 6 to 12 hours, and 12 to 24 hours on day 1, and thereafter every 24 hours until discharge criteria were met. The same volume of urine and 0.2 mol/L of ammonium acetate buffer (pH 5) were mixed to prepare the composite urine samples, and the samples were used for determination of total radioactivity and metabolite profiling. Feces were obtained in the appropriate fecal collection containers during the following time intervals: before dosing from –24 to 0 hours and after initiation of the infusion every 24 hours until discharge criteria were met. The fecal samples and 50% MeOH/50% 0.2 mol/L of ammonium acetate buffer (pH 5) were mixed in the ratio of 1:3 (w/v) to prepare the fecal homogenate, and the homogenate was used for determination of total radioactivity and metabolite profiling.
Measurement of Cefiderocol Concentrations in Plasma
The same volume of plasma and 0.2 mol/L ammonium acetate buffer (pH 5) were mixed to prepare the composite plasma samples, and the samples were used for measurement of cefiderocol concentrations and metabolite profiling. The composite plasma samples were deproteinated and centrifugated to obtain the supernatant of plasma sample, and cefiderocol concentrations in plasma were determined by a validated high‐performance liquid chromatography–tandem mass spectrometry (HPLC‐MS/MS) methods at QPS, LLC (Newark, Delaware). Chromatographic separation was achieved with a Synergi Polar RP 100A Ti Frits, 2.0 × 50‐mm column, by a gradient method based on the mixture of Mobile phase A (10 mM ammonium formate:10 mM formic acid [2:8, v/v], pH 3) and B (methanol:isopropanol:0.1% formic acid [2:2:1, v/v/v]). The quantification range of this assay was from 0.100 to 100 μg/mL, and the precision and accuracy of the assay were 2.3% to 16.3% and –12.6% to 6.0%, respectively.
Total Radioactivity Determination in Plasma, Blood, Urine, and Feces
The plasma samples (0.5 mL) and composite urine samples (1.0 g) were transferred directly into vials and mixed with 10 mL of liquid scintillation cocktail (Ultima Gold). The blood samples (0.25 g) and fecal homogenates (0.5 g) were oxidized for the collection of radioactivity in a liquid scintillation cocktail. Carbosorb and Permafluor E+ (10 mL each) were used as a sequester 14CO2 during oxidation and a liquid scintillation cocktail, respectively. The radioactivity for plasma, blood, urine, and feces samples was determined for 5 minutes using a TriCarb model 2910TR liquid scintillation counter (Perkin Elmer, Greenville, South Carolina) at Celerion (Lincoln, Nebraska). The LLOQ was defined as 2.5 multiplied by the average background in units of disintegration per minute. Each predose sample was used as the background sample. The LLOQ in plasma and blood were 0.483 μg eq/mL and 0.889 μg eq/g, respectively. The LLOQ in urine and feces except for Subject 5 were 0.264 μg eq/g and 0.445 μg eq/g, respectively. The LLOQ in urine and feces for Subject 5 were 1.90 μg eq/g and 3.45 μg eq/g, respectively, due to higher background radioactivity.
Determination of the Association of Total Radioactivity in Red Blood Cells
The association of total radioactivity in red blood cells (RBCs) was calculated for each subject at predefined time points (1, 4, 16, 24, and 72 hours from start of infusion) based on the total radioactivity in blood (Cb), plasma (Cp), and hematocrit (Hct) value by the following equation:
The association of total radioactivity in RBCs (%) =([Cb − Cp × (1 – Hct)]/Cb) × 100
Sample Preparation for Metabolite Profiling
The total radioactivity in the plasma samples was not detected 24 hours after dosing, so the composite plasma samples from each subject were pooled across time points (1, 2, 4, 8, 12, and 16 hours after dosing) using the pooling method17 for area under the concentration‐time curve (AUC) calculation. Each pooled plasma sample (1 mL each) was extracted twice by 4 mL of trifluoroacetic acid/methanol (0.2:100, v/v) and centrifuged. The supernatants were concentrated, centrifuged, and then transferred to injection vials for analysis. The composite urine from each subject was pooled in proportion to sample weights across time intervals at 0 to 6, 6 to 12, 12 to 24, and 24 to 48 hours after dosing. Each pooled urine sample was centrifuged, and the supernatant was transferred to an injection vial for analysis. The fecal homogenate from each subject was pooled in proportion to the sample weights across time intervals from 0 to 72 hours after dosing except for Subject 5, whose samples were pooled from 0 to 120 hours after dosing. Each pooled fecal sample (4 or 8 g each) were extracted 4 times by 12 or 24 mL of trifluoroacetic acid/methanol (0.2:100, v/v) and centrifuged. The supernatants were concentrated, centrifuged, and then transferred to injection vials for analysis. The mean extraction recovery of total radioactivity in plasma, urine, and feces samples were 99.4%, 99.5%, and 101.5%, respectively.
Mass Spectrometric Characterization
An HPLC system with a Finnigan LTQ mass spectrometer (Thermo Electron Corporation, Madison, Wisconsin) or TripleTOF 6600 mass spectrometer (SCIEX, Washington, DC) was used for the analysis of each processed plasma, urine, and feces sample. Chromatographic separation was achieved with a Supelco Ascentis Express, phenyl‐hexyl, 4.6 × 100 mm column (Sigma‐Aldrich, St. Louis, Missouri), using an LC‐30AD pump (Shimadzu Corporation, Kyoto, Japan) by a gradient method based on the mixture of Mobile phase A (formic acid/H2O [0.1:100, v/v]) and B (formic acid/MeOH [0.1:100, v/v]). Identification of these metabolites was confirmed by matching mass spectra (MS and MS/MS) and retention times with authentic reference standards. For other unknown metabolites, molecular ions were searched on liquid chromatography/MS chromatograms operating in full scan positive ionization modes at the same retention times as radioactive peaks found on a liquid chromatography‐radio chromatogram. Product ion mass spectra and high‐resolution mass spectra were then acquired for the corresponding molecular ions. Putative metabolite structures were proposed based on the analysis of their mass fragment patterns.
Quantitation of [14C]‐Cefiderocol and Its Metabolites
An HPLC‐TopCount NXT system was used for the radio‐quantitation of plasma, urine, and fecal samples. HPLC fractions were collected in a LumaPlate 96‐well plate, dried, and counted by TopCount NXT Microplate Scintillation & Luminescence Counter (PerkinElmer). The data were processed using ProFSA (PerkinElmer) software. The LLOQ for radioactivity was defined as the ratio of signal to noise (3 to 1) on the radio‐chromatogram. The recovery of total radioactivity from the radio‐HPLC system for plasma and urine were 98.1% and 98.3%, respectively.
Pharmacokinetic Analysis
Noncompartmental PK parameters were calculated from each subject's concentrations of total radioactivity in plasma and whole blood, concentrations of cefiderocol in plasma using Phoenix WinNonlin Version 6.3 (Certara, St. Louis, Missouri). The PK parameters for total radioactivity and cefiderocol reported included the AUC from time zero to the time of the last quantifiable sample after dosing (AUC0‐last), AUC from time zero extrapolated to infinity (AUC0‐inf), maximum observed concentration (Cmax), time to the maximum concentration (Tmax), apparent terminal elimination half‐life (t1/2,z), apparent total clearance (CL), and apparent volume of distribution during the terminal elimination phase (Vz). The CL and Vz values were estimated based on actual doses described later. The ratios of Cmax and AUC0‐inf for cefiderocol to total radioactivity in plasma were calculated. Descriptive statistics of cefiderocol and total radioactivity concentrations were calculated with below the LLOQ values were treated as zero for arithmetic mean, standard deviation, and percent coefficient of variation parameters and treated as missing for geometric mean (GM) and percent coefficient of variation GM values. The PK parameters were compared among total radioactivity in whole blood, total radioactivity in plasma, and plasma concentrations of cefiderocol by the Steel‐Dwass test.
Each subject's administered dose of [14C]‐cefiderocol was determined before administration by measuring the total radioactivity concentration in an aliquot of the prepared infusion solution and the total volume administered with doses ranging from 855.01 mg (89.78 μCi) to 947.11 mg (99.45 μCi). The excretion of total radioactivity in urine and feces was then calculated for each subject's individual administered dose. The percentage of the administered dose recovered in urine or feces during each collection interval and cumulative percentage of the administered dose recovered in the urine or feces were calculated. Descriptive statistics for urine and fecal parameters and the concentrations of total radioactivity in urine and feces were calculated, and values that were below the LLOQ were set to zero.
Safety Assessment
Safety was monitored by physical examinations, vital sign measurements, 12‐lead electrocardiograms, clinical laboratory tests, and reporting of adverse events. All adverse events were collected, regardless of whether they occurred before or after study drug administration, from the time of informed consent until a minimum of 14 days after initiation of the infusion (day 15).
Results
Demographics
Six healthy adult male subjects between the ages of 26 and 47 years, the weight of 81.9 and 95.1 kg, and body mass index of 23.1 and 28.7 kg/m2 were enrolled in this study. The mean age, weight, and body mass index were 36 years, 88.9 kg, and 26.8 kg/m2, respectively. The majority (67%) of subjects were white, and all subjects were non‐Hispanic/Latino. After study drug administration, all subjects met the discharge criteria, were discharged between day 7 and day 8, and completed the study.
Pharmacokinetics
The concentration‐time profiles of total radioactivity in whole blood and plasma and cefiderocol in plasma after administration of [14C]‐cefiderocol are shown in Figure 2. Pharmacokinetic parameters of total radioactivity in whole blood and plasma and cefiderocol in plasma are presented in Table 1. The GM of the Cmax and AUC0‐inf for the total radioactivity in plasma were approximately 2‐fold higher compared with corresponding parameters in whole blood, and the GM of the t1/2,z of total radioactivity were similar in both matrices. The GM of the Cmax and AUC0‐inf of cefiderocol in plasma were similar to corresponding parameters for total radioactivity. The GM of the t1/2,z values in plasma were comparable between cefiderocol and total radioactivity. The GM of the CL and Vz values for plasma cefiderocol were relatively similar to those of plasma total radioactivity, and nearly 2‐fold lower than those for whole blood total radioactivity. The statistical analysis demonstrated there were no statistically significant differences in PK parameters between total radioactivity in plasma and cefiderocol in plasma except for Vz. Also, the statistical analysis demonstrated Cmax, AUC0‐last, AUC0‐inf, CL, and Vz were statistically different between total radioactivity in whole blood and total radioactivity in plasma or cefiderocol in plasma.
Figure 2.
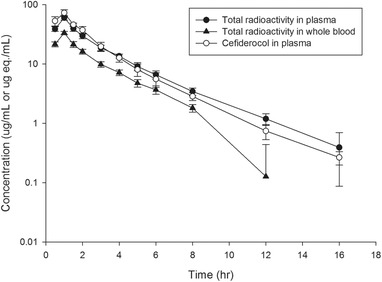
Concentration‐time profiles of total radioactivity in whole blood and plasma and cefiderocol in plasma following a single intravenous infusion of 1000 mg of [14C]‐cefiderocol over 1 hour.
Table 1.
Summary of Pharmacokinetic Parameters of Total Radioactivity in Whole Blood and Plasma, and Cefiderocol in Plasma Following a Single Intravenous Infusion of 1000 mg [14C]‐Cefiderocol Over 1 Hour
| PK Parameter | Total Radioactivity in Whole Blood (N = 6) | Total Radioactivity in Plasma (N = 6) | Cefiderocol in Plasma (N = 6) |
|---|---|---|---|
| Cmax (μg/mL)a | 33.3 (6.5) | 59.8 (9.3)* | 72.9 (12.4)* |
| Tmax (h) | 0.98 (0.98, 1.00) | 0.99 (0.98, 1.01) | 0.97 (0.50, 1.00) |
| AUC0‐last (μg · h/mL)b | 79.26 (8.7) | 155.4 (10.0)* | 170.8 (8.4)* |
| AUC0‐inf (μg · h/mL)b | 84.26 (8.9) | 158.0 (9.8)* | 171.7 (8.4)* |
| t1/2,z (h) | 2.1 (15.1) | 2.7 (14.5) | 2.3 (9.5) |
| CL (L/h) | 9.72 (6.3) | 5.19 (6.5)* | 4.78 (7.6)* |
| Vz (L) | 30.1 (17.8) | 20.5 (16.5)* | 15.8 (15.1)* , ** |
| Ratio Cmax c | NC | NC | 1.219 (15.3) |
| Ratio AUCd | NC | NC | 1.086 (4.5) |
AUC0‐inf, area under the plasma concentration‐time curve from time zero to infinity; AUC0‐last, area under the plasma concentration‐time curve from zero to the time of the last quantifiable concentration; CL, total drug clearance from plasma; Cmax, maximum concentration; CV%, coefficient of variation %; eq, equivalents; NC, not calculated; t1/2,z, terminal half‐life; Tmax, time to Cmax; Vz, apparent volume of distribution during the terminal elimination phase.
Geometric mean (CV% geometric mean) is shown except for Tmax where median and range (minimum, maximum) are shown.
μg · eq/mL for total radioactivity in plasma and μg · eq/g for total radioactivity in whole blood.
μg · eq · h/mL for total radioactivity in plasma and μg · eq · h/g for total radioactivity in whole blood.
Ratio Cmax = plasma Cmax of cefiderocol/plasma Cmax of total radioactivity.
Ratio AUC = plasma AUC0‐inf of cefiderocol/plasma AUC0‐inf of total radioactivity.
* P < .05 for total radioactivity in plasma or cefiderocol in plasma vs total radioactivity in whole blood.
** P < .05 for cefiderocol in plasma vs total radioactivity in plasma.
Mean ratios for whole blood to plasma partitioning ratio (Rb:p) ranged from 0.53 to 0.56 at different time points throughout the 12 hours after initiation of the infusion. The association of total radioactivity into RBCs was determined at 1 and 4 hours after initiation of the infusion time points, which were the only time points where quantified in both whole blood and plasma. Mean partitioning values showed less than zero at both time points.
Excretion of Radioactivity
Urine and feces were collected from 6 subjects over 120 hours after the initiation of infusion of [14C]‐cefiderocol. The mean urinary excretion of radioactivity at the interval of 0 to 6 hours, 0 to 48 hours were approximately 74.6%, and 98.5%, respectively. The mean fecal excretion of radioactivity was negligible. The mean total recovery of radioactivity in urine and feces over 120 hours after dosing was 101.5% of the administered dose (Table 2).
Table 2.
Cumulative Excretion of Total Radioactivity in Urine and Feces Following a Single Intravenous Infusion of 1000 mg [14C]‐Cefiderocol Over 1 Hour
| Cumulative Excretion Ratio (% of Dose Administered) | ||||||
|---|---|---|---|---|---|---|
| Urine | Feces | Total | ||||
| Interval (h) | Mean | SD | Mean | SD | Mean | SD |
| 0‐6 | 74.6 | 4.0 | NS | N/A | 74.6 | 4.0 |
| 0‐48 | 98.5 | 4.2 | 2.1 | 1.3 | 100.7 | 5.3 |
| 0‐120 | 98.7 | 4.0 | 2.9 | 0.7 | 101.5 | 4.4 |
N/A, not applicable; NS, not sampled; SD, standard deviation.
Arithmetic mean and SD are shown.
Metabolite Profiling
Representative radio‐chromatograms for pooled plasma, urine, and feces are shown in Figure 3A‐C, and the relative contributions of cefiderocol and metabolites in plasma, urine, and feces samples are listed in Table 3.
Figure 3.
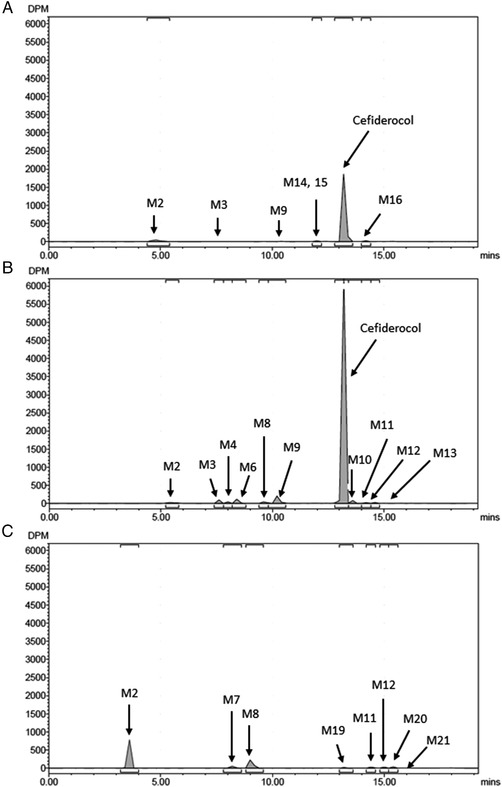
Representative radio‐chromatograms of (A) 0‐16‐hour pooled plasma extracts, (B) 0‐48‐hour pooled urine, (C) 0‐72‐hour pooled feces extracts following a single intravenous infusion of 1000 mg of [14C]‐cefiderocol over 1 hour.
Table 3.
Radio‐quantitation of [14C]‐Cefiderocol and Metabolites in Plasma, Urine, and Feces
| Metabolite | Plasma (% of Total Radioactivity) | Urine (% of Dose Administered) | Feces (% of Dose Administered) | Total Excreta (% of Dose Administered) |
|---|---|---|---|---|
| M2 | 4.7 | 0.6 | 1.7 | 2.3 |
| M3 | 0.2 | 1.1 | ND | 1.1 |
| M4 | ND | 0.8 | ND | 0.8 |
| M6 | ND | 1.2 | ND | 1.2 |
| M7 | ND | ND | 0.2 | 0.2 |
| M8 | ND | 0.6 | 0.9 | 1.5 |
| M9 | 0.4 | 3.0 | ND | 3.0 |
| M10 | ND | 0.2 | ND | 0.2 |
| M11 | ND | 0.05 | 0.02 | 0.07 |
| M12 | ND | 0.07 | 0.08 | 0.2 |
| M13 | ND | 0.07 | ND | 0.07 |
| M14/M15 | 0.6 | ND | ND | ND |
| M16 | 1.8 | ND | ND | ND |
| M19 | ND | ND | 0.01 | 0.01 |
| M20 | ND | ND | 0.02 | 0.02 |
| M21 | ND | ND | 0.01 | 0.01 |
| Cefiderocol | 92.3 | 90.6 | ND | 90.6 |
| Total | 100.0 | 98.2 | 2.9 | 101.1 |
ND, not detected.
Arithmetic mean of pooled sample obtained from each subject is shown.
M14, M15, M16, M17, and M18 are likely to be impurities from the test article.
M1, M5, and M18 were detected only in mass spectrometry analysis.
On the radio‐chromatograms of plasma extracts, cefiderocol was the predominant peak in all 6 subjects and accounted for 92.3% of total radioactivity for plasma AUC as a mean value. Minor peaks including PCBA (M2), M3, M9, M14, M15, and M16 were observed. On the radio‐chromatograms of urine, cefiderocol was the predominant peak for all 6 subjects and accounted for 90.6% of the administered dose as a mean value. Minor peaks including PCBA (M2), M3, M4, M6, M8, M9; cefiderocol‐7‐epi (M10); cefiderocol catechol 3‐methoxy (M11); and cefiderocol catechol 4‐methoxy (M12) and M13 were observed. On the radio‐chromatograms of fecal extracts, PCBA (M2), M7, M8; cefiderocol catechol 3‐methoxy (M11); and cefiderocol catechol 4‐methoxy (M12), M19, M20, and M21 were observed as minor peaks.
Mass Spectrometric Evaluation
All identified or proposed metabolites found in this study are listed in Table 4.
Table 4.
Identified and Proposed Metabolites of Cefiderocol in Plasma, Urine, and Feces
| Metabolite | Retention Time (Minutes) | Proposed Identity | Characteristic Ionsa |
|---|---|---|---|
| M1 | 5.5 | Glucuronide of PCBA |
461 (M + H)+
MS/MS = 214, 285, 390, 443 |
| M2 | 6.0 | PCBA |
285 (M + H)+
MS/MS = 214 |
| M3 | 7.9 | Glucuronide and methylated PCBA |
475 (M + H)+
MS/MS = 228, 299, 404, 441 |
| M4 | 8.2 | Sulfate of PCBA |
365 (M + H)+
MS/MS = 214, 285, 294 |
| M5 | 8.7 | Sulfate and methylated PCBA |
379 (M + H)+
MS/MS = 228, 299 |
| M6 | 8.9 | Glucuronide and methylated PCBA |
475 (M + H)+
MS/MS = 228, 299, 404, 441 |
| M7 | 9.4 | Methylated PCBA |
299 (M + H)+
MS/MS = 228 |
| M8 | 9.9 | Methylated PCBA |
299 (M + H)+
MS/MS = 228 |
| M9 | 10.5 | Sulfate and methylated PCBA |
379 (M + H)+
MS/MS = 228, 299 |
| M10 | 13.8 | Cefiderocol‐7‐epi |
376.7 (1/2M + 1/2H)+
MS/MS = 539, 468, 396, 285, 214 |
| M11 | 14.4 | Cefiderocol catechol 4‐methoxy |
383.7 (1/2M + 1/2H)+
MS/MS = 539, 468, 396, 299, and 228 |
| M12 | 14.8 | Cefiderocol catechol 3‐methoxy |
383.7 (1/2M + 1/2H)+
MS/MS = 539, 468, 396, 299, and 228 |
| Cefiderocol | 13.4 |
376.7 (1/2M + 1/2H)+
MS/MS = 539, 468, 396, 285, 214 |
PCBA, pyrrolidine chlorobenzamide.
The structures of metabolites from M13 to M21 are unidentified.
Tandem mass spectrometry analyses in positive ion mode monitoring nonradiolabeled ions.
The peak considered to be cefiderocol with a retention time of approximately 13.4 minutes has a protonated molecule at m/z 751.8. The retention time and product ion spectrum matched those of the cefiderocol reference standard.
Metabolites M2, M10, M11, and M12 with a retention time of approximately 6.0, 13.8, 14.4, and 14.8 minutes had a protonated molecule at m/z 285, m/z 751.8, m/z 383.7 (as double‐charged ion), and m/z 383.7 (as double‐charged ion), respectively. The retention time and product ion spectrum matched those of the reference standards. Metabolites M2, M10, M11, and M12 were identified as PCBA, cefiderocol‐7‐epi, cefiderocol catechol 4‐methoxy, and cefiderocol catechol 3‐methoxy, respectively.
Metabolite M1, with a retention time of approximately 5.5 minutes, had a protonated molecule at m/z 461, 176 Da greater than that of PCBA (m/z 285). The product ion spectrum of metabolite M1 displayed a base peak at m/z 285, which was formed by the loss of glucuronic acid moiety (176 Da). Metabolite M1 was proposed as a glucuronic acid conjugate of PCBA.
Metabolite M4, with a retention time of approximately 8.2 minutes, had a protonated molecule at m/z 365, 80 Da greater than that of PCBA (m/z 285). The product ion spectrum of M4 displayed a base peak at m/z 285, which was formed by the loss of sulfonic acid moiety (80 Da). Metabolite M4 was proposed as a sulfate of PCBA.
Metabolites M7 and M8, with retention times of approximately 9.4 minutes and 9.9 minutes, respectively, had the same protonated molecule at m/z 299, 14 Da greater than that of PCBA (m/z 285). The product ion spectra of metabolites M7 and M8 were the same and displayed a base peak at m/z 228, which was formed by the loss of pyrrolidine moiety (71 Da). Metabolites M7 and M8 were proposed as 3‐ or 4‐methoxy‐PCBA.
Metabolites M5 and M9, with retention times of approximately 8.7 minutes and 10.5 minutes, respectively, had the same protonated molecule at m/z 379, 80 Da greater than those of M7 and M8 (m/z 299). The product ion spectra of metabolites M5 and M9 were the same and displayed a base peak at m/z 299, which was formed by the loss of sulfonic acid moiety (80 Da). Metabolites M5 and M9 were proposed as sulfates of M7 and M8.
Metabolites M3 and M6, with retention times of approximately 7.9 minutes and 8.9 minutes, respectively, had the same protonated molecule at m/z 475, 176 Da greater than those of M7 and M8 (m/z 299). The product ion spectra of metabolites M3 and M6 were the same and displayed a base peak at m/z 299, which was formed by the loss of glucuronic acid moiety (176 Da), and other peaks at m/z 441, 404, and 228. Metabolites M3 and M6 were proposed as glucuronides of M7 and M8.
The structure of metabolites from M13 to M21 could not be clearly proposed.
Safety and Tolerability
One subject reported a single event of epistaxis, which occurred at approximately 3 hours after dosing and was mild in severity and was considered by the investigator not to be related to study drug. No clinically significant abnormal findings in electrocardiogram parameters, vital sign measurements, or clinical laboratory tests were observed. A single 1000 mg (∼100 μCi) dose of [14C]‐cefiderocol administered by intravenous infusion over 1 hour in healthy adult male subjects was generally safe and well tolerated in this study.
Discussion
The actual mean Cmax and AUC values for cefiderocol were similar to those for total radioactivity. The statistical analysis suggested that the PK parameters were similar between total radioactivity in plasma and cefiderocol in plasma. These results indicate that majority of total radioactivity in plasma accounted for cefiderocol. The result of cefiderocol is similar to cefepime, which is one of the other marketed aminothiazolyl oximino cephalosporins.18
The association of total radioactivity into RBCs was determined and mean partitioning values showed less than zero at the calculable time points and the total radioactivity AUC ratio of whole blood to plasma was similar to the hematocrit values, indicating absence of any partitioning of total radioactivity into RBCs. The absence of any partitioning of total radioactivity into RBCs can explain why the total radioactivity in plasma was approximately 2‐fold higher compared with that in whole blood.
The excretion of total radioactivity was complete in all subjects within 120 hours after initiation of the infusion. The majority of the administered dose was excreted into urine, with 74.6% recovered within 6 hours after initiation of the infusion. This result indicates that cefiderocol‐related material is predominantly and rapidly excreted into urine. In addition, based on the metabolite profiling, cefiderocol accounted for 90.6% of the administered dose in urine, although the other phase 1 studies indicated that 60% to 70% of cefiderocol was excreted unchanged in the urine.15, 16 The plasma exposure to cefiderocol at 1000 mg infused over 60 minutes in these phase 1 studies (GM AUC0‐inf after a single 1000‐mg dose and GM AUC0‐inf normalized to 1000 mg after a single 2000‐mg dose in healthy subjects: 168‐213 μg · h/mL) was comparable to that in the mass balance study (AUC0‐inf, 171.7 μg · h/mL). The GM CL for plasma cefiderocol in this study (4.78 L/h) was similar to those in healthy subjects in the other phase 1 study (4.60‐5.96 L/h).15, 16 The main difference between these studies was bioanalytical methods (HPLC‐flow scintillation analyzer and mass spectrometry in the mass balance study; LC‐MS/MS in other studies). However, it was unknown whether the difference in bioanalytical methods was relevant with the difference in renal excretion between the mass balance study and the other studies or not. The phase 1 studies other than the mass balance study could indicate that renal excretion of unchanged cefiderocol was the primary elimination pathway. The difference in urinary excretion of cefiderocol between mass balance study and the other phase 1 studies remained to be defined; however, the definitive mass balance study demonstrated that >90% of cefiderocol was eliminated in the urine as unchanged drug.
The PK study for the subjects with renal impairment has been already conducted, and the study suggested the need for dose adjustment based on renal function in patients with moderate and severe renal impairment and end‐stage renal disease subjects and the need for a supplemental dose in patients receiving intermittent hemodialysis.16 The mass balance study demonstrated that approximately 90% of the administered dose would be excreted in urine without metabolism. Cefiderocol does not undergo significant hepatic metabolism or significant fecal excretion via biliary excretion, and the systemic clearance of cefiderocol is not expected to be significantly affected by hepatic impairment. Therefore, even if cefiderocol is administered to patients with hepatic impairment, the dose adjustment would be unnecessary.19
From the in vitro metabolite profiling study, there were no human unique metabolites (data not shown). In addition, there were no metabolites showing >4.7% of plasma AUC of total radioactivity. These results indicate that additional nonclinical safety assessment for metabolites of cefiderocol is not needed.20
The structure of cefiderocol is similar to the other marketed aminothiazolyl oximino cephalosporins such as ceftizoxime, cefotaxime, cefepime, and ceftazidime except for the C‐3 side chain with pyrrolidine linked to catechol moiety. It is known that ceftizoxime, which is an aminothiazolyl oximino cephalosporin without C‐3 side chain moiety, is mainly excreted in the urine as unchanged drug at an excretion rate of approximately 80% of dose in the 6‐hour urine after dosing.21 It is known that N‐methyl pyrrolidine moiety, which is a C‐3 side chain of cefepime, is cleaved and detected in human and rat urine.18, 22 It is a common practice to radiolabel the compound at a chemically and metabolically stable position; however, the radiolabeled position of cefiderocol was in catechol moiety at the C‐3 side chain because the disposition of an aminothiazolyl oximino cephalosporin such as ceftizoxime is well characterized and the catechol moiety was a unique structure for cefiderocol in the aminothiazolyl oximino cephalosporins. After a single intravenous administration of [14C]‐cefiderocol, a total of 21 cefiderocol‐related components (M1 to M21) were detected in plasma, urine, or feces. The metabolic pathways elucidated for cefiderocol include N‐dealkylation, epimerization, methylation, glucuronidation, and sulfation, and some PCBA‐related metabolites were also detected. However, these metabolic pathways for cefiderocol were minor routes of elimination.
Conclusions
The radioactivity in plasma is suggested to be associated with intact cefiderocol, and cefiderocol accounted for >92% of plasma AUC of total radioactivity. The partitioning of total radioactivity into RBCs was negligible. The majority of administered radioactivity was excreted into urine (99% of administered dose), and fecal excretion of total radioactivity was negligible. This study indicates that cefiderocol and drug‐related material did not remain in the body. Cefiderocol was primarily excreted as unchanged drug in urine (>90% of administered dose). The metabolic pathways for cefiderocol were minor elimination routes. Intravenous administration of a single 1000‐mg (∼100‐μCi) dose of [14C]‐cefiderocol infused over 1 hour in healthy adult male subjects was generally safe and well tolerated.
Funding
This study was funded by Shionogi Inc.
Conflicts of Interest
SM, TK, and YN are employees of Shionogi. HS conducted metabolite profiling in this research at QPS, LLC in the course of her employment, and her employers were compensated by Shionogi for conducting this study. CT conducted this research at Celerion (Lincoln, Nebraska) in the course of his employment, and his employers were compensated by Shionogi for conducting this study.
Acknowledgments
The authors thank Demetrias Carnegia, Christine Tsai, and Elizabeth Migoya of Shionogi Inc. (Florham Park, New Jersey) for management of this study; Takushi Kanazu and Tomoko Sasaki of Shionogi & Co., Ltd. (Osaka, Japan) for manuscript preparation; Ronghua Wang of QPS, LLC (Newark, Delaware) for reviewing the metabolite profiling section; and Yoshihisa Ozaki of Shionogi & Co., Ltd. and Kenneth Hawke of QPS, LLC for reviewing the bioanalysis section.
Data Accessibility
This study was not registered in a public database (ie, clinicaltrials.gov).
References
- 1. Ito A, Kohira N, Bouchillon SK, et al. In vitro antimicrobial activity of S‐649266, a catechol‐substituted siderophore cephalosporin, when tested against non‐fermenting Gram‐negative bacteria. J Antimicrob Chemother. 2016;71(3):670‐677. [DOI] [PubMed] [Google Scholar]
- 2. Kohira N, West J, Ito A, et al. In vitro antimicrobial activity of a siderophore cephalosporin, S‐649266, against Enterobacteriaceae clinical isolates, including carbapenem‐resistant strains. Antimicrob Agents Chemother. 2016;60(2):729‐734. [DOI] [PMC free article] [PubMed] [Google Scholar]
- 3. Nakamura R, Toba S, Tsuji M, et al. S‐649266, novel siderophore cephalosporin: IV. In vivo efficacy in various murine infection models. Presented at the 54th Intersci Conf Antimicrob Agents Chemother (ICAAC 2014); September 5‐9, 2014; Washington, DC. Poster F‐1558.
- 4. Ghazi IM, Monogue ML, Tsuji M, and Nicolau DP. Pharmacodynamics of cefiderocol, a novel siderophore cephalosporin, in a Pseudomonas aeruginosa neutropenic murine thigh model. Int J Antimicrob Agents. 2017;51(2):206‐212. [DOI] [PubMed] [Google Scholar]
- 5. Matsumoto S, Singley CM, Hoover J, et al. Efficacy of cefiderocol against carbapenem‐resistant Gram‐negative bacilli in immunocompetent‐rat respiratory tract infection models recreating human plasma pharmacokinetics. Antimicrob Agents Chemother. 2017;61(9):e00700‐e00717. [DOI] [PMC free article] [PubMed] [Google Scholar]
- 6. Foley T, Simeonov A. Targeting iron assimilation to develop new antibacterials. Expert Opin Drug Discov. 2012;7(9):831‐847. [DOI] [PMC free article] [PubMed] [Google Scholar]
- 7. Kim A, Kutschke A, Ehmann DE, et al. Pharmacodynamic profiling of a siderophore‐conjugated monocarbam in Pseudomonas aeruginosa: assessing the risk for resistance and attenuated efficacy. Antimicrob Agents Chemother. 2015;59(12):7743‐7752. [DOI] [PMC free article] [PubMed] [Google Scholar]
- 8. Tomaras AP, Crandon JL, McPherson CJ, et al. Adaptation‐based resistance to siderophore‐conjugated antibacterial agents by Pseudomonas aeruginosa . Antimicrob Agents Chemother. 2013;57(9):4197‐4207. [DOI] [PMC free article] [PubMed] [Google Scholar]
- 9. Tomaras AP, Crandon JL, McPherson CJ, Nicolau DP. Potentiation of antibacterial activity of the MB‐1 siderophore‐monobactam conjugate using an efflux pump inhibitor. Antimicrob Agents Chemother. 2015;59(4):2439‐2442. [DOI] [PMC free article] [PubMed] [Google Scholar]
- 10. Ito A, Nishikawa T, Matsumoto S, et al. Siderophore cephalosporin cefiderocol utilizes ferric iron transporter systems for antibacterial activity against Pseudomonas aeruginosa . Antimicrob Agents Chemother. 2016;60(12):7396‐7401. [DOI] [PMC free article] [PubMed] [Google Scholar]
- 11. Gorska A, Sloderbach A, Marszaff MP. Siderophore‐drug complexes: potential medicinal applications of the “Trojan horse” strategy. Trends Pharmacol Sci. 2014;35(9):442‐449. [DOI] [PubMed] [Google Scholar]
- 12. Tillotson GS. Trojan horse antibiotics—a novel way to circumvent Gram‐negative bacterial resistance? Infect Dis Res Treatment. 2016;9:45‐52. [DOI] [PMC free article] [PubMed] [Google Scholar]
- 13. Ito A, Sato T, Ota M, et al. In vitro antibacterial properties of cefiderocol, a novel siderophore cephalosporin, against Gram‐negative bacteria. Antimicrob Agents Chemother. 2018;62(1):e01454‐17. [DOI] [PMC free article] [PubMed] [Google Scholar]
- 14. Ito‐Horiyama T, Ishii Y, Ito A, et al. Stability of novel siderophore cephalosporin S‐649266 against clinically relevant carbapenemases. Antimicrob Agents Chemother. 2016;60(7):4384‐4386. [DOI] [PMC free article] [PubMed] [Google Scholar]
- 15. Saisho Y, Katsube T, White S, Fukase H, Shimada J. Pharmacokinetics, safety, and tolerability of cefiderocol, a novel siderophore cephalosporin for Gram‐negative bacteria, in healthy subjects. Antimicrob Agents Chemother. 2018;62(3):e02163‐17. [DOI] [PMC free article] [PubMed] [Google Scholar]
- 16. Katsube T, Echols R, Arjona Ferreira JC, Krenz HK, Berg JK, Galloway C. Cefiderocol, a siderophore cephalosporin for Gram‐negative bacterial infections: pharmacokinetics and safety in subjects with renal impairment. J Clin Pharmacol. 2017;57(5):584‐591. [DOI] [PMC free article] [PubMed] [Google Scholar]
- 17. Hop CE, Wang Z, Chen Q, Kwei G. Plasma‐pooling methods to increase throughput for in vivo pharmacokinetic screening. J Pharm. Sci. 1998;87(7):901‐903. [DOI] [PubMed] [Google Scholar]
- 18. Barbhaiya RH, Knupp CA, Forgue ST, et al. Disposition of the cephalosporin cefepime in normal and renally impaired subjects. Drug Metab Dispos. 1991;19(1):68‐73. [PubMed] [Google Scholar]
- 19. FDA Guidance : Pharmacokinetics in patients with impaired hepatic function: study design, data analysis, and impact on dosing and labeling. May 2003.
- 20. International Conference on Harmonisation (ICH) M3(R2) . Guidance on nonclinical safety studies for the conduct of human clinical trials and marketing authorization for pharmaceuticals, Step 5, June 2009. [PubMed]
- 21. Ohkawa M, Okasho A, Sugata T, Kuroda K. Elimination kinetics of ceftizoxime in humans with and without renal insufficiency. Antimicrob Agents Chemother. 1982;22(2):308‐311. [DOI] [PMC free article] [PubMed] [Google Scholar]
- 22. Forgue ST, Kari P, Barbhaiya R. N‐oxidation of N‐methylpyrrolidine released in vivo from cefepime. Drug Metab Dispos. 1987;15(6):808‐815. [PubMed] [Google Scholar]