

Abstract
Bacteria are known to display extensive metabolic diversity and many studies have shown that they can use an extensive repertoire of small molecules as carbon‐ and energy sources. However, it is less clear to what extent a bacterium can expand its existing metabolic capabilities by acquiring mutations that, for example, rewire its metabolic pathways. To investigate this capability and potential for evolution of novel phenotypes, we sampled large populations of mutagenized Salmonella enterica to select very rare mutants that can grow on minimal media containing 124 low molecular weight compounds as sole carbon sources. We found mutants growing on 18 of these novel carbon sources, and identified the causal mutations that allowed growth for four of them. Mutations that relieve physiological constraints or increase expression of existing pathways were found to be important contributors to the novel phenotypes. For the remaining 14 novel phenotypes, whole genome sequencing of independent mutants and genetic analysis suggested that these novel metabolic phenotypes result from a combination of multiple mutations. This work, by virtue of identifying the genetic and mechanistic basis for new metabolic capabilities, sheds light on the properties of adaptive landscapes underlying the evolution of novel phenotypes.
Keywords: Carbon sources, experimental evolution, new metabolic functions, novel phenotypes
Evolution of novel phenotypes is one of the central questions in evolutionary biology, playing a key role in major evolutionary transitions (Wong 1991; Szathmary and Smith 1995). These have been associated with ecological diversification (Blount et al. 2008; Wood and Erwin 2018) and with adaptive radiations (Warheit et al. 1999). An understanding of the mechanistic and genetic basis for the evolution of such novel functions, as well as of the associated trade‐offs, would give insights about the characteristics of the adaptive landscapes for these major transitions. To address this question, we used an experimental design to comprehensively explore the evolutionary potential for novel metabolic capabilities in a model organism, Salmonella enterica serovar Typhimurium strain LT2 (designated S. Typhimurium throughout the text), to utilize 124 different carbon compounds as sole carbon source (Fig. 1).
Figure 1.

Selection of mutants with novel metabolic functions. An inducible error prone polymerase was used to increase the mutation rate of the ancestral Salmonella Typhimurium LT2 strain. The mutagenized population was spread on agar plates containing each of 124 novel carbon compounds. Mutants were selected, whole genome sequenced and causal mutations were identified. Fitness trade‐offs caused by the novel phenotypes were measured.
Microorganisms exhibit diverse metabolic functions (Barberán et al. 2014; Gilbert et al. 2014; Manoharan, et al. 2015; Anantharaman et al. 2016; Locey and Lennon 2016), where the interconnectedness of different biochemical pathways (Bhattacharya et al. 2003; Nielsen 2003; Fani and Fondi 2009) as well as secondary (promiscuous) activities of existing enzymes (Copley 2003; Nobeli et al. 2009; Khersonsky and Tawfik 2010) further increases an organism's metabolic repertoire. The underlying genetic architecture generating this complexity in biochemical pathways and functions has been well appreciated (Tavazoie et al. 1999; Jeong et al. 2000; Ravasz et al. 2002; Patil and Nielsen 2005; Deutscher et al. 2006). However, one outstanding question regarding these extensive biochemical pathways is how they can act as a source for the evolution of novel functions. The evolutionary potential of these metabolic pathways dictates the ability of these microorganisms to colonize new habitats and extend their ecological niches. This question has been important not only in the fields of ecology and evolution (Brown et al. 2004; Valentine 2007; Kearney et al. 2010; Wiedenbeck and Cohan 2011), but also in medical sciences, where it is important to understand how pathogens can acquire new mutations to colonize new niches within the human host (Sokurenko et al. 1999; Eisenreich et al. 2010; Bianconi et al. 2011; Rohmer et al. 2011; Fuchs et al. 2012).
The evolutionary potential to acquire novel metabolic functions depends not only upon the metabolic pathways present, but also on physiological constraints and functional trade‐offs that accompany these new phenotypes. By themselves, the study of constraints and trade‐offs accompanying adaptive evolution has been central in the field of evolutionary biology, both in eukaryotes (Mitchell‐Olds 1996; Etterson and Shaw 2001; Ghalambor et al. 2004; Shoval et al 2012) and in eubacteria (Mongold et al. 1996; Bohannan et al. 2002; Craig MacLean 2005; Duffy et al. 2006; Gudelj et al. 2007). A large number of studies have pointed out how these constraints and trade‐offs can limit the spectrum of adaptive mutations and evolutionary trajectories (Weinreich et al. 2005; Weinreich et al. 2006; Kvitek and Sherlock 2011; Salverda et al. 2011; Ito and Sasaki 2016). However, studies associating these constraints and trade‐offs with the evolution of novel phenotypes are limited (Downs 2006; Copley 2012; Chubiz and Marx 2017).
Another important, yet less observed scenario in the evolution of novel phenotypes, or generally during adaptive evolution, is when evolution proceeds by selection of those mutations that result in the disentangling of physiological constraints. Physiological constraints are here defined as the limitation to observe a given phenotype due to the underlying genetic organization or the interconnectedness of multiple phenotypes (Lande 1979; McDonald et al. 2009). Removal of these constraints becomes an important evolutionary route especially for novel metabolic functions since metabolic pathways are highly interconnected, with different metabolites effecting the regulation and functional state of any given protein. Despite this, one of the primary reasons for the limited evidence for such disentangling might be that this interconnectedness results in a limited number of possibilities to remove this constraint. As a result, our understanding of how mutations that get rid of these constraints can act as sources of novel phenotypes is also limited.
In this study, we generated mutagenized populations of S. Typhimurium and tested the ability of this mutagenized population to grow on 124 compounds that do not act as carbon source for this bacterium (Gutnick et al. 1969). Previous studies have generally explored the ability of native enzymes to perform novel metabolic activities across different organisms (Parker and Hall 1990; Hall 1999, 2003). Some early examples of these studies include the ability of Escherichia coli to metabolize cellobiose through mutations in the cel operon (Parker and Hall 1990), the ability of a E. coli with a deletion in the lac operon to metabolize lactose through mutations in the ebg operon (Hall 1999, 2003), the ability of Klebsiella pneumoniae to metabolize xylitol through mutations in the ribitol pathway (Mortlock and Wood 1971; Rigby et al. 1974), and the ability of Pseudomonas aeruginosa to metabolize butyramide through mutations in the aliphatic amidase pathway (Brown et al. 1969).
Our results show that S. Typhimurium acquired the ability to grow on a normally nonutilizable carbon source for at least 14% (18/124) of the compounds tested. We identified the causal mutations for four of these novel phenotypes and showed that mutations resulting in regulatory changes and which relieved physiological constraints contributed to the evolution of novel phenotypes.
Materials and Methods
MUTAGENESIS APPROACH AND CARBON COMPOUNDS USED
S. Typhimurium containing the pSMP24 (pBAD::dinB Maisnier‐Patin et al. 2005) plasmid was used as the starting strain for these experiments. The pSMP24 plasmid carries the error prone DNA IV polymerase under the control of a L‐arabinose inducible promoter. From an overnight culture, 103 cells were used to start each of ten 25 mL cultures. The media used for these ten cultures was Lysogeny broth (LB) with 0.05% L‐arabinose. After an overnight growth, each of these 25 mL cultures were washed thrice with phosphate‐buffered saline (PBS) and were re‐suspended in 5 mL of PBS. Hundred microliter of this bacterial suspension (corresponding to about 2.5 × 10⁹ cells) was then spread on minimal media plates containing different carbon compounds as the sole carbon source (10 plates for each carbon source). The list of carbon compounds used was based on earlier work done by Gutnik et al. (1969). A total of 124 carbon compounds (Table S1) was used at two different concentrations (0.1% and 1% [w/v]). Fluctuation tests were performed using selection for rifampicin resistance as a proxy to measure the increase in mutation rate caused by the error prone polymerase (Table S2). Plates were incubated for 2–4 weeks at 37°C, and were checked for growth every 7 days.
P22 TRANSDUCTION AND ISOLATION OF MUTATIONS CONFERRING NOVEL METABOLIC FUNCTIONS
To identify single mutations that caused the novel phenotypes a P22 transduction protocol was used. P22 lysate was generated on each of the clones that were able to use a novel carbon compound as a sole carbon source in minimal media. Lysates were generated by mixing 1 mL of P22 stock (∼1 × 10⁶ pfu/mL) and 200 μL of overnight grown donor strain in a 10 mL tube, which was then incubated overnight with shaking at 37°C. The next day 100 μL of chloroform was used to kill surviving cells, after which the mixture was spun down, and the supernatant was used as the lysate. To obtain transductants, 1 μL of this lysate was mixed with 100 μL of overnight grown wild‐type S. Typhimurium strain and incubated with shaking at 37°C for 30 minutes. The mixture was then washed with PBS twice and then plated on minimal media plates with the appropriate carbon sources. Plates were generally incubated for 2–4 weeks. Control plates with nontransduced wild‐type S. Typhimurium cells and P22 lysate alone were also plated individually. P22‐free transductants were identified by streaking on Evans Blue Uranine (EBU) plates.
WHOLE GENOME SEQUENCING AND SEQUENCE ANALYSIS
Mutations that could contribute to the novel phenotypes were identified by whole genome sequencing. DNA was extracted from 1 mL overnight cultures using the MasterPure Complete DNA & RNA Putification Kit (Epicentre) according to the manufacturer's instructions. Illumina's Nextera XT kit was used to make libraries (2 × 300) to be sequenced with Miseq. Samples were dual‐indexed and pooled together. Average whole genome coverage per sample was 30X. Analysis of the fastq files obtained from Miseq sequencing was performed using CLC genomics Workbench version 8 and were mapped to the reference genome of the ancestral S. Typhimurium strain. SNP calling and structural rearrangements were both assessed using this tool.
MEASUREMENT OF EXPONENTIAL GROWTH RATES AND FITNESS TRADE‐OFFS
To determine fitness trade‐offs for mutants able to grow on L‐isoleucine and L‐threonine as the sole carbon source, exponential growth rates were measured using a BioscreenC analyzer at OD600, with measurements taken every 4 minutes. KaleidaGraph software was used to calculate the maximum exponential growth rate from the OD600 data, using the optical density (OD) values between 0.02 and 0.09. Overnight cultures were diluted 1:1000 fold in appropriate media. Growth rates for mutants able to grow on L‐isoleucine as sole carbon source was measured on minimal media containing 0.2% of different carbon sources (acetate, glycerol, citrate, or glucose). Growth rates for mutants able to grow on L‐threonine as sole carbon source was measured on 0.1% glucose minimal media, with and without 0.1% L‐threonine or 0.1% L‐leucine. For each clone, measurements were performed on four biological replicates. In each run, the exponential growth rate for the ancestral strain was also measured. Relative exponential growth rate was calculated as the ratio between the exponential growth rate of the clone and that of the ancestral strain. Error bars represent standard deviation. Two‐tailed Student's t‐test was performed to calculate significance.
qPCR MEASUREMENTS OF EXPRESSION OF GENES INVOLVED IN THE ISOLEUCINE BIOSYNTHESIS PATHWAY AND GENES FROM THE THREONINE DEGRADATION PATHWAY
For qPCR, cells were grown to OD600 = 0.3 (measured with 1 cm light path in a Shimadzu UV mini 1240 spectrophotometer) in 10 mL of either 0.1% glucose M9‐minimal media, 0.1% glucose M9‐minimal media supplemented with 0.1% of L‐isoleucine, or 0.1% glucose M9‐minimal media supplemented with 0.1% of L‐threonine. RNA was extracted from 500 μL of the cultures, using the RNeasy Mini Kit (Qiagen) as per the manufacturer's protocol, and DNase treated using the Turbo DNA‐free kit (Ambion) according to the manufacturer's protocol. The DNA‐free RNA was run on a 1% (w/v) agarose gel for visual inspection. Five hundred nanograms of RNA (quantified using the Qubit RNA BR assay kit) was used for cDNA preparation using the High Capacity Reverse Transcription Kit (Applied Biosystems). RT‐qPCRs were performed using the PerfecTa Sybr Green SuperMix (Quanta Biosciences). The house keeping genes used as references were cysG and hcaT. Three biological replicates and three technical replicates were used in each case. The averages are based on biological replicates. Error bars represent standard deviation. Two‐tailed Students‐t test was performed to test for statistically significant differences.
Results
SELECTION OF S. TYPHIMURIUM MUTANTS THAT CAN GROW ON NORMALLY NONUTILIZABLE CARBON SOURCES
The potential carbon sources used for selection in our study were a subset of the list generated by Gutnik et al. (1969). Out of the 600 compounds tested in that study, we selected those carbon sources that did not contain phosphate groups and were not polymers with the reasoning that they might be poorly taken up by bacterial cells. In total, we chose 124 compounds that were previously shown to not act as carbon sources for S. Typhimurium (Table S1), and two concentrations of the carbon source (0.1% and 1%) were used for the selection experiment. A wild‐type S. Typhimurium strain was transformed with a plasmid that carried the L‐arabinose inducible error prone polymerase DinB (pSMP24), and was used as the ancestral strain in our experiments. Presence of an inducible DinB allowed us to increase the mutation rate by 400‐fold (Maisnier‐Patin et al. 2005) and hence sample greater genetic variation. We then performed the selection with ∼1010 bacteria per concentration of each compound. Mutants able to grow on 18 carbon sources were obtained (Table S1, Fig. 1). Broadly these 18 carbon sources can be divided into six different classes: amino acids (7), monosaccharides (6), sugar alcohols (3), disaccharides (1), and a ketoacid (1).
WHOLE GENOME ANALYSIS AND IDENTIFICATION OF CAUSAL MUTATIONS THAT ALLOW GROWTH ON NOVEL CARBON SOURCES
Given the DinB‐mutagenesis approach that was used to generate mutants with novel phenotypes, we expected that each mutant contained several mutations. Thus, to identify the causal mutation allowing growth on the novel carbon source, a P22 transduction protocol was used. For the P22 transduction experiments, lysates were generated on each mutant, which was then used for transduction of the ancestral S. Typhimurium strain. Transductants were selected on appropriate carbon sources and mutants that grew were candidates for having received the causal mutation. Whole genome sequencing of the transductants was performed that allowed us to identify the responsible mutations in four out of the 18 mutants (Table 1). Mutations identified by this method involved mutations in gene celD (allowing for growth on D‐cellobiose as sole carbon source), mutations in gene ilvN (allowing for growth on L‐isoleucine as sole carbon source), mutations in genes lrp and kbl (allowing for growth on L‐threonine as sole carbon source) and fucR (allowing for growth on D‐arabinose as sole carbon source) (Table 1).
Table 1.
Causal mutations for growth on new carbon sources
| Strain | Novel carbon source supporting growth | Gene causing novel phenotype | Amino acid change/mutation |
|---|---|---|---|
| A56875 | D‐cellobiose | celD | N238S |
| DA58010 | L‐isoleucine | ilvN | N35K |
| DA58011* | D‐arabinose | fucR | S75R |
| DA62190 | L‐threonine | lrp | A63E |
| DA62191 | L‐threonine | kbl | –60 G>A |
Causal mutations allowing growth on novel carbon sources were identified by a P22 transduction protocol and by whole genome sequence analysis.
*only locally sequenced at the fucR gene.
Whole genome sequencing was also performed on mutants that were able to grow on four different carbon sources, but where P22 transductions did not produce any recombinants capable of growth. These included the carbon sources L‐valine (one mutant), 2‐Deoxy‐D‐glucose (three mutants), D‐adonitol (one mutant), and D‐erythrose (two mutants) (Table S3). In a majority of these mutants, we observed at least nine nonsynonymous mutations suggesting that multiple mutations are required to generate the new phenotype (which was also supported by the fact that no transductants that could grow on the novel carbon sources were obtained). In cases where more than one independent mutant was sequenced for a given carbon source (2‐Deoxy‐D‐glucose and D‐erythrose), there was also no overlap with regards to, which genes had mutations, nor any overlap in the biochemical pathways that these genes belonged to; indicating that for these carbon sources multiple mutational pathways exists that allow generation of the novel phenotype (Table S3). For mutants growing on L‐valine and D‐adonitol as the sole carbon source, whole genome sequencing did not reveal any obvious targets.
Mutants able to metabolize D‐cellobiose as the sole carbon source had mutations in the transcriptional regulator celD, which is homologous to the celR transcriptional regulator of the cryptic cel operon in E. coli. Besides the mutation that we obtained by the P22 transduction strategy (celD Asn238Ser), whole genome sequencing of other mutants that could utilize D‐cellobiose revealed several different mutations in gene celD that could potentially result in growth of the mutant on D‐cellobiose as sole carbon source (Table S4). Mutants able to metabolize D‐arabinose had a mutation in the transcriptional regulator fucR. Mutations in this gene results in D‐arabinose to act as an inducer for the L‐fucose degradation pathway. Expression of enzymes from this pathway allows for utilization of D‐arabinose as the sole carbon source (Zhu and Lin 1986). Since mutations in both these genes and the underlying mechanisms generating the novel phenotypes have been described earlier (Zhu and Lin 1986; Parker and Hall 1990), they will not be discussed further here.
MUTATIONS in ilvN ALLOWS FOR USAGE OF L‐ISOLEUCINE AS SOLE CARBON SOURCE BY REMOVAL OF A PHYSIOLOGICAL CONSTRAINT
Mutants that grew on L‐isoleucine as sole carbon source had mutations in the ilvN gene. Two unique mutations were observed: N35K and V36A. ilvN and ilvB encode the two subunits of acetolactate synthase 1, one of the three isozymes that catalyze the second step of L‐isoleucine biosynthesis and the first step of L‐valine and L‐leucine biosynthesis (Fig. 2A). Both the mutations found in the IlvN protein are in positions that have been predicted to interact with L‐valine for feed‐back inhibition of the biosynthetic pathway (Kaplun et al. 2006). It is thus likely that these mutations affect the interaction of IlvN with L‐isoleucine as well. We hypothesized that the amino acid substitutions in IlvN either lead to loss of feed‐back inhibition (at the level of translation) by L‐isoleucine, preventing the starvation of the cells for L‐valine and L‐leucine, or results in an increased expression of genes in the L‐isoleucine degradation pathway (Fig. 2A). The isoleucine degradation pathway allows for the conversion of L‐isoleucine to acetyl‐CoA that can be channeled into other metabolic pathways.
Figure 2.
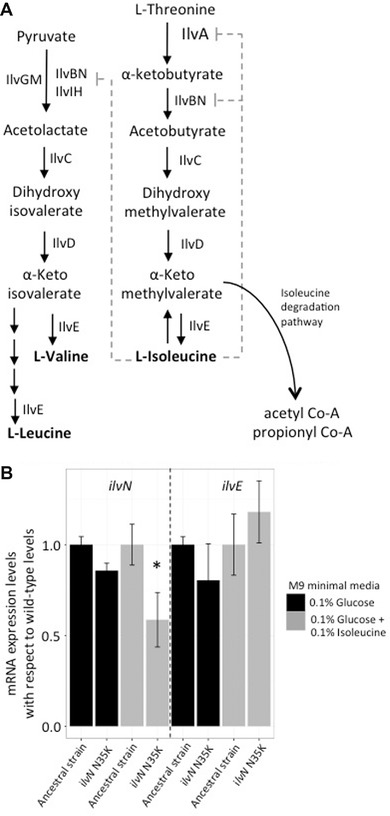
Utilization of L‐isoleucine as sole carbon source. (A) Common enzymes involved in biosynthesis of L‐isoleucine, L‐leucine and L‐valine: Pathway showing common enzymes for synthesis of branched chain amino acids L‐isoleucine, L‐valine, and L‐leucine. All amino acids exert feedback inhibition on these common enzymes. Isoleucine can also enter the isoleucine degradation pathway. (B) Gene expression analysis for genes in ilvN and ilvE: qPCR measurements of genes ilvN and ilvE in wild‐type ancestral strain and the IlvN N35K mutant in different media (shown as different colored bars). The values are normalized to the expression levels observed in the wild‐type strain when grown in the respective media. Error bars represent standard deviation. Two‐tailed Student's t test was used to calculate significant differences (denoted by * when applicable). No difference was observed in expression level of ilvE gene in different media conditions.
To differentiate between these two hypotheses, we measured the expression levels of the ilvN and ilvE genes in the wild‐type strain and the ilvN N35K mutant, in 0.1% glucose minimal media and in 0.1% glucose minimal media with 0.1% isoleucine (Fig. 2B). The ilvE gene is responsible for the last step of isoleucine/valine/leucine biosynthesis as well as the first step of the isoleucine degradation pathway. No difference between the expression levels of ilvE in the wild‐type strain or the ilvN N35K mutant was observed (Fig. 2B), supporting the hypothesis that utilizing L‐isoleucine as carbon source only requires the cell to overcome valine and/or leucine starvation. To further demonstrate that excess L‐isoleucine causes L‐valine starvation, and that this starvation is removed in the ilvN N35K mutant, we measured growth rates of wild‐type and the ilvN N35K mutant under three different growth conditions: minimal media with 0.1% glucose, minimal media with 0.1% glucose and 0.1% isoleucine and minimal media with 0.1% glucose and 0.1% each of L‐valine, L‐leucine, and L‐isoleucine. As expected the growth rate of the wild‐type strain was lower in the environment where only L‐isoleucine was present, but no reduction was seen for the ilvN N35K mutant in this media (Fig. 3). Also, this reduction was no longer seen for the wild‐type strain or the mutant strain in the presence of L‐valine, L‐isoleucine, and L‐leucine (Fig. 3). These results demonstrate an example of evolution of a new phenotype by means of overcoming a physiological and regulatory constraint.
Figure 3.

Isoleucine toxicity and rescue of ancestral strain in presence of valine/leucine. Relative exponential growth rates of the llvN N35K mutant compared to the wild‐type strain in different media: 0.1% minimal glucose media, 0.1% minimal glucose media with 0.1% isoleucine and 0.1% minimal glucose media with 0.1% each of isoleucine, valine, and leucine. Error bars represent standard deviation. Two‐tailed Student's t test was used to calculate significant differences at P < 0.01 (denoted by * when applicable).
MUTATIONS IN THE GENE lrp AND UPSTREAM OF GENE kbI INDIVIDUALLY ALLOW UTILIZATION OF L‐threonine AS SOLE CARBON SOURCE BY INCREASING THE FLUX THROUGH THE L‐threonine DEGRADATION PATHWAY
Mutations affecting two different genes allowed for growth on L‐threonine as sole carbon source. The first mutation was seen in gene lrp resulting in a nonsynonymous change (A63E; Fig. 4A). The Lrp protein is a transcriptional regulator that induces the expression of genes belonging to the L‐threonine degradation pathway. Mutations in lrp could thus potentially result in increased expression of enzymes from this pathway, allowing for sufficient amounts of acetyl‐CoA to be produced for cell‐growth. Increased expression of enzymes from this pathway has been shown to allow usage of L‐threonine as a sole carbon source in E. coli (Chan and Newman 1981). The second mutation that allows growth on L‐threonine as sole carbon source was observed upstream of gene kbl (–60 G>A) in the –35 element of the promoter. The product of this gene catalyzes the second step of threonine dehydrogenase mediated threonine degradation pathway. Consequently, the observed upstream mutation in this gene could also act by increasing the expression of genes involved in threonine degradation pathway (Fig. 4A). Whole genome sequencing was also performed on other mutants that could grow on L‐threonine as a sole carbon source. Mutants with different mutations upstream of gene kbl were identified (Fig. 4A). Besides the mutation observed in the –35 element of the promoter, two other mutations upstream of the gene kbl were observed in LRP‐binding sites.
Figure 4.
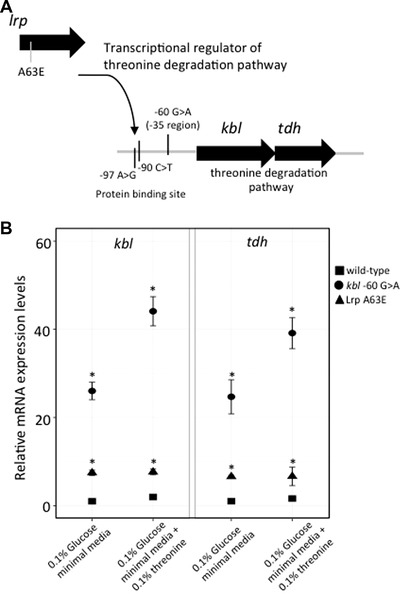
Mutations allowing utilization of L‐threonine as sole carbon source. (A) Mutations in lrp and upstream of kbl allowing utilization of L‐threonine as sole carbon source. (B) Gene expression analysis for genes kbl and tdh from threonine degradation pathway: qPCR measurements of genes kbl and tdh in Lrp A63E and kbl ‐60 G>A mutants in different media. The values are normalized to the expression levels observed in the wild‐type strain when grown in 0.1% glucose M9‐minimal media. Error bars represent standard deviation. Two‐tailed Student's t test was used to calculate significant differences at P < 0.01 (denoted by * when applicable).
Thus, it is likely that these mutations allow usage of L‐threonine as a sole carbon source by increasing the flux through the threonine degradation pathway. We supported this hypothesis by measuring mRNA expression levels for genes kbl and tdh (that are part of the threonine degradation pathway) in both the lrp A63E and kbl –60 G>A mutants. Expression levels were measured in 0.1% glucose M9‐minimal media, and in 0.1% glucose M9‐minimal media supplemented with 0.1% L‐threonine. In both environments upregulation of these genes was observed, as compared to the expression levels in the wild‐type strain (Fig. 4B). The upregulation observed for the lrp A63E mutant was similar across both the environments (∼7X). The upregulation in the kbl –60 G>A mutant was higher as compared to the lrp A63E mutant in 0.1% glucose minimal media (∼24X), which further increased in the presence of 0.1% L‐threonine (∼40X).
FITNESS TRADE‐OFFS BETWEEN NOVEL AND ANCESTRAL FUNCTION OF ilvN, lrp, AND kbl
To elucidate whether the ability to utilize a new carbon source was associated with a loss of the ancestral function, we measured exponential rates for mutants that grew either on L‐isoleucine or L‐threonine as a sole carbon source. It has been demonstrated that the ilvBN system is essential for growth on poor carbon sources (deletion of this system results in inability to grow), and under these conditions it becomes the important route for isoleucine biosynthesis (Dailey and Cronan 1986). To test if this function was compromised in the IlvN N35K mutant, we measured growth rates of the mutant on minimal media with glucose, acetate, glycerol, or citrate as sole carbon sources (Fig. 5). Our results demonstrate that the mutation N35K has drastic effects on the native function of IlvN, as shown by its inability to grow on both acetate and citrate as sole carbon source. However, no effect on growth rate was observed in minimal media with glycerol as sole carbon source.
Figure 5.
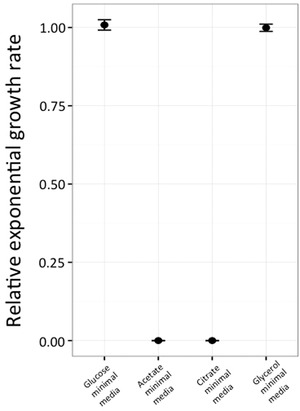
Relative exponential growth rates for llvN N35K mutant on alternate native carbon sources. Exponential growth rates of the mutants were measured and normalized with respect to growth rate of wild‐type strain in minimal media containing 0.2% of different carbon sources (glucose, acetate, citrate, or glycerol).
The Lrp protein is a leucine‐responsive regulatory protein that senses leucine concentration in the environment and regulates genes involved in feast‐famine functions (Tani et al. 2002). To investigate if the amino acid change A63E in Lrp that confers a novel phenotype of utilizing L‐threonine as sole carbon source results in functional trade‐offs, growth rates for this mutant was measured in glucose minimal media, and in glucose minimal media supplemented with either 0.1% leucine or 0.1% threonine. Under all three conditions, a reduction of growth rate (30–40% across the different media) was observed for the mutant as compared to the ancestral strain (Fig. 6).
Figure 6.
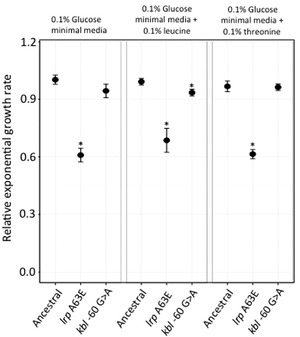
Fitness trade‐offs observed in Lrp A63E and kbl ‐60 G>A mutants under different growth conditions. Relative exponential growth rate for Lrp A63E and kbl ‐60 G>A mutants, with respect to the wild‐type strain, measured in different media: 0.1% minimal glucose media, 0.1% minimal glucose media with 0.1% threonine and 0.1% minimal glucose media with 0.1% leucine. Two‐tailed Student's t test was used to calculate significant differences at P < 0.01 (denoted by * when applicable).
Multiple mutations were also observed in the promoter region of gene kbl, which catalyzes the second step in the threonine degradation pathway. To investigate if these mutations caused trade‐offs in alternate environments, a P22 transductant with only the mutation at –60 G>A position in the promoter region was chosen and growth rates were measured in three different environments: glucose minimal media, and in 0.1% glucose minimal media supplemented with 0.1% L‐leucine or 0.1% L‐threonine. A reduction of growth rate for the kbl –60 G>A mutant, as compared to the wild‐type strain, was observed in glucose minimal media supplemented with 0.1% L‐leucine (P = 0.0037). In glucose minimal media only a small reduction in growth rate for the mutant was observed with respect to the wild‐type strain (P = 0.032), while no difference was observed in glucose minimal media supplemented with 0.1% L‐threonine (Fig. 6).
Discussion
DIFFERENT MUTATIONAL TRAJECTORIES RESULT IN GAIN OF NOVEL METABOLIC FUNCTIONS
Our experimental design allowed us to ask if and how an organism can mutationally gain new metabolic functions to utilize new resources, and thus contributes to our understanding of adaptive landscapes for novel phenotypes. The mutagenesis approach combined with the large population sampling size allowed us to test every single SNP in the genome and a fraction of combinations of SNPs for their ability to allow growth on novel carbon sources. We found that S. Typhimurium could metabolize as much as 14% (18/124) of the compounds tested and for four different compounds (D‐cellobiose, L‐isoleucine, L‐threonine, and D‐arabinose) we could identify single mutations that conferred the novel phenotype. In the remaining cases, for two different carbon sources (2‐Deoxy‐D‐glucose and D‐erythrose), where multiple independent clones were whole genome sequenced, there was no overlap in the genes in which mutations were found. This observation suggests that for these novel phenotypes, several genetically different routes are present that allow the ability to metabolize a given carbon source. Furthermore, whole genome sequencing of mutants that could grow on four other carbon sources (L‐valine, 2‐Deoxy‐D‐glucose, D‐adonitol, and D‐erythrose) and where P22 transduction did not work suggest that multiple mutations contribute to their novel phenotypes. Obviously we cannot rule out the possibility that some mutations (amplifications or insertions) were not picked up in our experiments because of their instability and possible reversion to the ancestral state, which could be the case with gene amplifications.
OVERCOMING PHYSIOLOGICAL CONSTRAINTS FOR ACQUISITION OF NEW METABOLIC PHENOTYPES
Adaptation to new environments can be limited due to physiological constraints (Gould and Lewontin 1979; Galis and Metz 2007), suggesting that mutations that overcome such constrains could allow evolution of new functions (Wagner and Muller 2002). One such case observed in our study was the ability to use L‐isoleucine as the sole carbon source. L‐isoleucine can be degraded in S. Typhimurium to acetyl‐CoA that can enter other pathways for generation of carbon compounds. However, L‐isoleucine is known to not serve as a carbon source, most likely because L‐isoleucine shares its biosynthesis enzymes with other branched chain amino acids, L‐valine and L‐leucine, and excess of L‐isoleucine in the environment would lead to feedback inhibition of these enzymes, resulting in starvation for L‐valine and L‐leucine. Similar effects are seen when excess L‐valine is present in the growth medium, where starvation for L‐isoleucine is observed (Temple et al. 1965). Mutations in the gene ilvN allow the mutants to grow on L‐isoleucine as the sole carbon source. These mutations were observed in two adjacent positions on this protein (N35K and V36A), both of which have been predicted to interact with L‐valine, potentially causing feedback inhibition (Kaplun et al. 2006). Thus, the observed mutations could result in reduced interaction between IlvN protein and the L‐isoleucine in the medium, thus overcoming L‐valine or L‐leucine starvation. Alternatively, this mutation could also result in lowering the feedback repression from the L‐valine being synthesized in the cell, having the same outcome of avoiding L‐valine starvation. These results were corroborated by our qPCR results suggesting that it was sufficient to overcome this constraint to allow usage of L‐isoleucine as carbon source. The interconnectedness is an inherent part of many metabolic pathways and results in physiological constraints. Our results suggest that mutations that relieve these physiological constraints might play an important role in evolution of new phenotypes.
FITNESS TRADE‐OFFS ACCOMPANYING NOVEL PHENOTYPES
Besides physiological constraints, trade‐offs between new and old capabilities can also influence the evolution of new phenotypes. ilvN mutants were unable to grow in either acetate or citrate as sole carbon source. Despite the presence of other IlvN‐like isozymes in the cell, IlvN plays an important role in synthesis of branched chain amino acids when the bacteria are growing on poor carbon sources (defined as carbon sources that confer slow growth), like acetate and citric acid. The inability of the ilvN mutant to grow on these poor carbon sources represents a functional trade‐off of the IlvN protein that results in loss of the native function of the protein (Dailey and Cronan 1986). Unexpectedly though the cells were able to grow on minimal media containing glycerol as the sole carbon source, which is another poor carbon source. This suggests that these functional trade‐offs observed are specific in nature, highlighting another level of complexity in understanding the evolution of the new phenotypes. Reduction in growth rate was also observed for the Lrp A63E mutant that allowed growth on L‐threonine as sole carbon source. This trade‐off is expected since it has been shown that Lrp regulates close to 400 genes in E. coli (Tani et al. 2002). Thus, mutations in this gene would have significant pleiotropic effects, which can dictate the evolution of the novel phenotype.
In conclusion, our study provides an analysis of how novel metabolic functions can arise from one or a few point mutations. Our results show how mutations that affect regulation play a significant part in adaptive evolution of novel phenotypes, and how mutations that remove physiological constraints can aid in evolution of novel phenotypes. However, our study also highlights the limitation of evolution of novel phenotypes by single‐step mutations under hard selection on novel carbon sources, given that we observed mutants for only 14% of the carbon sources tested. Future studies will focus on generation of novel phenotypes using an experimental evolution approach of evolving populations in the presence of utilizable yet poor carbon sources supplemented with a potential nonutilizable carbon source. This strategy might allow an expanding population to accumulate multiple mutations to allow efficient utilization of the novel carbon source.
CONFLICT OF INTEREST
The authors report no conflict of interest.
Associate Editor: T. Cooper
Handling Editor: Mohamed. A. F. Noor
Supporting information
Table 1. Carbon compounds used for selection of mutants with novel metabolic capabilities
Table 2. Increased mutation rates obtained using an error‐prone polymerase
Table 3. Mutations observed in mutants growing on novel carbon sources (where causal mutation is not identified)
Table 4. Mutations in gene celD that potentially allow for growth on cellobiose as sole carbon source
AUTHOR CONTRIBUTIONS
O.W., J.N., and D.A. were involved in designing the selection experiments. O.W., E.L., U.L. carried experiments for selection of mutants. O.W. and U.L. were involved in whole genome sequencing of mutants. O.W. carried out the P22 transductions, qPCR experiments and trade‐off measurements. O.W., J.N., and D.A. were involved in drafting and editing the manuscript.
ACKNOWLEDGMENTS
The authors greatly acknowledge the critical reading of the manuscript by members of Dan Andersson group. We would also like to thank the Editor and the reviewers for their constructive and useful comments, which helped improve the manuscript. This work was supported by grants from the Swedish Research Council to DIA.
DATA ARCHIVING
The fastq files obtained from whole genome sequencing of mutants are deposited in the dryad repository: https://doi.org/10.5061/dryad.2qh4k34.
LITERATURE CITED
- Anantharaman, K. , Brown C. T., Hug L. A., Sharon I., Castelle C. J., Probst A. J., Thomas B. C., Singh A., Wilkins M. J., Karaoz U., et al. 2016. Thousands of microbial genomes shed light on interconnected biogeochemical processes in an aquifer system. Nat. Comm. 7:13219. [DOI] [PMC free article] [PubMed] [Google Scholar]
- Barberán, A. , Ramirez K. S., Leff J. W., Bradford M. A., Wall D. H., and Fierer N.. 2014. Why are some microbes more ubiquitous than others? Predicting the habitat breadth of soil bacteria. Ecol. Lett. 17:794–802. [DOI] [PubMed] [Google Scholar]
- Bhattacharya, S. , Chakrabarti S., Nayak A., and Bhattacharya S. K.. 2003. Metabolic networks of microbial systems. Microbial Cell Factories 2:3. [DOI] [PMC free article] [PubMed] [Google Scholar]
- Bianconi, I. , Milani A., Cigana C., Paroni M., Levesque R. C., Bertoni G., and Bragonzi A.. 2011. Positive signature‐tagged mutagenesis in Pseudomonas aeruginosa: tracking patho‐adaptive mutations promoting airways chronic infection. PLoS Pathogens 7:p.e1001270. [DOI] [PMC free article] [PubMed] [Google Scholar]
- Blount, Z. D. , Borland C. Z., and Lenski R. E.. 2008. Historical contingency and the evolution of a key innovation in an experimental population of Escherichia coli . Proc. Natl. Acad. Sci. 105:7899–7906. [DOI] [PMC free article] [PubMed] [Google Scholar]
- Bohannan, B. J. , Kerr B., Jessup C. M., Hughes J. B., and Sandvik G.. 2002. Trade‐offs and coexistence in microbial microcosms. Antonie van Leeuwenhoek 81:107–115. [DOI] [PubMed] [Google Scholar]
- Brown, J. H. , Gillooly J. F., Allen A. P., Savage V. M., and West G. B.. 2004. Toward a metabolic theory of ecology. Ecology 85:1771–1789. [Google Scholar]
- Brown, J. E. , Brown P. R., and Clarke P. H.. 1969. Butyramide‐utilizing mutants of Pseudomonas aeruginosa 8602 which produce an amidase with altered substrate specificity. Microbiology 57:273–285. [DOI] [PubMed] [Google Scholar]
- Chan, T. T. K. , and Newman E. B.. 1981. Threonine as a carbon source for Escherichia coli . J. Bacteriol. 145:1150–1153. [DOI] [PMC free article] [PubMed] [Google Scholar]
- Chubiz, L. M. , and Marx C. J.. 2017. Growth trade‐offs accompany the emergence of glycolytic metabolism in Shewanella oneidensis MR‐1. J. Bacteriol. 199:e00827–16. [DOI] [PMC free article] [PubMed] [Google Scholar]
- Copley, S. D. 2003. Enzymes with extra talents: moonlighting functions and catalytic promiscuity. Cur. Opin. Chem. Biol. 7:265–272. [DOI] [PubMed] [Google Scholar]
- Copley, S. D. 2012. Toward a systems biology perspective on enzyme evolution. J. Biol. Chem. 287:3–10. [DOI] [PMC free article] [PubMed] [Google Scholar]
- Craig MacLean, R. 2005. Adaptive radiation in microbial microcosms. J. Evol. Biol. 18:1376–1386. [DOI] [PubMed] [Google Scholar]
- Dailey, F. E. , and Cronan J. E.. 1986. Acetohydroxy acid synthase I, a required enzyme for isoleucine and valine biosynthesis in Escherichia coli K‐12 during growth on acetate as the sole carbon source. J. Bacteriol. 165:453–460. [DOI] [PMC free article] [PubMed] [Google Scholar]
- Downs, D. M. 2006. Understanding microbial metabolism. Annu. Rev. Microbiol. 60:533–559. [DOI] [PubMed] [Google Scholar]
- Deutscher, D. , Meilijson I., Kupiec M., and Ruppin E.. 2006. Multiple knockout analysis of genetic robustness in the yeast metabolic network. Nat. Genet. 38:993–998. [DOI] [PubMed] [Google Scholar]
- Duffy, S. , Turner P. E., and Burch C. L.. 2006. Pleiotropic costs of niche expansion in the RNA bacteriophage Φ6. Genetics 172:751–757. [DOI] [PMC free article] [PubMed] [Google Scholar]
- Eisenreich, W. , Dandekar T., Heesemann J., and Goebel W.. 2010. Carbon metabolism of intracellular bacterial pathogens and possible links to virulence. Nat. Rev. Microbiol. 8:401–412. [DOI] [PubMed] [Google Scholar]
- Etterson, J. R. , and Shaw R. G.. 2001. Constraint to adaptive evolution in response to global warming. Science 294:151–154. [DOI] [PubMed] [Google Scholar]
- Fani, R. , and Fondi M.. 2009. Origin and evolution of metabolic pathways. Phys. Life Rev. 6:23–52. [DOI] [PubMed] [Google Scholar]
- Fuchs, T. M. , Eisenreich W., Heesemann J., and Goebel W.. 2012. Metabolic adaptation of human pathogenic and related nonpathogenic bacteria to extra‐and intracellular habitats. FEMS Microbiol. Rev. 36:435–462. [DOI] [PubMed] [Google Scholar]
- Galis, F. , and Metz J. A.. 2007. Evolutionary novelties: the making and breaking of pleiotropic constraints. Integr. Comp. Biol. 47:409–419. [DOI] [PubMed] [Google Scholar]
- Ghalambor, C. K. , Reznick D. N., and Walker J. A.. 2004. Constraints on adaptive evolution: the functional trade‐off between reproduction and fast‐start swimming performance in the Trinidadian guppy (Poecilia reticulata). Am. Nat. 164:38–50. [DOI] [PubMed] [Google Scholar]
- Gilbert, J. A. , Jansson J. K., and Knight R.. 2014. The Earth Microbiome project: successes and aspirations. BMC biology 12:69. [DOI] [PMC free article] [PubMed] [Google Scholar]
- Gould, S. J. , and Lewontin R. C.. 1979. The spandrels of San Marco and the Panglossian paradigm: a critique of the adaptationist programme. Proc. R Soc. Lond. B Biol. Sci. 205:581–598. [DOI] [PubMed] [Google Scholar]
- Gudelj, I. , Beardmore R. E., Arkin S. S.d MacLean R. C.. 2007. Constraints on microbial metabolism drive evolutionary diversification in homogeneous environments. J. Evol. Biol. 20:1882–1889. [DOI] [PubMed] [Google Scholar]
- Gutnick, D. , Calvo J. M., Klopotowski T., and Ames B. N.. 1969. Compounds which serve as the sole source of carbon or nitrogen for Salmonella Typhimurium LT‐2. J. Bacteriol. 100:215. [DOI] [PMC free article] [PubMed] [Google Scholar]
- Hall, B. G. 1999. Experimental evolution of Ebg enzyme provides clues about the evolution of catalysis and to evolutionary potential. FEMS Microbiol. Lett. 174:1–8. [DOI] [PubMed] [Google Scholar]
- Hall, B. G. 2003. The EBG system of E. coli: origin and evolution of a novel β‐galactosidase for the metabolism of lactose. Genetica 118:143–156. [PubMed] [Google Scholar]
- Ito, H. , and Sasaki A.. 2016. Evolutionary branching under multi‐dimensional evolutionary constraints. J. Theoret. Biol. 407:409–428. [DOI] [PubMed] [Google Scholar]
- Jeong, H. , Tombor B., Albert R., Oltvai Z. N., and Barabási A. L.. 2000. The large‐scale organization of metabolic networks. Nature 407:651–654. [DOI] [PubMed] [Google Scholar]
- Kaplun, A. , Vyazmensky M., Zherdev Y., Belenky I., Slutzker A., Mendel S., Barak Z. E., Chipman D. M., and Shaanan B.. 2006. Structure of the regulatory subunit of acetohydroxyacid synthase isozyme III from Escherichia coli . J. Mol. Biol. 357:951–963. [DOI] [PubMed] [Google Scholar]
- Kearney, M. , Simpson S. J., Raubenheimer D., and Helmuth B.. 2010. Modelling the ecological niche from functional traits. Philos. Trans. R Soc. Lond. B Biol. Sci. 365:3469–3483. [DOI] [PMC free article] [PubMed] [Google Scholar]
- Khersonsky, O. , and Tawfik D. S.. 2010. Enzyme promiscuity: a mechanistic and evolutionary perspective. Ann. Rev. Biochem. 79:471–505. [DOI] [PubMed] [Google Scholar]
- Kvitek, D. J. , and Sherlock G.. 2011. Reciprocal sign epistasis between frequently experimentally evolved adaptive mutations causes a rugged fitness landscape. PLoS Genet. 7:p.e1002056. [DOI] [PMC free article] [PubMed] [Google Scholar]
- Lande, R. 1979. Quantitative genetic analysis of multivariate evolution, applied to brain: body size allometry. Evolution 33(1Part2):402–416. [DOI] [PubMed] [Google Scholar]
- Locey, K. J. , and Lennon J. T.. 2016. Scaling laws predict global microbial diversity. Proc. Natl. Acad. Sci. 113:5970–5975. [DOI] [PMC free article] [PubMed] [Google Scholar]
- Maisnier‐Patin, S. , Roth J. R., Fredriksson Å., Nyström T., Berg O. G., and Andersson D. I.. 2005. Genomic buffering mitigates the effects of deleterious mutations in bacteria. Nat. Genet. 37:1376–1379. [DOI] [PubMed] [Google Scholar]
- Manoharan, L. , Kushwaha S. K., Hedlund K., and Ahrén D.. 2015. Captured metagenomics: large‐scale targeting of genes based on ‘sequence capture’ reveals functional diversity in soils. DNA Res. 22:451–460. [DOI] [PMC free article] [PubMed] [Google Scholar]
- McDonald, M. J. , Gehrig S. M., Meintjes P. L., Zhang X. X., and Rainey P. B.. 2009. Adaptive divergence in experimental populations of Pseudomonas fluorescens. IV. Genetic constraints guide evolutionary trajectories in a parallel adaptive radiation. Genetics 183:1041–1053. [DOI] [PMC free article] [PubMed] [Google Scholar]
- Mitchell‐Olds, T. 1996. Genetic constraints on life‐history evolution: quantitative‐trait loci influencing growth and flowering in Arabidopsis thaliana . Evolution 50:140–145. [DOI] [PubMed] [Google Scholar]
- Mongold, J. A. , Bennett A. F., and Lenski R. E.. 1996. Evolutionary adaptation to temperature. IV. Adaptation of Escherichia coli at a niche boundary. Evolution 50:35–43. [DOI] [PubMed] [Google Scholar]
- Mortlock, R. P. , Wood W. A.. 1971. Biochemical response to environmental stress. pp. 1–14.Plenum, New York. [Google Scholar]
- Nielsen, J. 2003. It is all about metabolic fluxes. J. Bacteriol. 185:7031–7035. [DOI] [PMC free article] [PubMed] [Google Scholar]
- Nobeli, I. , Favia A. D., and Thornton J. M.. 2009. Protein promiscuity and its implications for biotechnology. Nat. Biotechnol. 27:157–167. [DOI] [PubMed] [Google Scholar]
- Patil, K. R. , and Nielsen J.. 2005. Uncovering transcriptional regulation of metabolism by using metabolic network topology. Proc. Natl. Acad. Sci. USA 102:2685–2689. [DOI] [PMC free article] [PubMed] [Google Scholar]
- Parker, L. L. , and Hall B. G.. 1990. Mechanisms of activation of the cryptic cel operon of Escherichia coli K12. Genetics 124:473–482. [DOI] [PMC free article] [PubMed] [Google Scholar]
- Ravasz, E. , Somera A. L., Mongru D. A., Oltvai Z. N., and Barabási A. L.. 2002. Hierarchical organization of modularity in metabolic networks. Science 297:1551–1555. [DOI] [PubMed] [Google Scholar]
- Rohmer, L. , Hocquet D., and Miller S. I.. 2011. Are pathogenic bacteria just looking for food? Metabolism and microbial pathogenesis. Trends Microbiol. 19:341–348. [DOI] [PMC free article] [PubMed] [Google Scholar]
- Rigby, P. W. J. , Burleigh B. D. Jr., Hartley B. S.. 1974. Gene duplication in experimental enzyme evolution. Nature 251:200–204 [DOI] [PubMed] [Google Scholar]
- Salverda, M. L. , Dellus E., Gorter F. A., Debets A. J., Van Der Oost J., Hoekstra R. F., Tawfik D. S., and de Visser J. A. G.. 2011. Initial mutations direct alternative pathways of protein evolution. PLoS Genet. 7:p.e1001321. [DOI] [PMC free article] [PubMed] [Google Scholar]
- Shoval, O. , Sheftel H., Shinar G., Hart Y., Ramote O., Mayo A., Dekel E., Kavanagh K., and Alon U.. 2012. Evolutionary trade‐offs, Pareto optimality, and the geometry of phenotype space. Science 336:1157–1160. [DOI] [PubMed] [Google Scholar]
- Sokurenko, E. V. , Hasty D. L., and Dykhuizen D. E.. 1999. Pathoadaptive mutations: gene loss and variation in bacterial pathogens. Trends Microbiol. 7:191–195. [DOI] [PubMed] [Google Scholar]
- Szathmary, E. , and Smith J. M.. 1995. The major evolutionary transitions. Nature 374:227–232. [DOI] [PubMed] [Google Scholar]
- Tani, T. H. , Khodursky A., Blumenthal R. M., Brown P. O., and Matthews R. G.. 2002. Adaptation to famine: a family of stationary‐phase genes revealed by microarray analysis. Proc. Natl. Acad. Sci. USA 99:13471–13476. [DOI] [PMC free article] [PubMed] [Google Scholar]
- Tavazoie, S. , Hughes J. D., Campbell M. J., Cho R. J., and Church G. M.. 1999. Systematic determination of genetic network architecture. Nat. Genet. 22:281–285. [DOI] [PubMed] [Google Scholar]
- Temple, R. J. , Umbarger H. E., and Magasanik B.. 1965. The effect of L‐valine on enzyme synthesis in Escherichia coli K‐12. J. Biol. Chem. 240:1219–1224. [PubMed] [Google Scholar]
- Valentine, D. L. 2007. Adaptations to energy stress dictate the ecology and evolution of the Archaea. Nat. Rev. Microbiol. 5:316–323. [DOI] [PubMed] [Google Scholar]
- Wagner, G. P. , and Muller G. B.. 2002. Evolutionary innovations overcome ancestral constraints: a re‐examination of character evolution in male sepsid flies (Diptera: Sepsidae). Evol. Dev. 4:1–6; discussion 7–8. [DOI] [PubMed] [Google Scholar]
- Warheit, K. I. , Forman J. D., Losos J. B., and Miles D. B.. 1999. Morphological diversification and adaptive radiation: a comparison of two diverse lizard. Evolution 53:1226–1234. [DOI] [PubMed] [Google Scholar]
- Weinreich, D. M. , Watson R. A., and Chao L.. 2005. Perspective: sign epistasis and genetic constraint on evolutionary trajectories. Evolution 59:1165–1174. [PubMed] [Google Scholar]
- Weinreich, D. M. , Delaney N. F., DePristo M. A., and Hartl D. L.. 2006. Darwinian evolution can follow only very few mutational paths to fitter proteins. Science 312:111–114. [DOI] [PubMed] [Google Scholar]
- Wiedenbeck, J. , and Cohan F. M.. 2011. Origins of bacterial diversity through horizontal genetic transfer and adaptation to new ecological niches. FEMS Microbiol. Rev. 35:957–976. [DOI] [PubMed] [Google Scholar]
- Wood, R. , and Erwin D. H.. 2018. Innovation not recovery: dynamic redox promotes metazoan radiations. Biol. Rev. Camb. Philos. Soc. 93:863–873. [DOI] [PubMed] [Google Scholar]
- Wong, J. T. 1991. Origin of genetically encoded protein synthesis: a model based on selection for RNA peptidation. Orig. Life Evol. Biosph. 21:165–176. [DOI] [PubMed] [Google Scholar]
- Zhu, Y. , and Lin E. C.. 1986. An evolvant of Escherichia coli that employs the L‐fucose pathway also for growth on l‐galactose and d‐arabinose. J. Mol. Evol. 23:259–266. [DOI] [PubMed] [Google Scholar]
Associated Data
This section collects any data citations, data availability statements, or supplementary materials included in this article.
Supplementary Materials
Table 1. Carbon compounds used for selection of mutants with novel metabolic capabilities
Table 2. Increased mutation rates obtained using an error‐prone polymerase
Table 3. Mutations observed in mutants growing on novel carbon sources (where causal mutation is not identified)
Table 4. Mutations in gene celD that potentially allow for growth on cellobiose as sole carbon source