

Abstract
The gut microbiota and the bile acid pool play pivotal roles in maintaining intestinal homeostasis. Bile acids are produced in the liver from cholesterol and metabolized in the intestine by the gut microbiota. Gut dysbiosis has been reported to be associated with colorectal cancer. However, the interplay between bile acid metabolism and the gut microbiota during intestinal carcinogenesis remains unclear. In the present study, we investigated the potential roles of bile acids and the gut microbiota in the cholic acid (CA; a primary bile acid)‐induced intestinal adenoma‐adenocarcinoma sequence. Apc min/+ mice, which spontaneously develop intestinal adenomas, were fed a diet supplemented with 0.4% CA for 12 weeks. Mice that were fed a normal diet were regarded as untreated controls. In CA‐treated Apc min/+ mice, the composition of the gut microbiota was significantly altered, and CA was efficiently transformed into deoxycholic acid (a secondary bile acid) by the bacterial 7α‐dehydroxylation reaction. The intestinal adenoma‐adenocarcinoma sequence was observed in CA‐treated Apc min/+ mice and was accompanied by an impaired intestinal barrier function and IL‐6/STAT3‐related low‐grade inflammation. More importantly, microbiota depletion using an antibiotic cocktail globally compromised CA‐induced intestinal carcinogenesis, suggesting a leading role for the microbiota during this process. Overall, our data suggested that the crosstalk between bile acids and the gut microbiota mediated intestinal carcinogenesis, which might provide novel therapeutic strategies against intestinal tumor development.
Keywords: cholic acid (CA), gut microbiota, IL‐6/STAT3 signaling pathways, intestinal carcinogenesis, short‐chain fatty acids
Abbreviations
- Apc
adenomatous polyposis coli
- CA
cholic acid
- CDCA
chenodeoxycholic acid
- CRC
colorectal cancer
- DCA
deoxycholic acid
- HFD
high‐fat diet
- HGIN
high‐grade intraepithelial neoplasia
- IHC
immunohistochemical
- IL‐1β
interleukin‐1β
- IL‐6
interleukin‐6
- IL‐6/STAT3
interleukin 6/signal transducer and activator of transcription 3
- IMCE
Immorto‐Min colonic epithelial
- LGIN
low‐grade intraepithelial neoplasia
- LPS
lipopolysaccharide
- MUC2
mucin 2
- PAS
periodic acid‐Schiff
- PCA
principal component analysis
- SCFAs
short‐chain fatty acids
- SPF
specific pathogen free
- TNF‐α
tumor necrosis factor‐α
- VEGF
vascular endothelial growth factor
- ZO‐1
zonula occludens‐1
- α‐MCA
α‐muricholic acid
- β‐MCA
β‐muricholic acid
1. INTRODUCTION
Colorectal cancer (CRC) is one of the most frequently diagnosed human cancers and a leading cause of cancer‐related death worldwide.1 According to epidemiological and experimental studies, a high‐fat diet (HFD) may be involved in the development of CRC.2 More importantly, HFD‐related CRC has been reported to be associated with excess bile acid, and a substantial body of evidence suggests that bile acids play a vital role in CRC progression.3, 4, 5, 6, 7, 8
The gut microbiota plays a decisive role in the internal environment homeostasis by facilitating the harvesting of nutrients from ingested food and producing numerous metabolites for the human body. Bile acids are produced in the liver from cholesterol and metabolized in the intestine by the gut microbiota. In recent years, interest in HFD‐associated intestinal dysbiosis has increased; an HFD enhances bile secretion to facilitate lipid metabolism. Primary bile acids undergo modifications to secondary bile acids by 7α‐dehydroxylation reactions catalyzed by some species of Clostridium.9 The most typical secondary bile acid is deoxycholic acid (DCA), which is produced from cholic acid (CA).
Adenomatous polyposis coli (Apc) gene mutations occur in 95% of human sporadic CRCs10 and represent one of the earliest events in the adenoma‐adenocarcinoma sequence.11 Multiple intestinal neoplasia (Apc min/+) mice spontaneously develop multiple tumors in the intestine and are an established model for studying intestinal carcinogenesis. In our previous work, we aimed to determine the effects of DCA on intestinal carcinogenesis in Apc min/+ mice and found that DCA accelerates the intestinal adenoma‐adenocarcinoma sequence.12 Next, we investigated the effect of DCA on the induction of intestinal dysbiosis and its roles in intestinal carcinogenesis and demonstrated that DCA‐induced changes to the microbial community promoted intestinal carcinogenesis.13 The secondary bile acid DCA arises from CA, which is present in excess after HFD consumption. The intestinal microbiota participates in the biotransformation of CA to DCA. Thus, in this study, we assume that dysbiosis of the microbiota and associated alterations of metabolism might also influence intestinal carcinogenesis. In this paper, Apc min/+ mice were fed a basal, CA‐supplemented or CA‐antibiotic diet. We found that CA enhanced the intestinal adenoma‐adenocarcinoma sequence in Apc min/+ mice, which was accompanied by alterations in the gut microbiota and metabolites. An antibiotic cocktail globally prevented the carcinogenic effect of CA in vivo. Moreover, CA‐induced intestinal tumor development was mediated by the interleukin 6/signal transducer and activator of transcription 3 (IL‐6/STAT3) signaling pathway. These findings highlight the crosstalk between bile acids and the gut microbiota, thereby providing novel insight into therapeutic targets for CRC prevention.
2. MATERIALS AND METHODS
2.1. Mice and treatment
Four weeks old female Apc min/+ mice were purchased from the Animal Model Institute of Nanjing University, China. All animal experiments were performed according to the protocol approved by the Institutional Animal Care and Use Committee of Tianjin Medical University, Tianjin, China (ethical approval number: TMUaMEC 2016011). The animal use protocol listed below was reviewed and approved by the Animal Ethical and Welfare Committee.
The mice were divided into three groups: a control diet (Table S1) (control group, n = 10), a diet supplemented with 0.4% CA (CA group, n = 10), and a 0.4% CA diet with a daily dose of an antibiotic cocktail administered by gavage (CA‐Abx group, n = 10). We chose 0.4% w/w CA according to previous studies and our experiments.13, 14, 15 In addition, 0.5% (w/w) chenodeoxycholate (another primary bile acid) was administered as a 10‐week dietary treatment in Apc min/+ mice to increase duodenal tumors.15 In our previous work, Apc min/+ mice were also fed 0.5% CA in the diet; however, when the mice were fed this concentration of CA, feed intake significantly decreased. Considering the longer experimental period, 0.4% w/w CA was used in this study.
The antibiotic cocktail was a mixture of 500 mg of ampicillin, 250 mg of vancomycin, 500 mg of neomycin, and 250 mg of metronidazole (Sigma‐Aldrich, St. Louis, MO) based on previous studies.16, 17, 18, 19, 20 After 12 weeks, the mice were killed, and the cecal contents were immediately collected for further analysis. Small intestine and colon tissues were collected for histologic analysis. Fecal samples were collected for 1 day at the end of the experimental period for gut microbiota and bile acid analysis.
2.2. Intestinal tumor burden and tissue collection
The small intestine was divided into three equal sections (proximal, middle, and distal segments). Intestinal tumors were categorized as small (<1 mm), medium (1‐2 mm), or large (>2 mm). Swiss rolled distal small intestine and colon tissues were fixed in 10% buffered formalin.12, 21 The tissue sections were used for hematoxylin and eosin (H&E) staining and immunohistochemical (IHC) staining.
2.3. Histopathologic and IHC analysis
Formalin‐fixed sections were dehydrated, equilibrated, and embedded in paraffin. Sections of the distal small intestine and colon were stained with H&E and observed under a light microscope by a blinded pathologist (Dr. YJZ). The degree of tumor dysplasia was assessed. Low‐grade intraepithelial neoplasia (LGIN) was defined as low‐ and moderate‐grade dysplasia and high‐grade intraepithelial neoplasia (HGIN) included high‐grade dysplasia, carcinoma in situ and intramucosal carcinoma.
The expression of β‐catenin (Cell Signaling Technology, Boston, MA) and mucin 2 (MUC2) in the colon (Santa Cruz Biotechnology, Inc., Santa, Cruz, CA) and Ki‐67, defensin, STAT3, and p‐STAT3 (Tyr705) (Abcam, Cambridge, MA) in the small intestine was detected (Table S2). Colonic membranes were fixed and stained with periodic acid‐Schiff (PAS) reagent. For IHC staining, paraffin‐embedded intestine tissues were deparaffinized, rehydrated, and incubated with primary antibodies overnight at 4°C. The slides were incubated with a biotin‐labeled secondary antibody, and the same pathologist evaluated the results. Five random areas from a single section were evaluated for the percentage of positive cells. The number of MUC2‐positive or PAS‐positive cells in the distal colon tissues was determined by counting the absolute number of positive stained cells in at least 100 colonic crypts for each mouse. Data were quantified by calculating the average percentages of positive cells in each mouse as the rate of positive cells.
2.4. Real‐time PCR analysis
Total RNA was isolated using the RNeasy mini kit (Qiagen, Carlsbad, CA) and reverse‐transcribed with a TIANScript RT Kit (Tiangen, Inc., Beijing, China). Quantitative PCR was performed using the Power SYBR Green PCR Master Mix and the StepOne Plus Real‐Time PCR System (Applied Biosystems, Carlsbad, CA). The oligonucleotide primers for target genes (IL‐1β, IL‐6, tumor necrosis factor‐α [TNF‐α], ZO‐1, claudin 3, claudin 7, cryptidin, and defensin in the small intestine and MUC2 in the colon) are presented in Table S3. GAPDH was used as the control, and the method was used to evaluate the relative abundance of target genes.
2.5. Western blot analysis
Cell protein extracts were prepared following standard procedures in radioimmunoprecipitation assay buffer in the presence of protease inhibitors and phosphatase inhibitors (Roche, Mannheim, Germany). Approximately 20 to 30 μg of protein from each protein sample was boiled for 5 minutes and resolved in sodium dodecyl sulfate‐polyacrylamide gel electrophoresis gels (Solarbio, Beijing, China). The membranes were blocked in 5% nonfat milk in Tris‐buffered saline containing 0.1% Tween 20 and then incubated with primary antibodies (including STAT3, p‐STAT3, c‐Myc, cyclin D1, BCL‐XL, and vascular endothelial growth factor [VEGF]; Table S2) overnight at 4°C. Next, the membranes were incubated with horseradish peroxidase‐conjugated secondary antibodies for 1 hour at room temperature. The proteins were quantified by densitometry using the ImageJ software.
2.6. Intestinal barrier integrity
Intestinal barrier integrity was assessed by permeability to fluorescein isothiocyanate‐dextran (FITC‐D) before the mice were killed. FITC‐D was dissolved in water (4000 MW) and administered by gavage (600 mg/kg body weight). Whole blood was sampled by eyeball extirpation 4 hours after the procedure, and the mice were killed. The fluorescence intensity in the plasma was analyzed using a plate reader. This procedure was performed in separate groups of mice, and the concentration of FITC‐dextran in plasma was determined by comparison to a FITC‐dextran standard curve.22
2.7. Gut microbiota analysis by 16S ribosomal DNA amplicon sequencing
Total DNA from each stool sample was extracted using the cetyl trimethylammonium bromide (CTAB) method. A total of 1000 μL of CTAB lysis solution and 20 μL of lysozyme were added to a 2.0‐mL Eppendorf tube. Then, a moderate sample was added to the tube. The mixture was heated in a water bath for 2 hours at 65°C. After centrifugation, 950 μL of the supernatant was collected, and a mixture of equal volumes of phenol (pH 8.0), chloroform and isoamyl alcohol at a ratio of 25:24:1 was added to the supernatant. The sample was centrifuged at 12 000 rpm for 10 minutes. The supernatant was collected, and an equal volume of a mixture of chloroform and isoamyl alcohol was added at a ratio of 24:1. The sample was centrifuged again at 12 000 rpm for 10 minutes. Then, the supernatant was pipetted into a centrifuge tube with isopropanol. The sample was mixed by shaking and centrifuged at 12 000 rpm for 10 minutes to collect the precipitate. After washing with 75% ethanol, the precipitate was dried. Fifty‐one microliters of ddH2O was used to dissolve the DNA sample. Finally, 1 µL of RNase A was added to the RNA digest.
DNA samples were amplified for sequencing using a forward and reverse fusion primer. The primer was constructed with 341F (5′→3′): CCTAYGGGRBGCASCAG, 806R and (5′→3′): GGACTACNNGGGTATCTAAT. All of the PCRs were performed with 25 μL of 2× Taq PCR mix, 2 μL of forward and reverse primers, 2.5 μL of template DNA, and 8.0 μL of H2O. Thermal cycling consisted of an initial denaturation at 95°C for 5 minutes; 34 cycles of denaturation at 94°C for 1 minute, annealing at 57°C for 45 seconds, and elongation at 72°C for 1 minute; and a final step at 72°C for 10 minutes and 16°C for 5 minutes. DNA concentration and purity were monitored on 1% agarose gels. DNA was diluted to 1 ng/μL using sterile water. The V3‐V4 hypervariable regions of the 16S ribosomal RNA genes were amplified using specific barcoded primers. An equal volume of 1× loading buffer (containing SYBR green) was used with the PCR products, and electrophoresis was performed on 2% agarose gel for the detection of the PCR products. Equivalent amounts of the PCR products were mixed based on density. Then, the PCR product mixture was purified using the GeneJET Gel Extraction Kit (Thermo Fisher Scientific, Waltham, MA). Sequencing libraries were generated using an Illumina HiSeq DNA PCR‐Free Library Preparation Kit (Illumina, Santiago, CA). Raw sequence data from the Illumina platform were splice‐controlled and quality‐controlled to obtain clean tags. After chimera filtration, the effective data were available for subsequent analysis.
Sequences were analyzed using the QIIME software package (Quantitative Insights Into Microbial Ecology).23 Effective tags were mapped into operational taxonomic units and selected based on ≥97% similarity. The taxonomic analysis was based on the OTU sequences using the QIIME platform.24 Community diversity was estimated using the Shannon and Simpson index. Principal component analysis (PCA) and principal coordinate analysis were performed on the matrix of distances between CA‐treated and untreated groups.
2.8. Measurement of fecal bile acids
CA (Aladdin, Shanghai, China), DCA (Sigma‐Aldrich, St. Louis, MO), lithocholic acid (Aladdin, Shanghai, China), chenodeoxycholic acid (CDCA; Aladdin, Shanghai, China), α‐muricholic acid (α‐MCA) (Toronto Research Chemicals, [TRC], Toronto, Canada), and β‐MCA (TRC, Toronto, Canada) were added to fecal samples as reference standards, and an external standard method was used for preliminary measurement. The concentration of bile acids in feces was measured using liquid chromatography‐mass spectrometry, as previously described.25 Briefly, freeze‐dried feces were thoroughly ground. The fecal samples were suspended in 5 mL of chromatographic ethanol and extracted by vortexing and sonication at 30°C for 60 minutes. The pooled extract was then centrifuged twice (10 minutes, 10 000 rpm, 4°C). The supernatant (4 mL) was concentrated to dry under nitrogen. Chromatographic methanol was used to redissolve the samples, and the extracts were passed through a 0.22‐μm filter. The filtrate was stored at 4°C and analyzed with an Agilent 1260 Series liquid chromatography combined with a 6120B mass spectrometer. The concentration of individual bile acids in each group was calculated based on peak areas.
2.9. Analysis of short‐chain fatty acids in the cecal contents
The concentrations of short‐chain fatty acids (SCFAs; acetate, propionate and butyrate) in the cecal contents were measured using gas chromatography. Acetic acid, propionic acid, and butyric acid (Macklin, Shanghai, China) were added to the fecal samples as standards. The cecal contents were diluted to 3 mL with 10 mmol/L NaOH. The fecal samples were extracted by vortexing and sonication at 0°C for 5 minutes. The pooled extract was then centrifuged (15 minutes, 10 000 rpm, 4°C). The supernatant (1 mL) was mixed with chloroform at a ratio of 1:1 to extract liposoluble components, and the aqueous phase was obtained after vortexing and sonication. Then, 0.7 mL of the aqueous phase was reacted with 1.2 µL of HCl for 10 minutes. N‐hexane (1.4 mL) was used to extract SCFAs in the aqueous phase. The extract was stored at 4°C and analyzed with an Agilent 7890A Series gas chromatograph. The capillary column was 0.25 mm × 0.25 µm × 30 m (HP‐INNOWAX). The injector temperature was maintained at 220°C, and the carrier gas was N2 at a flow rate of 1 mL min−1 in the capillary column. The column temperature was maintained at 70°C for 2 minutes. The temperature was first increased at a rate of 10°C min−1 to 150°C for 10 minutes. Then, the temperature was increased to 230°C at a rate of 15°C min−1 for 5 minutes. The running time was 30.333 minutes.
2.10. Preparation of fecal contents and cell line culture conditions
The Immorto‐Min colonic epithelial (IMCE) cell line was kindly provided by Professor Fang Yan from Vanderbilt University. IMCE cells were derived from colonic epithelial cells of an F1 hybrid between SV40 large T antigen transgenic mice and the Apc min/+ mice26, 27; these cells serve as an excellent cell model that encodes an Apc mutation. IMCE cells were cultured at 33°C in Roswell Park Memorial Institute 1640 medium (Gibco, Grand Island, NY) containing 10% FBS (Gibco, Grand Island, NY) and 0.05% interferon‐γ. The cells were transferred to 37°C in the interferon‐γ‐free medium before fecal content stimulation.
Feces from the control group, CA group, and CA‐Abx group were suspended in sterile phosphate‐buffered saline (100 mg/mL), homogenized, and centrifuged at 1000 rpm for 5 seconds. The fecal contents were filtered using a 40‐μm cell strainer (BD Falcon) to remove aggregates and collect fecal bacteria content, which was used to stimulate the IMCE cell line at a 1:200 dilution based on a previous study.20 IMCE cells were grown in 6‐well plates at 33°C until 70% confluence was reached. The plates were then moved to 37°C for 24 hours in the interferon‐γ‐free medium. The cells were treated (three wells per treatment) with fecal bacteria content from the CA group (0, 15, 30, 60, 120, and 180 minutes) to select the most appropriate time for cell treatment. Then, the fecal bacteria contents from different groups and lipopolysaccharide (LPS; 1 μg/mL, used as a positive control) were used to stimulate the starving cells. IMCE cells were incubated with fecal bacteria content for 2 hours and subsequently collected for Western blot analysis.
2.11. Statistical analysis
The SPSS version 17.0 software (SPSS, Chicago, IL) was used for statistical analysis. All of the data are expressed as the mean ± SD and represent the average of at least three experiments performed in triplicate. Differences among groups were determined by one‐way analysis of variance for multiple comparisons. Statistical comparisons between two groups were made using a t test. A P value less than 0.05 was considered statistically significant. To compare the microbiota between two groups, we performed MetaStat and LEfSe analyses in addition to t test analysis; none of these analyses require the data to be normally distributed.
3. RESULTS
3.1. CA administration enhanced intestinal adenoma progression in Apc min/+ mice
CA treatment in Apc min/+ mice did not cause mortality or body weight gain among groups (n = 10) (Figure 1A and 1B). The total number of tumors in CA‐fed mice was increased by approximately twofold compared with that in the control group (Figure 1C). CA promoted intestinal tumor development mainly in the middle and distal portions of the small intestine (Figure 1D). Tumor size in the small intestine and the colon also increased (Figure 1E and 1F).
Figure 1.

The number and size distribution of intestinal tumors in CA‐treated and untreated Apc min/+ mice. CA accelerated intestinal carcinogenesis in Apc min/+ mice. A, Apc min/+ mice were administered a 0.4% CA diet or control diet and killed 12 weeks after treatment. The interaction between bile acid metabolism and the gut microbiota was investigated. B, No significant differences in body weight were noted between the CA‐treated group and untreated group throughout the treatment period (P > 0.05). C, The number of tumors/mouse in the small intestine and colon in the control group and CA‐fed Apc min/+ mice. D and E, The number of tumors in each section and the different sizes of tumors in the small intestine are presented for both groups. F, The number of different sizes of tumors in the colon are presented for both groups. G, The representative and histological appearance of intestinal tumors from CA‐treated and untreated Apc min/+ mice are shown. Adenomas were histologically identified in Apc min/+ mice fed a control diet, and intramucosal carcinoma was confirmed in the distal small intestines in CA‐fed Apc min/+ mice (hematoxylin and eosin). H, Immunohistochemistry results indicate that cell proliferation (Ki‐67) and nuclear β‐catenin accumulation in the small intestine were significantly increased in CA‐treated Apc min/+ mice compared with those in the control group. Scale bar = 50 μm. Ten mice for each group. *P < 0.05, **P < 0.01, and ***P < 0.001. Apc, adenomatous polyposis coli; CA, cholic acid [Color figure can be viewed at wileyonlinelibrary.com]
Moreover, CA supplementation of the diet also led to intestinal carcinogenesis. In the distal small intestine, HGIN, including high‐grade dysplasia (50%, 5/10) and intramucosal carcinomas (30%, 3/10), was detected in CA group mice, whereas age‐matched Apc min/+ mice on a normal diet developed only adenoma with or without LGIN (Figure 1G). Ki‐67 and β‐catenin expression levels were also increased in CA‐fed mice (Figure 1H). These findings suggest that CA enhanced the multiplicity of intestinal tumors and accelerated the intestinal adenoma‐adenocarcinoma sequence in Apc min/+ mice.
3.2. CA treatment altered the gut microbiota composition during intestinal carcinogenesis
PCA and β diversity results revealed that the gut microbial community of CA‐fed mice was significantly distinct from that of untreated mice (Figure 2A and 2B) (CA group: n = 5; control group: n = 4; Figure 2B). Four dominant phyla were observed in the intestinal microbiota: Firmicutes, Bacteroidetes, Proteobacteria, and Verrucomicrobia. The bacterial population in the control group was dominated by Bacteroidetes (50.9%) and Firmicutes (29.5%), whereas the relative abundance of Bacteroidetes and Verrucomicrobia increased to 57.6% and 22.0%, respectively, in the CA group, with a significant decrease in Firmicutes. The fecal microbial community was strikingly altered by CA administration (Figure 2C; CA group: n = 5; control group: n = 4). The reduction in Firmicutes partly resulted from an increase in the Clostridia class (Figure 2C). To investigate the differences between the groups, the taxa with significant differences between the two groups at the genus level are shown in Figure 2D.
Figure 2.
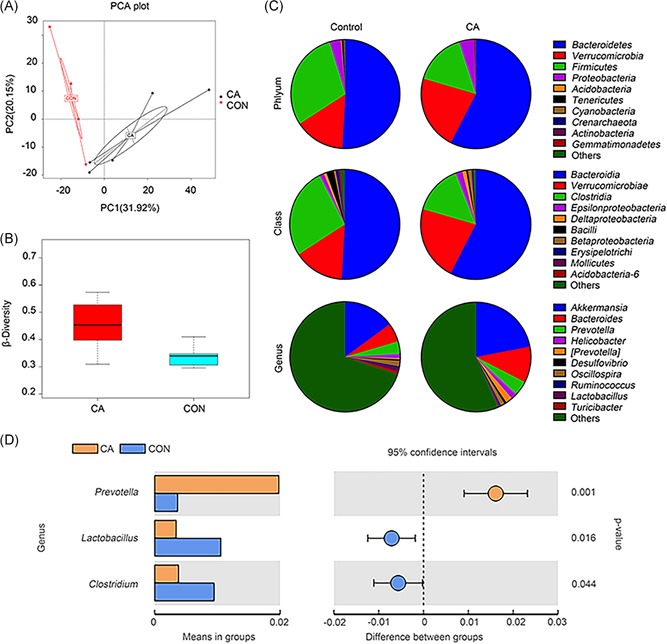
The fecal microbiota composition was significantly altered by CA administration. A, Principal component analysis (PCA) of the fecal microbiota in CA‐fed mice (n = 5) and untreated mice (n = 4). B, β diversities of the CA group (n = 5) and the control group (n = 4). C, Population analysis for each diet group included the phyla, classes, and major genera identified. The mean percentage (%) of the total population is presented. D, The taxa with significant differences between the two groups at the genus level are shown. CA, cholic acid; CON, control group; n, the number of the mice [Color figure can be viewed at wileyonlinelibrary.com]
Normal colonic bacteria ferment dietary fiber and generate SCFAs. The most abundant SCFAs included acetate, propionate, and butyrate. Previous studies have suggested that the increased risk of colon cancer might be partly explained by the reduced production of antineoplastic SCFAs.28 The bacteria that produce the most SCFAs are Firmicutes in Clostridium clusters IV and XIVa.29 SCFAs were detected in the cecal contents in this study; as shown in Figure 3A, the fecal concentration of SCFAs was significantly decreased in CA‐fed mice. These findings indicated that CA diet‐induced dysbiosis might further reduce SCFA production and promote intestinal carcinogenesis.
Figure 3.
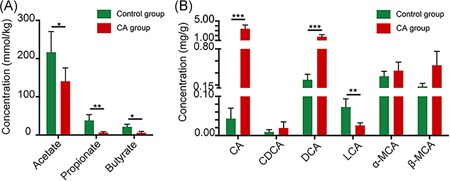
Effects of cholic acid (CA) treatment on short‐chain fatty acid production and bile acid metabolism in Apc min/+ mice. A, Types of short‐chain fatty acids, including acetate, propionate, and butyrate, detected in the cecal contents. B, Types of bile acids detected in the feces, including CA, chenodeoxycholic acid (CDCA), deoxycholic acid (DCA), lithocholic acid (LCA), α‐muricholic acid (α‐MCA), and β‐muricholic acid (β‐MCA). *P < 0.05, **P < 0.01, and ***P < 0.001. Apc, adenomatous polyposis coli [Color figure can be viewed at wileyonlinelibrary.com]
3.3. CA‐induced dysbiosis increased DCA production
Bile acid composition in the intestine is determined by a combination of bile acid biosynthesis in the liver and bioconversion by intestinal bacteria.9 We detected fecal concentrations of bile acids after CA treatment. As shown in Figure 3B, CA administration dramatically increased the fecal concentrations of both administered CA and bactericidal DCA, whereas the levels of muricholic acids (α‐MCA and β‐MCA, the main primary bile acids in mice) were generally unaffected. This finding clearly indicated that CA in the diet was primarily transformed into DCA by bacterial 7α‐dehydroxylation in mice, which is similar to that observed in the human colon.9
Bile acids were previously reported to exhibit antimicrobial effects by disrupting membrane integrity.30 DCA was one of the most potent antimicrobial bile acids, with 10‐fold the bactericidal activity of CA. The average fecal DCA concentrations in the control and CA groups were 0.18 mmol/L and 1.13 mmol/L, respectively (the water content of the biological sample was assumed to be 75%14). These data are similar to the fecal DCA concentrations in humans with a normal diet (0.046‐0.21 mmol/L) or a HFD (0.07‐0.73 mmol/L).31 Thus, these results suggest that increased bile acid concentrations might also apply a strong selective pressure that subsequently alters the composition of the intestinal microbiota.
3.4. CA‐induced dysbiosis contributed to impaired gut barrier function and low‐grade intestinal inflammation
The intestinal permeability of CA‐treated mice significantly increased (P < 0.01; n = 10; Figure 4A). IL‐6, IL‐1β, and TNF‐α mRNA levels were upregulated by CA treatment (Figure 4B). Emerging evidence indicates that intestinal dysbiosis influences mucus barrier biology.32 The relative abundance of Akkermansia and Bacteroides increased by approximately 7% and 5%, respectively, in the CA group compared with that in the control group (Figure 2D). These bacteria are associated with increased intestinal inflammation and impaired gut barrier function.33, 34 In particular, our findings demonstrated decreased ZO‐1, claudin 3, claudin 7, and MUC2 mRNA expression (Figure 4C). PAS and MUC2 staining revealed that the CA diet decreased the number and secretory function of goblet cells, which play a vital role in maintaining the thick mucus layer (Figure 4D). Cryptidin and defensin mRNA expression was reduced in CA‐fed mice, and lysozyme staining also suggested impaired Paneth cell function (Figure 4C and 4D).
Figure 4.
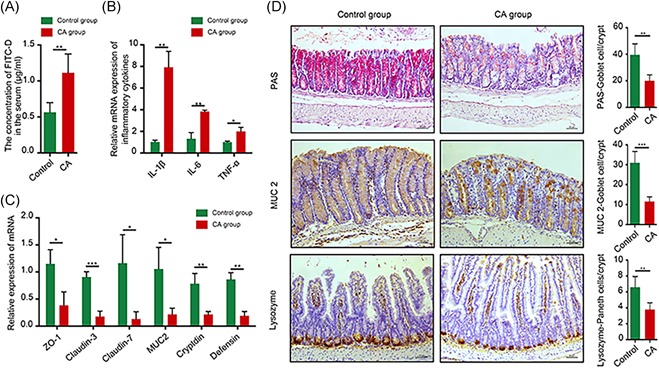
CA‐induced dysbiosis contributes to the impairment of gut barrier function and low‐grade intestinal inflammation. A, Intestinal permeability was evaluated in CA‐treated Apc min/+ mice by FITC‐D. B, Real‐time PCR demonstrated that CA‐induced low‐grade systematic inflammation in the small intestine. C, mRNA expression of gut barrier‐associated factors, including ZO‐1, claudin 3, claudin 7, MUC2, cryptidin, and defensin, was downregulated in CA‐treated Apc min/+ mice. D, PAS goblet cell staining revealed that CA decreased goblet cell numbers in the colon. Immunohistochemistry results revealed that MUC2 and lysozyme protein levels in the small intestine were significantly decreased in CA‐treated Apc min/+ mice. Scale bar = 50 μm. *P < 0.05, **P < 0.01, and ***P < 0.001. Apc, adenomatous polyposis coli; CA, cholic acid; FITC‐D, fluorescein isothiocyanate‐dextran; MUC2, mucin 2 [Color figure can be viewed at wileyonlinelibrary.com]
3.5. An antibiotic cocktail prevented CA‐induced intestinal carcinogenesis
To further determine the role of the gut microbiota in CA‐induced intestinal carcinogenesis, CA‐fed Apc min/+ mice were simultaneously administered an antibiotic cocktail by gavage for 12 weeks to deplete the gut microbiota (n = 10). The number of tumors in all sections of the small intestine and colon decreased (Figure 5A and 5B). In addition, the numbers of tumors of all sizes in the small intestine (<1, 1‐2, and >2 mm) in CA‐Abx‐treated mice were dramatically decreased compared with those in the CA‐treated group (Figure 5C). In the colon, the number of larger tumors (1‐2 and >2 mm) also decreased significantly (Figure 5D). No HGIN was found in the distal small intestine or colon after antibiotic cocktail treatment (Figure 5E). Antibiotic administration in the CA group also led to a significant reduction in tumor multiplicity, suggesting that the gut microbiota plays a crucial role in CA‐induced intestinal carcinogenesis.
Figure 5.
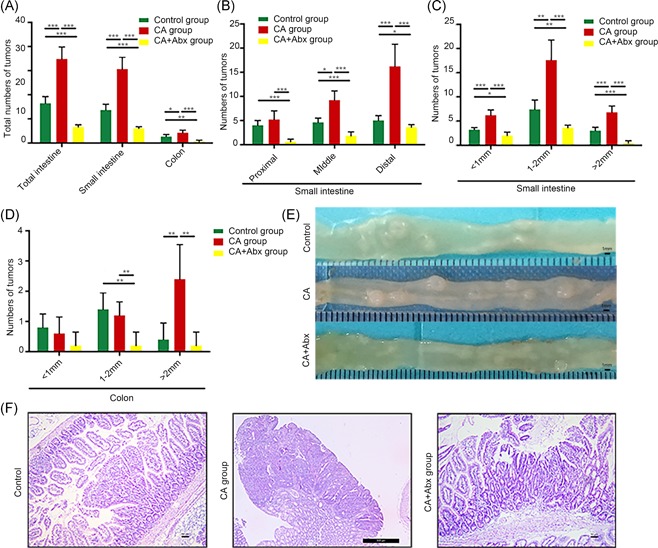
CA‐induced intestinal carcinogenesis can be prevented with an antibiotic cocktail. A, The number of tumors/mouse in the small intestine and colon in control mice, CA‐treated Apc min/+ mice, and CA+Abx‐treated Apc min/+ mice. B and C, The numbers of tumors in each section and different sizes of tumors in the small intestine in the three groups are depicted. D, The number of tumors of different sizes in the colon in the three groups is shown. E and F, The representative and histological appearance of intestinal tumors from the control group, CA group, and CA+Abx group is presented. Scale bar = 50 μm. *P < 0.05, **P < 0.01, and ***P < 0.001. Abx, antibiotics; Apc, adenomatous polyposis coli; CA, cholic acid [Color figure can be viewed at wileyonlinelibrary.com]
3.6. CA‐induced intestinal dysbiosis activated the IL‐6/STAT3 pathway
Recent evidence suggests a crucial role for STAT3 in the induction and maintenance of a pro‐carcinogenic inflammatory microenvironment both during the initiation of malignant transformation and during cancer progression.35, 36 Notably, IL‐6 is one of the most important STAT3 activators.36, 37, 38 As shown in Figure 6, IL‐6 mRNA expression and p‐STAT3 levels in intestinal tissues were increased after CA exposure, whereas no significant difference in total STAT3 expression was observed (n = 10) (Figure 6A and 6B). The increased IL‐6 and p‐STAT3 expressions were significantly decreased by CA‐Abx treatment (Figure 6A).
Figure 6.

CA‐induced dysbiosis promoted STAT3 activation. A. PCR analysis of inflammatory cytokine expression (including IL‐6) in intestinal tumors from control, CA‐treated, and CA‐antibiotic‐treated Apc min/+ mice. B, Immunohistochemical analysis of p‐STAT3 and STAT3 expression in small intestinal tumors from control, CA‐treated, and CA‐Abx‐treated Apc min/+ mice. Scale bar = 50 μm. C, Treatment of IMCE cells with the fecal bacteria content from CA‐treated mice for the indicated duration of time. STAT3, p‐STAT3, and cyclin D1 expression was assessed by Western blot analysis. D, Treatment of IMCE cells with the fecal bacteria content from the control, CA‐treated, and CA‐Abx‐treated mice. Expression of STAT3, p‐STAT3, and downstream targets, including cyclin D1, c‐Myc, BCL‐XL, and VEGF, was assessed by Western blot analysis. Control, IMCE cells treated with the fecal bacteria content from control Apc min/+ mice. CA, IMCE cells treated with the fecal bacteria content from CA‐treated Apc min/+ mice. CA+Abx, IMCE cells treated with the fecal bacteria content from CA‐Abx‐treated Apc min/+ mice. Untreated, IMCE cells without treatment served as a negative control. LPS, IMCE cells treated with lipopolysaccharide (1 μg/mL) served as the positive control. Images shown in B and C are representative images from three independent experiments. CA, cholic acid. Abx, antibiotic cocktail. *P < 0.05, **P < 0.01, and ***P < 0.001. Abx, antibiotics; Apc, adenomatous polyposis coli; CA, cholic acid; IMCE, Immorto‐Min colonic epithelial; LPS, lipopolysaccharide; STAT3, signal transducer and activator of transcription 3; VEGF, vascular endothelial growth factor [Color figure can be viewed at wileyonlinelibrary.com]
Next, we investigated the effects of the fecal bacteria content from the control, CA‐treated and CA‐Abx‐treated mice on IL‐6/STAT3 signaling in vitro. The activation of p‐STAT3 was time‐dependent in IMCE cells treated with fecal bacteria content from CA‐diet mice, and p‐STAT3 expression peaked at 2 hours (Figure 6C). Thus, we used 2 hours as the treatment time. When IMCE cells were incubated with the fecal bacteria content from CA‐diet mice, STAT3 signaling and its downstream regulators, such as cyclin D1, c‐Myc, BCL‐XL, and VEGF, were also activated (Figure 6D). In comparison, treatment of IMCE cells with the fecal bacteria content from the control and CA‐Abx mice did not activate STAT3 signaling. Overall, these results suggest that CA‐induced dysbiosis activates IL‐6/STAT3 signaling during intestinal carcinogenesis.
4. DISCUSSION
Various risk factors are involved in CRC progression, including an HFD.39, 40 Previous studies have suggested that excessive bile acids after HFD consumption2, 41 or cholecystectomy42, 43 play critical roles in CRC development. The primary bile acids in humans, CA and CDCA, are produced in the liver and modified to secondary bile acids in the intestine by bacteria that facilitate the 7α‐dehydroxylation reaction. Conversely, bile acids modulate the gut microbial composition through antimicrobial effects32, 44 and the induction of innate immune activity.45 Gut microbiota alterations further influence host metabolism, including SCFA production. Our previous work demonstrated that DCA‐induced dysbiosis could be transferred to mice and lead to intestinal carcinogenesis.13 Thus, we hypothesize that the complex interactions between bile acids and the intestinal microbiota significantly influence cancer development. This study demonstrates that the progression of intestinal adenoma in the Apc min/+ mouse model was promoted by the interplay between bile acids and the gut microbiota. The increase in some mucin‐degrading bacteria, such as Akkermansia, might facilitate this progression. Moreover, decreased protective SCFAs, increased DCA production, and STAT3 signaling pathway activation are also involved in malignant tumor progression.
SCFAs are generated by SCFA‐producing bacteria as fermentation products from dietary fibers.46 Intracellular SCFAs inhibit the activity of histone deacetylases in colonocytes and immune cells to stimulate histone acetylation, induce apoptosis, and inhibit cell proliferation.47, 48 Furthermore, SCFAs exert potential anti‐inflammatory effects and regulate colonic regulatory T cells.49, 50, 51 Bacteria in the genus Clostridium from the phylum Firmicutes produce the most SCFAs, and SCFA levels were decreased after CA administration in this study. Thus, SCFA production is reduced by CA‐induced dysbiosis, ultimately leading to intestinal carcinogenesis.
Notably, CA increased the relative abundance of Akkermansia and Bacteroides at the genus level based on the 16S ribosomal DNA amplicon sequencing analysis. Akkermansia and Bacteroides are mucin‐degrading bacteria, and their levels have been positively correlated with intestinal inflammation and tumor incidence in previous studies.14, 31, 52, 53, 54 The common features between the previous study by Islam et al14 and our work are that CA altered the intestinal microbiota composition and the bacterial metabolites produced, such as DCA and SCFA.
According to the decreased MUC2 expression observed in our results, we hypothesize that an overabundance of mucin degradation might undermine the integrity of the mucosal barrier and facilitate colonization by intestinal pathogens, leading to inflammation and carcinogenesis.55 In the previous study of Song et al,56 they focussed on the effects of bile acids on mucin gene expression in human colon carcinoma cells in vitro. Human colon carcinoma cells were treated with different kinds of (bile acids), such as deoxycholate, chenodeoxycholate, or ursodeoxycholate, and MUC2 protein was assayed by Western blot analysis and MUC2 transcription was assayed using a MUC2 promoter reporter luciferase construct. Mucin alterations are a common feature of colonic neoplasia, and alterations in MUC2 mucin have been associated with tumor progression in the colon. And they found that bile acids induced mucin expression in human colon carcinoma cells by increasing MUC2 transcription through a process involving mitogen‐activated protein kinase‐independent, protein kinase C‐dependent activation of AP‐156. However, in our study, we focus on the mucus system, mucin‐producing cells in the colon, and the intestinal barrier but not on the mucin gene expression in colon carcinoma cells. The broken intestinal barrier might be associated with intestinal carcinogenesis after CA exposure. In another study of Femia,57 they found that Apc mutations were present in mucin‐depleted foci with a frequency similar to that of tumors, strengthening the evidence that mucin‐depleted foci were precancerous lesions in colon carcinogenesis. In our study, we found that the mucin‐producing cells in the colon were significantly decreased after CA treatment. Wnt‐signaling activation was also found in CA group Apc min/+ mice. These results were in agreement with the previous study. Thus together with Femia's57 study, we speculate that Wnt‐signaling activation may participate in the decreasing of mucin‐producing cells and intestinal carcinogenesis.
The 7α‐dehydroxylation reaction, which is one of the most important steps in the production of secondary bile acids, eliminates the functional hydroxyl group and increases the hydrophobicity of the molecule. Among these bile acids, one of the most toxic secondary bile acids is DCA, which is produced from CA. In our data, fecal concentrations of DCA were dramatically increased after the CA administration. High DCA concentrations (>1 mmol/L) inhibit the growth of many intestinal bacteria, including Clostridium perfringens, Bacteroides fragilis, lactobacilli, and bifidobacteria in vitro.32 Thus, it is reasonable to consider that the interaction between bile acids and the gut microbiota controls the progression of intestinal adenoma.
A previous study suggested that feeding 0.4% CA could induce liver damage and increase serum glutamic‐pyruvic transaminase and glutamic‐oxaloacetic transaminase.58 We also found that inflammatory cell infiltration in the liver was increased in the CA group in our study (Figure S1). Liver disease has been associated with qualitative and quantitative (overgrowth) dysbiotic changes in the intestinal microbiota. The liver can not clear the toxic metabolites (such as ammonia and LPS) from intestinal bacteria when it is injured by CA. Excessive LPS may further alter the composition of the gut microbiota. Therefore, the altered gut microbiota in the present study might also be associated with liver damage. This represents that liver damage is a confounding factor in the study of gut microbiota.
The importance of inflammation and immunobiology in malignant progression has become a recent focus of attention.59, 60, 61 Previous studies have identified elevated p‐STAT3 as a prognostic factor for various cancers, including CRC,62, 63, 64 highlighting STAT3 as a major molecular bridge between inflammation and carcinogenesis. In our study, low‐grade intestinal inflammation and STAT3 signaling activation were observed in the CA group, all of which were abolished by antibiotics. Moreover, treatment of precolorectal tumor cells with the fecal bacteria content from the CA group led to high levels of p‐STAT3 and downstream target genes. These data suggest that CA‐induced dysbiosis activated the STAT3 pathway and promoted subsequent intestinal carcinogenesis.
Some other limitations of this study should be noted. First, the study lacked a control group that received sham oral gavage without antibiotics and a control group that received oral gavage with antibiotics, which represents a confounding effect in our study. We can not contrast the intestinal microbiome of CA+antibiotics mice to control+antibiotic mice. The experimental design will be planned more carefully in the future. Second, we acknowledged the statistical limitations of the study due to the small sample size. Third, the method used to quantify fecal bile acids is not standard. Typically, deuterium‐labeled standards should be added as internal controls. The lack of deuterium‐labeled standards to determine extraction efficiency makes it difficult to compare samples accurately.
Overall, the interplay between CA and the gut microbiota plays a crucial role in the progression of intestinal adenoma. These findings suggested that the complex interaction between bile acids and the gut microbiota serves as a promising avenue for CRC treatment.
CONFLICT OF INTERESTS
The authors declare that there are no conflicts of interest.
Supporting information
Supplementary information
Supplementary information
Supplementary information
Supplementary information
ACKNOWLEDGMENTS
This study was supported by the National Natural Science Foundation of China (Grants: 81570478, 81700456, and 81741075) and from the Tianjin Research Program of Application Foundation and Advanced Technology of China (17JCYBJC24900).
Wang S, Dong W, Liu L, et al. Interplay between bile acids and the gut microbiota promotes intestinal carcinogenesis. Molecular Carcinogenesis. 2019;58:1155‐1167. 10.1002/mc.22999
Wang and Dong have contributed equally to this study.
Contributor Information
Bangmao Wang, Email: tjmughgi@hotmail.com.
Hailong Cao, Email: caohailong@tmu.edu.cn.
References
REFERENCES
- 1. Pan R, Zhu M, Yu C, et al. Cancer incidence and mortality: a cohort study in China, 2008‐2013. Int J Cancer. 2017;141:1315‐1323. [DOI] [PubMed] [Google Scholar]
- 2. Beyaz S, Mana MD, Roper J, et al. High‐fat diet enhances stemness and tumorigenicity of intestinal progenitors. Nature. 2016;531:53‐58. [DOI] [PMC free article] [PubMed] [Google Scholar]
- 3. Seraj MJ, Umemoto A, Kajikawa A, et al. Effects of dietary bile acids on formation of azoxymethane‐induced aberrant crypt foci in F344 rats. Cancer Lett. 1997;115:97‐103. [DOI] [PubMed] [Google Scholar]
- 4. Sutherland LAM, Bird RP. The effect of chenodeoxycholic acid on the development of aberrant crypt foci in the rat colon. Cancer Lett. 1994;76:101‐107. [DOI] [PubMed] [Google Scholar]
- 5. Reddy BS, Narasawa T, Weisburger JH, Wynder EL. Promoting effect of sodium deoxycholate on colon adenocarcinomas in germfree rats. J Natl Cancer Inst. 1976;56:441‐442. [DOI] [PubMed] [Google Scholar]
- 6. McSherry CK, Cohen BI, Bokkenheuser VD, et al. Effects of calcium and bile acid feeding on colon tumors in the rat. Cancer Res. 1989;49:6039‐6043. [PubMed] [Google Scholar]
- 7. Pongracz J, Clark P, Neoptolemos JP, Lord JM. Expression of protein kinase C isoenzymes in colorectal cancer tissue and their differential activation by different bile acids. Int J Cancer. 1995;61:35‐39. [DOI] [PubMed] [Google Scholar]
- 8. Rigas B, Tsioulias GJ, Allan C, Wali RK, Brasitus TA. The effect of bile acids and piroxicam on MHC antigen expression in rat colonocytes during colon cancer development. Immunology. 1994;83:319‐323. [PMC free article] [PubMed] [Google Scholar]
- 9. Ridlon JM, Kang DJ, Hylemon PB. Bile salt biotransformations by human intestinal bacteria. J Lipid Res. 2006;47:241‐259. [DOI] [PubMed] [Google Scholar]
- 10. Ferlay J, Soerjomataram I, Dikshit R, et al. Cancer incidence and mortality worldwide: sources, methods and major patterns in GLOBOCAN 2012. Int J Cancer. 2015;136:E359‐E386. [DOI] [PubMed] [Google Scholar]
- 11. Cancer Genome Atlas Network . Comprehensive molecular characterization of human colon and rectal cancer. Nature. 2012;487:330‐337. [DOI] [PMC free article] [PubMed] [Google Scholar]
- 12. Cao H, Luo S, Xu M, et al. The secondary bile acid, deoxycholate accelerates intestinal adenoma‐adenocarcinoma sequence in Apc (min/+) mice through enhancing Wnt signaling. Fam Cancer. 2014;13:563‐571. [DOI] [PubMed] [Google Scholar]
- 13. Cao H, Xu M, Dong W, et al. Secondary bile acid‐induced dysbiosis promotes intestinal carcinogenesis. Int J Cancer. 2017;140:2545‐2556. [DOI] [PubMed] [Google Scholar]
- 14. Islam KB, Fukiya S, Hagio M, et al. Bile acid is a host factor that regulates the composition of the cecal microbiota in rats. Gastroenterology. 2011;141:1773‐1781. [DOI] [PubMed] [Google Scholar]
- 15. Mahmoud NN, Dannenberg AJ, Bilinski RT, et al. Administration of an unconjugated bile acid increases duodenal tumors in a murine model of familial adenomatous polyposis. Carcinogenesis. 1999;20:299‐303. [DOI] [PubMed] [Google Scholar]
- 16. Schulz MD, Atay Ç, Heringer J, et al. High‐fat‐diet‐mediated dysbiosis promotes intestinal carcinogenesis independently of obesity. Nature. 2014;514:508‐512. [DOI] [PMC free article] [PubMed] [Google Scholar]
- 17. Seo SU, Kamada N, Muñoz‐Planillo R, et al. Distinct commensals induce interleukin‐1beta via NLRP3 inflammasome in inflammatory monocytes to promote intestinal inflammation in response to injury. Immunity. 2015;42:744‐755. [DOI] [PMC free article] [PubMed] [Google Scholar]
- 18. Iida N, Dzutsev A, Stewart CA, et al. Commensal bacteria control cancer response to therapy by modulating the tumor microenvironment. Science. 2013;342:967‐970. [DOI] [PMC free article] [PubMed] [Google Scholar]
- 19. Rakoff‐Nahoum S, Paglino J, Eslami‐Varzaneh F, Edberg S, Medzhitov R. Recognition of commensal microflora by toll‐like receptors is required for intestinal homeostasis. Cell. 2004;118:229‐241. [DOI] [PubMed] [Google Scholar]
- 20. Brandl K, Plitas G, Mihu CN, et al. Vancomycin‐resistant enterococci exploit antibiotic‐induced innate immune deficits. Nature. 2008;455:804‐807. [DOI] [PMC free article] [PubMed] [Google Scholar]
- 21. Grill JI, Neumann J, Herbst A, et al. DRO1 inactivation drives colorectal carcinogenesis in ApcMin/+mice. Mol Cancer Res. 2014;12:1655‐1662. [DOI] [PubMed] [Google Scholar]
- 22. Gadaleta RM, van Erpecum KJ, Oldenburg B, et al. Farnesoid X receptor activation inhibits inflammation and preserves the intestinal barrier in inflammatory bowel disease. Gut. 2011;60:463‐472. [DOI] [PubMed] [Google Scholar]
- 23. Caporaso JG, Kuczynski J, Stombaugh J, et al. QIIME allows analysis of high‐throughput community sequencing data. Nature Methods. 2010;7:335‐336. [DOI] [PMC free article] [PubMed] [Google Scholar]
- 24. Wang Q, Garrity GM, Tiedje JM, Cole JR. Naive Bayesian classifier for rapid assignment of rRNA sequences into the new bacterial taxonomy. Appl Environ Microbiol. 2007;73:5261‐5267. [DOI] [PMC free article] [PubMed] [Google Scholar]
- 25. Hagio M, Matsumoto M, Fukushima M, Hara H, Ishizuka S. Improved analysis of bile acids in tissues and intestinal contents of rats using LC/ESI‐MS. J Lipid Res. 2009;50:173‐180. [DOI] [PubMed] [Google Scholar]
- 26. Fenton JI, Hursting SD, Perkins SN, Hord NG. Interleukin‐6 production induced by leptin treatment promotes cell proliferation in an Apc (Min/+) colon epithelial cell line. Carcinogenesis. 2006;27:1507‐1515. [DOI] [PubMed] [Google Scholar]
- 27. Whitehead RH, Joseph JL. Derivation of conditionally immortalized cell lines containing the Min mutation from the normal colonic mucosa and other tissues of an "Immortomouse"/Min hybrid. Epithelial Cell Biol. 1994;3:119‐125. [PubMed] [Google Scholar]
- 28. Ou J, DeLany JP, Zhang M, Sharma S, O'keefe SJD. Association between low colonic short‐chain fatty acids and high bile acids in high colon cancer risk populations. Nutr Cancer. 2012;64:34‐40. [DOI] [PMC free article] [PubMed] [Google Scholar]
- 29. Young VB, Schmidt TM. Antibiotic‐associated diarrhea accompanied by large‐scale alterations in the composition of the fecal microbiota. J Clin Microbiol. 2004;42:1203‐1206. [DOI] [PMC free article] [PubMed] [Google Scholar]
- 30. Kurdi P, Kawanishi K, Mizutani K, Yokota A. Mechanism of growth inhibition by free bile acids in lactobacilli and bifidobacteria. J Bacteriol. 2006;188:1979‐1986. [DOI] [PMC free article] [PubMed] [Google Scholar]
- 31. Bernstein H, Bernstein C, Payne C, Dvorakova K, Garewal H. Bile acids as carcinogens in human gastrointestinal cancers. Mutat Res. 2005;589:47‐65. [DOI] [PubMed] [Google Scholar]
- 32. Wang L, Liu L, Shi Y, et al. Berberine induces caspase‐independent cell death in colon tumor cells through activation of apoptosis‐inducing factor. PLoS One. 2012;7:e36418. [DOI] [PMC free article] [PubMed] [Google Scholar]
- 33. Weir TL, Manter DK, Sheflin AM, Barnett BA, Heuberger AL, Ryan EP. Stool microbiome and metabolome differences between colorectal cancer patients and healthy adults. PLoS One. 2013;8:e70803. [DOI] [PMC free article] [PubMed] [Google Scholar]
- 34. Ganesh BP, Klopfleisch R, Loh G, Blaut M. Commensal Akkermansia muciniphila exacerbates gut inflammation in Salmonella Typhimurium‐infected gnotobiotic mice. PLoS One. 2013;8:e74963. [DOI] [PMC free article] [PubMed] [Google Scholar]
- 35. Yu H, Pardoll D, Jove R. STATs in cancer inflammation and immunity: a leading role for STAT3. Nat Rev Cancer. 2009;9:798‐809. [DOI] [PMC free article] [PubMed] [Google Scholar]
- 36. Grivennikov S, Karin E, Terzic J, et al. IL‐6 and Stat3 are required for survival of intestinal epithelial cells and development of colitis‐associated cancer. Cancer Cell. 2009;15:103‐113. [DOI] [PMC free article] [PubMed] [Google Scholar]
- 37. Zhong Z, Wen Z, Darnell J, Jr . Stat3: a STAT family member activated by tyrosine phosphorylation in response to epidermal growth factor and interleukin‐6. Science. 1994;264:95‐98. [DOI] [PubMed] [Google Scholar]
- 38. Ogura H, Murakami M, Okuyama Y, et al. Interleukin‐17 promotes autoimmunity by triggering a positive‐feedback loop via interleukin‐6 induction. Immunity. 2008;29:628‐636. [DOI] [PubMed] [Google Scholar]
- 39. Peto J. Cancer epidemiology in the last century and the next decade. Nature. 2001;411:390‐395. [DOI] [PubMed] [Google Scholar]
- 40. Marquesvidal P, Ravasco P, Ermelindacamilo M. Foodstuffs and colorectal cancer risk: a review. Clin Nutr. 2006;25:14‐36. [DOI] [PubMed] [Google Scholar]
- 41. Reddy BS. Diet and excretion of bile acids. Cancer Res. 1981;41:3766‐3768. [PubMed] [Google Scholar]
- 42. Hepner GW, Hofmann AF, Malagelada JR, Szczepanik PA, Klein PD. Increased bacterial degradation of bile acids in cholecystectomized patients. Gastroenterology. 1974;66:556‐564. [PubMed] [Google Scholar]
- 43. Giovannucci E, Colditz GA, Stampfer MJ. A meta‐analysis of cholecystectomy and risk of colorectal cancer. Gastroenterology. 1993;105:130‐141. [DOI] [PubMed] [Google Scholar]
- 44. Stacey M, Webb M. Studies on the antibacterial properties of the bile acids and some compounds derived from cholanic acid. Proc R Soc Med. 1947;134:523‐537. [DOI] [PubMed] [Google Scholar]
- 45. Wahlström A, Sayin SI, Marschall HU, Bäckhed F. Intestinal crosstalk between bile acids and microbiota and its impact on host metabolism. Cell Metab. 2016;24:41‐50. [DOI] [PubMed] [Google Scholar]
- 46. Louis P, Hold GL, Flint HJ. The gut microbiota, bacterial metabolites and colorectal cancer. Nat Rev Microbiol. 2014;12:661‐672. [DOI] [PubMed] [Google Scholar]
- 47. Donohoe DR, Holley D, Collins LB, et al. A gnotobiotic mouse model demonstrates that dietary fiber protects against colorectal tumorigenesis in a microbiota‐ and butyrate‐dependent manner. Cancer Discov. 2014;4:1387‐1397. [DOI] [PMC free article] [PubMed] [Google Scholar]
- 48. Wilson AJ, Chueh AC, Togel L, et al. Apoptotic sensitivity of colon cancer cells to histone deacetylase inhibitors is mediated by an Sp1/Sp3‐activated transcriptional program involving immediate‐early gene induction. Cancer Res. 2010;70:609‐620. [DOI] [PMC free article] [PubMed] [Google Scholar]
- 49. O'Keefe SJD. Diet, microorganisms and their metabolites, and colon cancer. Nat Rev Gastroenterol Hepatol. 2016;13:691‐706. [DOI] [PMC free article] [PubMed] [Google Scholar]
- 50. Furusawa Y, Obata Y, Fukuda S, et al. Commensal microbe‐derived butyrate induces the differentiation of colonic regulatory T cells. Nature. 2013;504:446‐450. [DOI] [PubMed] [Google Scholar]
- 51. Smith PM, Howitt MR, Panikov N, et al. The microbial metabolites, short‐chain fatty acids, regulate colonic Treg cell homeostasis. Science. 2013;341:569‐573. [DOI] [PMC free article] [PubMed] [Google Scholar]
- 52. Borges‐Canha M, Portela‐Cidade JP, Dinis‐Ribeiro M, Leite‐Moreira AF, Pimentel‐Nunes P. Role of colonic microbiota in colorectal carcinogenesis: a systematic review. Rev Esp Enferm Dig. 2015;107:659‐671. [DOI] [PubMed] [Google Scholar]
- 53. Derrien M, Vaughan EE, Plugge CM, de Vos WM. Akkermansia muciniphila gen. nov., sp. nov., a human intestinal mucin‐degrading bacterium. Int J Syst Evol Microbiol. 2004;54:1469‐1476. [DOI] [PubMed] [Google Scholar]
- 54. Dingemanse C, Belzer C, van Hijum SAFT, et al. Akkermansia muciniphila and Helicobacter typhlonius modulate intestinal tumor development in mice. Carcinogenesis. 2015;36:1388‐1396. [DOI] [PubMed] [Google Scholar]
- 55. Baxter NT, Zackular JP, Chen GY, Schloss PD. Structure of the gut microbiome following colonization with human feces determines colonic tumor burden. Microbiome. 2014;2:20. [DOI] [PMC free article] [PubMed] [Google Scholar]
- 56. Song S, Byrd JC, Koo JS, Bresalier RS. Bile acids induce MUC2 overexpression in human colon carcinoma cells. Cancer. 2005;103:1606‐1614. [DOI] [PubMed] [Google Scholar]
- 57. Femia AP, Dolara P, Giannini A, Salvadori M, Biggeri A, Caderni G. Frequent mutation of Apc gene in rat colon tumors and mucin‐depleted foci, preneoplastic lesions in experimental colon carcinogenesis. Cancer Res. 2007;67:445‐449. [DOI] [PubMed] [Google Scholar]
- 58. Song P, Zhang Y, Klaassen CD. Dose‐response of five bile acids on serum and liver bile acid concentrations and hepatotoxicty in mice. Toxicol Sci. 2011;123:359‐367. [DOI] [PMC free article] [PubMed] [Google Scholar]
- 59. Mantovani A, Allavena P, Sica A, Balkwill F. Cancer‐related inflammation. Nature. 2008;454:436‐444. [DOI] [PubMed] [Google Scholar]
- 60. Coussens LM, Zitvogel L, Palucka AK. Neutralizing tumor‐promoting chronic inflammation: a magic bullet? Science. 2013;339:286‐291. [DOI] [PMC free article] [PubMed] [Google Scholar]
- 61. Guo Y, Luan L, Patil NK, Sherwood ER. Immunobiology of the IL‐15/IL‐15Rα complex as an antitumor and antiviral agent. Cytokine Growth Factor Rev. 2017;38:10‐21. [DOI] [PMC free article] [PubMed] [Google Scholar]
- 62. Morikawa T, Baba Y, Yamauchi M, et al. STAT3 expression, molecular features, inflammation patterns, and prognosis in a database of 724 colorectal cancers. Clin Cancer Res. 2011;17:1452‐1462. [DOI] [PMC free article] [PubMed] [Google Scholar]
- 63. Kawada M, Seno H, Uenoyama Y, et al. Signal transducers and activators of transcription 3 activation is involved in nuclear accumulation of beta‐catenin in colorectal cancer. Cancer Res. 2006;66:2913‐2917. [DOI] [PubMed] [Google Scholar]
- 64. Ren W, Shen S, Sun Z, et al. Jak‐STAT3 pathway triggers DICER1 for proteasomal degradation by ubiquitin ligase complex of CUL4A(DCAF1) to promote colon cancer development. Cancer Lett. 2016;375:209‐220. [DOI] [PubMed] [Google Scholar]
Associated Data
This section collects any data citations, data availability statements, or supplementary materials included in this article.
Supplementary Materials
Supplementary information
Supplementary information
Supplementary information
Supplementary information