

Abstract
Myosteatosis is the pathologic accumulation of lipid that can occur in conjunction with atrophy and fibrosis following skeletal muscle injury. Little is known about the mechanisms by which lipid accumulates in myosteatosis, but many clinical studies have demonstrated that the degree of lipid infiltration negatively correlates with muscle function and regeneration. Our objective was to determine the pathologic changes that result in lipid accumulation in injured muscle fibers. We used a rat model of rotator cuff injury in this study because the rotator cuff muscle group is particularly prone to the development of myosteatosis after injury. Muscles were collected from uninjured controls or 10, 30, or 60 d after injury and analyzed using a combination of muscle fiber contractility assessments, RNA sequencing, and undirected metabolomics, lipidomics, and proteomics, along with bioinformatics techniques to identify potential pathways and cellular processes that are dysregulated after rotator cuff tear. Bioinformatics analyses indicated that mitochondrial function was likely disrupted after injury. Based on these findings and given the role that mitochondria play in lipid metabolism, we then performed targeted biochemical and imaging studies and determined that mitochondrial dysfunction and reduced fatty acid oxidation likely leads to the accumulation of lipid in myosteatosis.—Gumucio, J. P., Qasawa, A. H., Ferrara, P. J., Malik, A. N., Funai, K., McDonagh, B., Mendias, C. L. Reduced mitochondrial lipid oxidation leads to fat accumulation in myosteatosis.
Keywords: muscle injury, rotator cuff, fatty degeneration, muscle atrophy
Skeletal muscle often displays chronic degenerative changes following injury, including atrophy and weakness of muscle fibers and fibrotic changes to the extracellular matrix (ECM) (1–4). Some muscles also display a pathologic accumulation of lipid in response to chronic injury or disease, which is referred to as myosteatosis or fatty degeneration (5, 6). The rotator cuff muscle group, which is composed of the supraspinatus (SSP), infraspinatus, teres minor, and subscapularis, moves and stabilizes the shoulder joint and is particularly prone to developing myosteatosis after injury (7, 8). Chronic tears of the rotator cuff, which nearly always involve a tear to the distal tendon of the SSP, infraspinatus, or subscapularis and have similar clinical presentation and pathologic changes, are among the most frequent upper-extremity injuries in patients, with >250,000 surgical repairs performed annually in the United States (7, 9). Patients with these injuries have a 30% reduction in muscle fiber force production and degenerative changes to the motor endplate consistent with partial denervation (1, 10). Lipid accumulation in injured rotator cuff muscles is correlated with muscle weakness and poor patient outcomes following surgical repair (8, 11). Additionally, for most patients, the muscle does not regain strength and function despite undergoing postoperative strengthening exercises in rehabilitation, and nearly 40% of patients will actually continue to develop more atrophy and fat accumulation after the repair (8). As excess lipid appears to play a negative role in muscle regeneration, developing therapeutic interventions to reduce myosteatosis may improve outcomes for patients with chronic muscle injuries and diseases. However, the mechanisms that lead to the pathologic buildup of lipid within muscle fibers are not well understood.
Our objective in the current study was to gain greater insight into the biochemical pathways and cellular factors that lead to myosteatosis after skeletal muscle injury. We used a rat model of rotator cuff tears in which the SSP muscle was denervated and detached from the humerus by removing the distal tendon. Muscles were then harvested either 10, 30, or 60 d after the injury and compared with SSP muscles of uninjured rats. We divided the study into 2 parts. First, we evaluated changes in muscle fiber force production and performed a broad analysis of the changes in the muscle lipidome, metabolome, transcriptome, and proteome using mass spectrometry and RNA sequencing (RNA-seq) techniques. Bioinformatics tools were used to identify potential cellular processes and molecular targets that were disrupted as a result of rotator cuff injury. This analysis identified mitochondrial dysfunction as a strong candidate in causing pathologic changes after muscle injury. Based on these results, in the second half of the study, we tested the hypothesis that pathologic lipid accumulation occurs in torn rotator cuffs because of mitochondrial dysfunction and reduced lipid oxidation.
MATERIALS AND METHODS
Animals
This study was approved by the University of Michigan Institutional Animal Care and Use Committee. A total of 40 adult male 6-mo-old retired-breeder Sprague-Dawley rats were used in this study (n = 10 per group). The rat rotator cuff tenectomy and denervation model was chosen because of anatomic similarity to humans and because the model mimics many of the pathologic changes observed in patients with chronic rotator cuff tears such as fiber atrophy, lipid accumulation, and fibrosis (1, 3, 12–14). Additionally, the degree of retraction of both chronic human and rat SSP tears is ∼20% (15–17), suggesting similarities in changes to the muscle architecture between the rat model and patients with SSP tears. Bilateral SSP tears were administered as previously described in refs. 12, 14, and 15. Animals were deeply anesthetized with 2% isoflurane, and the surgical area was shaved and scrubbed with chlorhexidine. A deltoid-splitting transacromial approach was used to expose the SSP tendon. A tenectomy was performed to remove the tendon because the tendons of rats can spontaneously reattach to the humerus or surrounding fascia (18). The tenectomy was performed by attaching a surgical clamp to the distal end of the tendon and then finely detaching the tendon from its footprint on the humeral head. Using the clamp to maintain tension, the tendon was then finely transected just distal to the myotendinous junction, allowing for removal of the tendon without directly causing damage to the muscle during the procedure. Following tenectomy, the suprascapular nerve was located, and a ∼3–4-mm segment was removed to denervate the muscle. An overview of the tenectomy and denervation procedure is provided in Fig. 1A. The deltoid muscle and skin were then closed, and the animals were allowed to recover in their cages. Rats were treated with buprenorphine twice postoperatively (0.05 mg/kg; Reckitt Benckiser, Slough, United Kingdom) and a single dose of carprofen (5 mg/kg; Zoetis, Parsippany-Troy Hills, NJ, USA). Animals were closely monitored thereafter for signs of pain or distress. After a period of either 10, 30, or 60 d, animals were anesthetized with sodium pentobarbital (40 mg/kg; Vortech Pharmaceuticals, Dearborn, MI, USA), and SSP muscles were harvested and weighed and portions were prepared for either histology or single-fiber contractility. The remaining tissue was finely minced and snap frozen in 25–50-mg aliquots for biochemical and molecular biology measures. Animals were then euthanized by overdose of sodium pentobarbital followed by induction of a bilateral pneumothorax.
Figure 1.

Experimental overview. A) Overview of the surgical model, demonstrating a tenectomy and denervation of the SSP muscle by removal of a segment of the branch of the suprascapular nerve that innervates the SSP muscle. The infraspinatus and the branch of the suprascapular nerve that innervates the infraspinatus, which passes deep to the SSP and through the spinoglenoid notch, was left intact and innervated. The 2 other rotator cuff muscles, the teres minor and subscapularis, were also left intact and innervated but are not illustrated. The spine of the scapula and acromion are also not shown for clarity of illustration. B, C) Overview of experimental setup demonstrating the position of the fiber in the testing apparatus (B) and the procedure to measure CSA obtained from 5 equally spaced regions along the length of the fiber (C). D) An illustrative force trace demonstrating an isometric contraction in response to calcium stimulation and equations to determine sFo from Fo and CSA.
Histology
Histology was performed as described by Gumucio et al. (12). Distal portions of the SSP were placed in tragacanth gum and snap frozen in isopentane cooled with liquid nitrogen. The 10-μm sections were fixed with 4% paraformaldehyde, incubated in 0.2% Triton X-100, and then stained with wheat germ agglutinin (WGA) conjugated to Alexa Fluor 555 (Thermo Fisher Scientific, Waltham, MA, USA) to label the ECM, DAPI (MilliporeSigma, Burlington, MA, USA) to identify nuclei, and boron-dipyrromethene (BODIPY) 493/503 (Thermo Fisher Scientific) to label neutral lipids. To calculate fiber cross-sectional areas (CSAs), images of WGA- and DAPI-stained sections were taken on an Evos FL microscope (Thermo Fisher Scientific), and CSAs were calculated using ImageJ (National Institutes of Health, Bethesda, MD, USA). Images stained with WGA, DAPI, and BODIPY were taken using the AxioPhot system (Carl Zeiss, Oberkochen, Germany).
Muscle fiber contractility
The contractility of chemically permeabilized muscle fibers was performed as previously described (1, 12). Briefly, fiber bundles were dissected from the proximal region of SSP muscles, placed in skinning solution for 30 min, and then placed in storage solution for 16 h at 4°C followed by storage at −80°C. On the day of contractility testing, samples were thawed slowly on ice, and individual fibers were pulled from bundles using fine mirror-finished forceps. Fibers were then placed in a chamber containing relaxing solution and secured at 1 end to a servomotor (Aurora Scientific, Aurora, ON, Canada) and the other end to a force transducer (Aurora Scientific) with 2 ties of 10-0 monofilament nylon suture. Using a laser diffraction measurement system, fiber length was adjusted to obtain a sarcomere length of 2.5 µm. The mean fiber CSA was calculated assuming an elliptical cross section, with diameters obtained at 5 positions along the length of the fiber from high-magnification images taken of top and side views. Because the permeabilization process causes swelling of fibers, the CSAs measured with this technique will be greater than those measured using histology (19). Maximum isometric force (Fo) was elicited by immersing the fiber in a high calcium activation solution. Specific maximum isometric force (sFo) was calculated by dividing Fo by fiber CSA. An overview of the experimental setup and formulas is shown in Fig. 1B–D. Fibers were categorized as fast or slow by examining their force response to rapid, constant-velocity shortening maneuver in which slow fibers are unable to maintain force production while shortening, whereas fast fibers contract rapidly enough to maintain force as they shorten (20). A total of 10–20 fast fibers were tested from each SSP muscle.
Western blots
Western blots were performed as described by Sugg et al. (21). Protein was isolated from snap-frozen 25-mg aliquots of muscle tissue and placed in 500 μl of a solution containing Total Protein Extraction Reagent (Thermo Fisher Scientific) with 1% Nonidet P-40 and 1% protease-phosphatase inhibitor (Thermo Fisher Scientific). Samples were homogenized, vortexed at 4°C for 30 min, and then centrifuged at 12,000 g for 15 min at 4°C. The supernatant was collected and saved at −80°C until use. The pellets of insoluble proteins were saved for hydroxyproline assays as described below. Protein concentration was determined with a bicinchoninic acid assay (Thermo Fisher Scientific). Protein (20–100 μg) was loaded into 6–12% polyacrylamide gels and subjected to electrophoretic separation. Proteins were transferred onto nitrocellulose membranes (Bio-Rad, Hercules, CA, USA) and blocked for 1 h in 3–5% skim milk. Membranes were rinsed and incubated overnight in primary antibodies at a concentration of 1:1000 against either glutathione (101A; ViroGen, Watertown, MA, USA), succinate dehydrogenase-A (SDHA, 11998; Cell Signaling Technology, Danvers, MA, USA), cytochrome c oxidase subunit 4 (COX4, 4850; Cell Signaling Technology), phosphorylated (p)–IGF1R Y1135 (3918; Cell Signaling Technology), IGF1R (9750; Cell Signaling Technology), p-ERK1/2 T202/Y204 (4370; Cell Signaling Technology), ERK1/2 (4695; Cell Signaling Technology), p–protein kinase B (Akt) S473 (4060; Cell Signaling Technology), Akt (4691; Cell Signaling Technology), p–p70S6 kinase (p70S6K) T389 (9234; Cell Signaling Technology), p-p70S6K T421/S424 (9204; Cell Signaling Technology), p70S6K (2708; Cell Signaling Technology), p–ribosomal protein S6 (rpS6) S235/S236 (4858; Cell Signaling Technology), rpS6 (2217; Cell Signaling Technology), p62 (129012; Abcam, Cambridge, United Kingdom), ULK1 (128859; Abcam), PINK1 (23707; Abcam), Parkin (15954; Abcam), peroxiredoxin (Prdx) 3 (128953; Abcam), or Prdx6 (133348; Abcam). After primary antibody incubation, membranes were rinsed and incubated in goat anti-rabbit or goat anti-mouse horseradish peroxidase–conjugated secondary antibodies (from either Abcam or Cell Signaling Technology). Proteins were detected using Clarity Western ECL Substrate (Bio-Rad) or Super Signal West Dura (Thermo Fisher Scientific) and imaged and quantified using a ChemiDoc chemiluminescent detection system (Bio-Rad). Phosphoprotein quantification between blots was normalized to pooled standards run in each gel to allow us to assess the magnitude of signal transduction across tissues. Coomassie or Ponceau S staining of membranes was performed to verify equal protein loading.
Hydroxyproline content
Hydroxyproline was measured from the insoluble fraction remaining from the isolation of soluble proteins for Western blots. Pellets were dried at 100°C overnight, weighed immediately, and then hydrolyzed in 12 M hydrochloric acid. Samples were then evaporated in a SpeedVac (Thermo Fisher Scientific), and hydroxyproline was determined using a colorimetric assay as previously described by Mendias et al. (22).
Electron microscopy
Portions of distal SSP muscles were fixed in 1% tannic acid and 1% glutaraldehyde in Sorenson’s buffer followed by postfixation in 2% osmium tetroxide (Electron Microscopy Sciences, Hatfield, PA, USA). Samples were then dehydrated using a graded ethanol series and embedded in Embed 812 (Electron Microscopy Sciences) using a graded resin and propylene oxide series. The 1-μ transverse sections were cut with a diamond knife ultramicrotome and imaged using a Jeol 1400-plus transmission electron microscope (Jeol, Tokyo, Japan) with a high-resolution digital camera (AMT, Woburn, MA, USA).
Lipidomics and metabolomics
The University of Michigan Metabolomics Core performed mass spectrometry–based shotgun lipidomics and metabolomics measurements from snap-frozen, homogenized muscle samples as previously described in refs. 23 and 24. For lipidomics, lipids were extracted from samples with a solvent mixture consisting of 2:2:2 (v/v/v) methanol:dichloromethane:water at room temperature after adding internal standard mixture. After drying, the samples were resuspended in a solution containing 1:5:85 (v/v/v) acetonitrile:water:isopropanol and 10 mM ammonium acetate. Samples were then subjected to liquid chromatrography–mass spectrometry (MS), and MS peaks were matched in silico with LipidBlast (25). Quantification was performed by Multiquant software (Danaher, Washington, DC, USA). For metabolomics, metabolites were extracted from frozen muscle in a solvent mixture containing 8:1:1 methanol:chloroform:water (v/v/v). Reverse phase liquid chromatography–quadrupole tandem MS (MS/MS) was used to measure acylcarnitines (26). Other metabolites were derivatized and analyzed with GC-MS. Quantification of metabolites was performed using Masshunter Quantitative Analysis software (Agilent Technologies, Santa Clara, CA, USA). Normalized abundance data for all measured metabolites is provided in Supplemental Material S1.
RNA-seq and gene expression
Snap-frozen aliquots of muscle tissue were homogenized in Qiazol (Qiagen, Hilden, Germany) and isolated using an miRNeasy kit (Qiagen). RNA concentration was determined using a NanoDrop 2000 (Thermo Fisher Scientific). For each sample, 250 ng total RNA was delivered to the University of Michigan Sequencing Core for RNA-seq analysis. Sample concentrations were normalized, and cDNA pools were created for each sample and then subsequently tagged with a barcoded oligo adapter to allow for sample-specific resolution. Sequencing was carried out using an Illumina HiSeq 2500 platform (Illumina, San Diego, CA, USA) with 50-bp single-end reads. Raw RNA-seq data was quality checked using FastQC v0.10.0 (Barbraham Bioinformatics, Cambridge, United Kingdom). Alignment to the reference genome (rn5, University of California–Santa Cruz, CA, USA), differential expression based on counts per million mapped reads, and postanalysis diagnostics were carried out using the Tuxedo Suite software package (27). RNA-seq data has been deposited to the National Institutes of Health (Bethesda, MD, USA) Gene Expression Omnibus (GEO) (accession GSE103266; https://www.ncbi.nlm.nih.gov/geo/), and normalized counts per million mapped reads values for all measured genes are provided in Supplemental Material S1.
To validate fold-change RNA-seq data, we performed quantitative PCR (qPCR) on a select set of genes. RNA was reverse transcribed into cDNA with iScript Reverse Transcription Supermix (Bio-Rad). Amplification of cDNA was performed in a CFX96 real-time thermal cycler (Bio-Rad) using iTaq Universal SYBR Green Supermix (Bio-Rad). Target gene expression was normalized to the stable housekeeping gene eukaryotic translation initiation factor 2B subunit β, and further normalized to 0 d samples using the 2−ΔΔCt method. Primer sequences are provided in Supplemental Material S2.
Proteomics
Label-free proteomic analysis was performed as described by McDonagh et al. (28). Aliquots were homogenized in 50 mM ammonium bicarbonate containing 25 mM N-ethyl-d0-malemide (d (0) NEM), pH 8. Protein lysates were prepared by centrifugation at 15,000 g for 10 min at 4°C, and protein concentrations were calculated using a Bradford assay (Bio-Rad) with bovine serum albumin as a standard. Excess d (0) NEM was removed using Zeba desalting columns (Thermo Fisher Scientific), and protein concentrations were determined again by Bradford assay as before. A total of 100 µg of protein extract was diluted to 160 µl with 25 mM ammonium bicarbonate, denatured by the addition of 10 µl of 1% RapiGest (Waters, Milford, MA, USA) in 25 mM ammonium bicarbonate, and incubated at 80°C for 10 min with shaking. Then, 10 µl of a 100-mM solution of Tris(2-carboxyethyl)phosphine hydrochloride was added to reduce reversibly oxidized cysteine (Cys) residues, followed by incubation at 60°C for 10 min. Newly reduced Cys was then alkylated by addition of N-ethyl-d5-malemide and incubated at room temperature for 30 min. An aliquot of the samples was used at this point to check the procedure by SDS-PAGE. Proteolytic digestion was performed by addition of trypsin followed by overnight incubation at 37°C. Digestion was terminated, and RapiGest was removed by acidification (3 µl TFA incubated at 37°C for 45 min) and centrifugation (15,000 g for 15 min).
Samples were analyzed using an Ultimate 3000 RSLC Nano system (Thermo Fisher Scientific) coupled to a QExactive mass spectrometer (Thermo Fisher Scientific). A total of 2 µl of sample corresponding to 1 µg of protein was diluted in 18 µl buffer (97% H2O, 3% acetonitrile, and 0.1% formic acid v/v), and 5 µl (250 ng of protein) was loaded onto the trapping column (PepMap 100, C18, 75 µm × 20 mm; Thermo Fisher Scientific) using partial loop injection for 7 min at a flow rate of 4 µl/min with 0.1% (v/v) TFA. Samples were resolved on the analytical column (Easy-Spray C18 75 µm × 400 mm, 2-µm column; Thermo Fisher Scientific) using gradient of 97% A (0.1% formic acid) and 3% B (99.9% acetonitrile and 0.1% formic acid) to 60% A and 40% B over 120 min at a flow rate of 300 nl/min. Data-dependent acquisition consisted of a 70,000-resolution full-scan MS scan (automatic gain control set to 106 ions with a maximum fill time of 250 ms), and the 10 most abundant peaks were selected for MS/MS using a 17,000-resolution scan (automatic gain control set to 5 × 10⁴ ions with a maximum fill time of 250 ms) with an ion selection window of 3 m/z and normalized collision energy of 30. Repeated selection of peptides for MS/MS was avoided with a 30-s dynamic exclusion window.
Label-free relative quantification was performed using PEAKS7 software (Bioinformatics Solutions, Waterloo, ON, Canada). The acquired Thermo RAW data files were searched against the Universal Protein (UniProt) rat database (2015-29-07, 32,991 sequences; https://www.uniprot.org/) and analyzed using the following parameters: peptide mass tolerance 10 ppm; fragment mass tolerance 0.01 Da, 1+, 2+, 3 = ions; missed cleavages. Variable modifications included in search were d (0) NEM, d (5) NEM, mon-, di-, and trioxidation of Cys residues, and oxidation of methionine with a false discovery rate (FDR) of <1% searched against the UniProt rat database. Normalization was carried out using the total ion current. PEAKS7 software includes a post-translational modification (PTM) algorithm applying the de novo sequencing module to search for a limited number of PTMs. All identified PTMs using this method adhere to the above search criteria and FDR validation. All proteomics data has been deposited to the ProteomeXchange Consortium (accession PXD009034; http://www.proteomexchange.org/), and normalized abundance data for all measured proteins is provided in Supplemental Material S1.
Bioinformatics
Expression data from RNA-seq measurements was imported into Ingenuity Pathway Analysis (IPA) software (Qiagen) to assist in predicting cellular and molecular pathways and processes involved in myosteatosis. For metabolomics, lipidomics, and proteomics measures, MS peak data was imported into MetaboAnalyst 4.0 software (29) for data visualization, principal component (PC) analysis, and statistical analyses.
Mitochondrial DNA measurements
Mitochondrial genome copy number quantification was performed with modifications from a previous study (30). Total DNA was isolated from aliquots of muscle tissue using the DNeasy Blood and Tissue Kit (Qiagen). DNA was amplified via qPCR as described above with custom primers for mitochondrial DNA (mtDNA) and β-2-microglobulin genomic DNA (gDNA) (Supplemental Material S2). Using known standards of rat DNA, standard curves were generated for each primer set to determine number of copies of either mtDNA or gDNA. The ratio of mtDNA:gDNA was calculated per sample, and the mean was calculated across groups.
Mitochondrial enzymatic assays
Freshly minced SSP tissue (50 mg) was isolated and placed in 500 μl ice-cold PBS containing protease inhibitor (Thermo Fisher Scientific). Samples were homogenized, and then 100 μl of 10% laurel maltoside and 400 μl cold PBS with protease inhibitor was added. Samples were incubated on ice for 30 min and then centrifuged at 12,000 g for 20 min at 4°C. Samples were stored at −80°C until use. On the day of measurement, samples were thawed on ice, and protein concentration was determined using a bicinchoninic acid assay (Thermo Fisher Scientific). Colorimetric enzymatic assays for mitochondrial complex I, II, and IV were performed as per the manufacturer’s protocol (Abcam). Sample concentration was optimized per assay in pilot experiments, and equal protein was loaded per well. Samples were measured in duplicate in a BioTek Epoch2 microplate spectrophotometer (BioTek Instruments, Winooski, VT, USA). Optical density of enzymatic activity per minute was calculated per the manufacturer’s protocol.
Pyruvate and palmitate oxidation measurements
Samples were placed into ice-cold medium containing 250 mM sucrose, 1 mM EDTA, 10 mM Tris-HCl, and 2 mM ATP (pH 7.4). To isolate intact mitochondria, muscles were finely minced in 20 µl of medium per milligram of muscle and homogenized in a glass homogenization tube with a motor-driven Teflon pestle (31). Pyruvate and palmitate oxidation assays were performed as previously described (with minor modification) by Kim et al. (32). Briefly, 80 µl tissue homogenate was added to incubation wells on a sealed, modified, 48-well plate with a channel cut between the adjacent trap wells. The trap wells contained 200 µl of 1 M sodium hydroxide for the collection of liberated 14CO2. A total of 2 volumes of incubation buffer (100 mM sucrose, 10 mM Tris-HCl, 5 mM potassium phosphate, 80 mM potassium chloride, 1 mM magnesium chloride, 0.1 mM malate, 2 mM ATP, 1 mM DTT, 0.2 mM EDTA, 1 mM l-carnitine, 0.05 mM coenzyme A (CoA), and 0.5% fatty acid–free bovine serum albumin, pH 7.4) was added to the wells to initiate the reaction with 1 mM pyruvate ([2-14C]pyruvate at 0.5 µCi/ml) or 0.2 mM palmitate ([1-14C]palmitate at 0.5 µCi/ml). Following 60 min of incubation at 37°C, 100 µl of 70% perchloric acid was added to terminate the reaction. The trap wells were sampled for label incorporation into 14CO2, which was determined by scintillation counting using 4 ml of Uniscint BD (National Diagnostics, Atlanta, GA, USA).
Statistics
Differences between groups were measured using 1-way ANOVA (α = 0.05) followed by Fisher’s least significant difference post hoc sorting (α = 0.05), or Kruskal-Wallis tests (α = 0.05) followed by Dunn’s post hoc sorting (α = 0.05). An FDR multiple-observation adjustment (q < 0.05) was applied to metabolomic, lipidomic, proteomic, and RNA-seq data. Statistical analyses were performed using Prism 6.0 (GraphPad Software, La Jolla, CA, USA), Tuxedo, or MetaboAnalyst 4.0 (29).
RESULTS
Following muscle injury, the mass of muscles and size of muscle fibers decreased over time (Fig. 2A, B). Collagen content also accumulated after muscle injury, with a near 4-fold increase at 30 and 60 d compared with controls (Fig. 2C). An accumulation of lipids within muscle fibers was noted after muscle injury in both high-magnification histology and electron microscopy, as well as disrupted myofibril architecture (Fig. 2D, 3A). Centrally located nuclei were also noted 10 d after injury (Fig. 2D). In addition to a reduction in size, muscle fibers were also weaker, both in terms of absolute maximum isometric force and specific force (Fig. 3B–D).
Figure 2.

Changes in muscle mass, fiber size, collagen content, and lipid accumulation after rotator cuff tear. A–C) Mass (A), muscle fiber histology CSA values (B), and hydroxyproline content of muscles following rotator cuff tear (C). D) Representative histology of areas of muscle demonstrating lipid accumulation, with neutral lipids in green, ECM in red, and nuclei in blue. Scale bar for each panel is 20 μm. Arrowheads indicate centrally located nuclei at 10 d. Data are presented as means ± sd, n ≥ 6 muscles per group. Post hoc sorting (P < 0.05): a, different from 0 d; b, different from 10 d; c, different from 30 d.
Figure 3.

Changes in myofibrillar architecture and muscle fiber contractility after rotator cuff tear. A) Representative electron micrographs taken in the middle of the fiber demonstrating disrupted sarcomere ultrastructure in SSP muscles following injury. Scale bar for each panel is 2 μm. Arrowheads indicate lipid-laden mitochondria. B–D) CSA (B), Fo (C), and sFo (D) of permeabilized muscle fibers from control and injured muscles. n = 10 muscles per group. Post hoc sorting (P < 0.05): a, different from 0 d; b, different from 10 d; c, different from 30 d.
Given the reduction in muscle fiber size, we then measured activation of the IGF1 and ERK pathways because of their importance in maintaining muscle mass (Fig. 4). Reduced proximal IGF1 and ERK signaling was observed after muscle injury, with corresponding reductions in Akt S473 and p70S6K T421 and S424, although rpS6 S235 and S236 phosphorylation was increased 10 and 30 d after muscle injury (Fig. 4).
Figure 4.

Changes in IGF1 signaling after rotator cuff tear. A–F) Quantification of band densitometry of p-IGF1R Y1135 (A), p-ERK1/2 T202/Y204 (B), p-Akt S473 (C), p-p70S6K T389 (D), p-p70S6K T421/S424 (E), and p-rpS6 S235/S236 (F) following rotator cuff tear normalized first to total protein and then to pooled standards across membranes. G) Representative phospho and total-protein Western blots with a Coomassie-stained membrane as a loading control. Data are presented as means ± sd, n = 6 per group. Post hoc sorting (P < 0.05): a, different from 0 d; b, different from 10 d; c, different from 30 d.
To further quantify and explore the grossly apparent lipid that accumulated after rotator cuff tear, we performed shotgun lipidomics and detected 457 lipid species, with summary data presented in Fig. 5. In general, PC analysis demonstrated that the 10-d injury group diverged somewhat from uninjured muscles, whereas the 30- and 60-d injury groups were fairly distinct from uninjured muscles but had some overlap with the 10-d group (Fig. 5A). For free fatty acids (FFAs), there was an increase in oleate, palmitate, and stearate 30 and 60 d after rotator cuff tear (Fig. 5B). Triglycerides (TGs) were the major class of lipid species measured in muscle tissues and increased by over 3-fold at the 60-d time point (Fig. 5C). Ceramide phosphates, sphingomyelins, phosphatidylglycerols, phosphatidylinositols, and phosphatidylserines (Fig. 5G, H, J–L) displayed similar patterns of change as TGs, whereas diglycerides (DGs), monoglycerides, cholesterol esters, phosphatidic acids, phosphatidylcholines, phosphatidylethanolamines, lysophosphatidylcholines, lysophosphatidylethanolamines, and plasmenyl-phosphatidylcholines (Fig. 5D–F, I, M–Q) displayed biphasic responses. No differences in plasmenyl-phosphatidylethanolamines (Fig. 5R) were observed.
Figure 5.

Changes in lipid species after rotator cuff tear. A) Principal component (PC) analysis of groups C-R. B–R) Levels of FFAs (B), TGs (C), DGs (D), monoglycerides (MGs) (E), cholesterol ester (CE) (F), ceramide phosphates (CerPs) (G), sphingomyelins (SMs) (H), phosphatidic acids (PAs) (I), phosphatidylglycerols (PGs) (J), phosphatidylinositols (PIs) (K), phosphatidylserines (PSs) (L), phosphatidylcholines (PCs) (M), phosphatidylethanolamines (PEs) (N), lysophosphatidylcholines (LysoPCs) (O), lysophosphatidylethanolamines (LysoPEs) (P), plasmenyl-phosphatidylcholines (Plasmenyl PCs) (Q), and plasmenyl-phosphatidylethanolamines (Plasmenyl PEs) (R) as measured by mass spectrometry and presented as relative peak intensity (RPI). Data are presented as means ± sd, n = 10 muscles per group (A, C–R); n = 5 muscles per group (B). Post hoc sorting (P < 0.05): a, different from 0 d; b, different from 10 d; c, different from 30 d.
Next, we analyzed the levels of 68 small molecule metabolites important for muscle function. Select metabolites are presented in Fig. 6, with additional species listed in Supplemental Material S1. There was a general similarity of metabolites at the 0- and 10-d time points and at the 30- and 60-d time points (Fig. 6A). Several nucleoside and nucleotide metabolites, such as ADP, cytidine monophosphate, guanosine monophosphate, NAD, and uridine monophosphate decreased after rotator cuff tear (Fig. 6B). An increase in metabolites involved in glycolysis and pentose phosphate metabolism, such as fructose-bisphosphate, hexoses, hexose-phosphate, and phosphoenolpyruvate, increased at 30 and 60 d after muscle injury (Fig. 6D). There were changes in only a few free amino acids such as alanine, aspartate, threonine, and tryptophan (Fig. 6E), and no changes were observed in the creatine phosphate shuttle, Krebs cycle metabolites, or free glutathione after injury (Fig. 6C, F, H).
Figure 6.

Changes in metabolites after rotator cuff tear. A) Principal component (PC) analysis of groups. B–G) Baseline normalized heatmaps demonstrating levels of selected nucleotide and nucleoside metabolites (B), creatine and phosphocreatine (C), glycolysis and pentose phosphate metabolites (D), free amino acids (E), Krebs cycle metabolites (F), and oxidized and reduced glutathione (G) as measured by mass spectrometry. n = 5 muscles per group. Post hoc sorting (P < 0.05): a, different from 0 d; b, different from 10 d; c, different from 30 d. 2PG+3PG, 2-phosphoglycerate and 3-phosphoglycerate; CIT+ICIT, citrate and isocitrate; CMP, cytidine monophosphate; F6P+G6P, fructose-6-phosphate and glucose-6-phosphate; FAD, flavin adenine dinucleotide; GDP, guanosine diphosphate; GMP, guanosine monophosphate; NAD, nicotinamide adenine dinucleotide; NADP, nicotinamide adenine dinucleotide phosphate; R5P+X5P, ribulose 5-phosphate and xylulose 5-phosphate; UDP, uridine diphosphate; UMP, uridine monophosphate; UTP, uridine triphosphate.
We then performed RNA-seq to analyze global changes in the transcriptome of injured muscles. The PC analyses demonstrated divergence across the different time points, with the 10- and 30-d time points demonstrating the most difference from controls (Fig. 7A). IPA was used to identify potential biologic pathways and functions that were affected by rotator cuff tear, and we observed several processes related to lipid metabolism and mitochondrial function, reactive oxygen species (ROS) production, glycolysis, muscle contraction, ECM production, and inflammation that were predicted to be differentially regulated in myosteatosis (Table 1). We then selected numerous genes related to these processes from RNA-seq to further explore and report in Fig. 7. We also performed qPCR to validate selected genes from the different categories, and generally observed similar trends in differential regulation between RNA-seq and qPCR data (Table 2).
Figure 7.

Changes in the transcriptome after rotator cuff tear. A) Principal component (PC) analysis of overall changes across the transcriptome. B–I) Levels of selected contractile and structural genes (B), autophagy and atrophy genes (C), growth factors and cytokines (D), ECM genes (E), glycolysis genes (F), lipid storage and mobilization genes (G), mitochondrial and oxidative metabolism genes (H), and ROS and peroxisomal oxidation genes (I) as measured by RNA-seq. n = 4 muscles per group. Post hoc sorting (P < 0.05): a, different from 0 d; b, different from 10 d; c, different from 30 d. Acadl, Acyl-Coa Dehydrogenase, Long Chain; Acadm, Acyl-Coa Dehydrogenase, C-4 To C-12 Straight Chain; Acads, Acyl-Coa Dehydrogenase, C-2 To C-3 Short Chain; Aco2, Aconitase 2; Acox1, Acyl-Coa Oxidase 1; Acsl1, Acyl-Coa Synthetase Long-Chain Family Member 1; Acsl6, Acyl-Coa Synthetase Long-Chain Family Member 6; Acsm5, Acyl-Coa Synthetase Medium-Chain Family Member 5; Acss1, Acyl-Coa Synthetase Short-Chain Family Member 1; Agpat1, 1-Acylglycerol-3-Phosphate O-Acyltransferase 1; Agpat3, 1-Acylglycerol-3-Phosphate O-Acyltransferase 3; Agpat6, 1-Acylglycerol-3-Phosphate O-Acyltransferase 6; Agpat9, 1-Acylglycerol-3-Phosphate O-Acyltransferase 9; Aldoa, Aldolase, Fructose-Bisphosphate A; Apoe, Apolipoprotein E; Atp5g1, Atp Synthase, H+ Transporting, Mitochondrial Fo Complex Subunit C1 ; Becn1, Beclin 1; Bmp7, Bone Morphogenetic Protein 7; Capn2, Calpain 2/m-calpain; Cat, Catalase; Cd36, Cd36 Molecule/fatty acid transporter; Col1a1, Collagen Type I Alpha 1 Chain; Col3a1, Collagen Type Iii Alpha 1 Chain; Col4a1, Collagen Type Iv Alpha 1 Chain; Col6a2, Collagen Type Vi Alpha 2 Chain; Col14a1, Collagen Type Xiv Alpha 1 Chain; Cox4i1, Cytochrome C Oxidase Subunit Iv Isoform 1; Cpt1b, Carnitine Palmitoyltransferase 1B; Cpt2, Carnitine Palmitoyltransferase 2; Cs, Citrate Synthase; Cyc1, Cytochrome C-1; Cyp4b1, Cytochrome P450, Family 4, Subfamily B, Polypeptide 1; Des, Desmin; Dgat1, Diacylglycerol O-Acyltransferase 1; Dgat2, Diacylglycerol O-Acyltransferase 2; Dysf, Dysferlin; Eln, Elastin; Eno3, Enolase 3; Fabp4, Fatty Acid Binding Protein 4; Fasn, Fatty Acid Synthase; Fbp2, Fructose-Bisphosphatase 2; Fbxo30, F-Box Protein 30/muscle ubiquitin ligase of SCF complex in atrophy-1 (MUSA-1); Fbxo32, F-Box Protein 32/atrogin-1/MAFbx; Fh, Fumarate Hydratase; Gapdh, Glyceraldehyde-3-Phosphate Dehydrogenase; Gdf11, Growth Differentiation Factor 11; Gpam, Glycerol-3-Phosphate Acyltransferase, Mitochondrial; Gpi, Glucose-6-Phosphate Isomerase; Gpx1, Glutathione Peroxidase 1; Gpx3, Glutathione Peroxidase 3; Hk2, Hexokinase 2; Idh2, Isocitrate Dehydrogenase) 2, Mitochondrial; Igf1, Insulin Like Growth Factor 1; Il1b, Interleukin 1 Beta; Il23a, Interleukin 23 Subunit Alpha; Il6, Interleukin 6; Inhba, Inhibin Beta A Subunit/Activin A; Inhbb, Inhibin Beta B Subunit/Activin B; Lipe, Lipase E, Hormone Sensitive Type; Lpin1, Lipin 1; Lpin2, Lipin 2; Lpin3, Lipin 3; Lpl, Lipoprotein Lipase; Lum, Lumican; Mdh2, Malate Dehydrogenase 2; Mfn1, Mitofusin 1; Mfn2, Mitofusin 2; Mgll, Monoglyceride Lipase; Mmp2, Matrix Metallopeptidase 2; Mmp14, Matrix Metallopeptidase 14; Msn, Moesin; Mstn, Myostatin; Mustn1, Musculoskeletal, Embryonic Nuclear Protein 1; Mybpc1, Myosin Binding Protein C, Slow Type; Mybpc2, Myosin Binding Protein C, Fast Type; Myh1, Myosin, Heavy Chain 1, Skeletal Muscle, Adult (IIX); Myh2, Myosin, Heavy Chain 2, Skeletal Muscle, Adult (IIA); Myh3, Myosin, Heavy Chain 3, Skeletal Muscle, Embryonic; Myh4, Myosin Heavy Chain 4 (IIB); Myh7, Myosin Heavy Chain 7 (I); Myh8, Myosin, Heavy Chain 8, Skeletal Muscle, Perinatal; Myl1, Myosin Light Chain 1; Mypn, Myopalladin; Ndufs1, Nadh:Ubiquinone Oxidoreductase Core Subunit S1; Nedd4, Neural Precursor Cell Expressed, Developmentally Down-Regulated 4, E3 Ubiquitin Protein Ligase; Nfe2l2, Nuclear Factor, Erythroid 2 Like 2; Nrf1, Nuclear Respiratory Factor 1; Ogdh, Oxoglutarate Dehydrogenase; Pdgfb, Platelet Derived Growth Factor Subunit B; Pfkm, Phosphofructokinase, Muscle; Pgam2, Phosphoglycerate Mutase 2; Pgk1, Phosphoglycerate Kinase 1; Pkm, Pyruvate Kinase, Muscle; Plin2, Perilipin 2; Plin5, Perilipin 5; Pnpla3, Patatin Like Phospholipase Domain Containing 3; Pnpla7, Patatin Like Phospholipase Domain Containing 7; Ppargc1a, Pparg Coactivator 1 Alpha; Prdx1, Peroxiredoxin 1; Psma6, Proteasome Subunit Alpha 6; Psmb2, Proteasome Subunit Beta 2; Pygm, Phosphorylase, Glycogen, Muscle; S100a4, S100 Calcium Binding Protein A4/fibroblast specific protein-1; Scx, Scleraxis; Sdha, Succinate Dehydrogenase Complex Flavoprotein Subunit A; Slc25a20, Solute Carrier Family 25 Member 20; Sod1, Superoxide Dismutase 1, Soluble; Suclg1, Succinate-Coa Ligase Alpha Subunit; Tfam, Transcription Factor A, Mitochondrial; Tgfb1, Transforming Growth Factor Beta 1; Thbs4, Thrombospondin 4; Timp1, Timp Metallopeptidase Inhibitor 1; Timp2, Timp Metallopeptidase Inhibitor 2; Tnc, Tenascin C; Tnmd, Tenomodulin; Tnni2, Troponin I2, Fast Skeletal Type; Trim63, Tripartite Motif Containing 63/Muscle-Specific RING Finger Protein 1 (MuRF-1); Txn1, Thioredoxin; Vcl, Vinculin.
TABLE 1.
Gene enrichment analysis
| P value | |||
|---|---|---|---|
| Pathway or Function | 0 d vs. 10 d | 0 d vs. 30 d | 0 d vs. 60 d |
| Oxidation of fatty acid | 1.14E−05 | 1.43E−04 | 3.13E−04 |
| Concentration of lipid | 1.00E−04 | 1.26E−04 | 6.14E−05 |
| Accumulation of fatty acid | 3.78E−05 | 3.33E−04 | 6.03E−04 |
| Synthesis of lipid | 3.62E−04 | 4.57E−06 | 1.16E−09 |
| Disorder of lipid metabolism | 8.00E−09 | 5.42E−04 | — |
| Mitochondrial dysfunction | 1.06E−23 | — | — |
| Metabolism of carbohydrate | — | 6.65E−05 | 2.79E−06 |
| Production of ROS | 7.21E−11 | 7.06E−07 | 2.55E−07 |
| Muscle contraction | 5.99E−14 | 1.53E−05 | 2.41E−05 |
| Growth of connective tissue | 3.18E−04 | 1.04E−04 | 1.78E−07 |
| Inflammatory response | 4.89E−07 | 5.66E−08 | 4.97E−13 |
P values of selected biologic pathways and functions identified from IPA.
TABLE 2.
Changes in gene expression measured by qPCR
| Gene | 0 d | 10 d | 30 d | 60 d |
|---|---|---|---|---|
| Capn2 (m-calpain) | 1.00 ± 0.09 | 14.3 ± 5.23a | 11.8 ± 4.33a | 12.9 ± 4.81a |
| Cd36 (fatty acid translocase) | 1.00 ± 0.14 | 0.21 ± 0.05a | 0.38 ± 0.12a | 0.54 ± 0.21a,b |
| Col1a1 (Collagen, type I, alpha 1) | 1.00 ± 0.32 | 9.32 ± 2.73a | 8.61 ± 3.80a | 4.80 ± 0.72a,b,c |
| Cpt1b (carnitine palmitoyltransferase 1B) | 1.00 ± 0.14 | 0.32 ± 0.11a | 0.45 ± 0.12a | 0.63 ± 0.21a,b |
| Dgat1 (diacylglycerol O-acyltransferase 1) | 1.00 ± 0.26 | 0.43 ± 0.10a | 0.47 ± 0.13a | 0.68 ± 0.19a |
| Fbxo30 (F-box protein 30) | 1.00 ± 0.32 | 8.15 ± 1.99a | 7.95 ± 3.22a | 4.38 ± 1.24a,b,c |
| Il1b (Interleukin 1 beta) | 1.00 ± 0.38 | 9.32 ± 4.22a | 6.83 ± 2.28a | 4.22 ± 1.87b |
| Myh1 (myosin heavy chain IIX) | 1.00 ± 0.37 | 0.23 ± 0.11a | 2.85 ± 0.68a,b | 1.32 ± 0.56b,c |
| Myh2 (myosin heavy chain IIA) | 1.00 ± 0.09 | 0.15 ± 0.08a | 1.29 ± 0.45b | 1.52 ± 0.38a,b |
| Myh3 (myosin heavy chain embryonic) | 1.00 ± 0.41 | 19.8 ± 8.11a | 39.5 ± 12.6a,b | 17.4 ± 8.89a,c |
| Myh4 (myosin heavy chain IIB) | 1.00 ± 0.29 | 0.68 ± 0.12 | 0.64 ± 0.28a | 0.32 ± 0.09a,b |
| Myh7 (myosin heavy chain I) | 1.00 ± 0.12 | 0.19 ± 0.09a | 0.54 ± 0.10a,b | 0.93 ± 0.37b,c |
| Plin2 (perilipin 2) | 1.00 ± 0.11 | 23.4 ± 7.31a | 28.9 ± 4.92a | 7.92 ± 1.08a,b,c |
| Pnpla2 (ATGL, adipose triglyceride lipase) | 1.00 ± 0.21 | 0.48 ± 0.12a | 0.64 ± 0.15a | 0.81 ± 0.21b |
| Prdx1 (peroxiredoxin 1) | 1.00 ± 0.15 | 2.98 ± 0.34a | 2.55 ± 0.63a | 1.41 ± 0.42b,c |
Gene expression is normalized to the stable housekeeping gene eukaryotic translation initiation factor 2B subunit beta and further normalized to the 0-d group. Values are expressed as means ± coefficient of variation, n = 4 per group. Post hoc sorting (P < 0.05).
Different from 0 d.
Different from 10 d.
Different from 30 d.
At 10 d after rotator cuff tear, there was a general trend for a down-regulation in genes involved in muscle contraction, such as the myosin heavy chain (MYH) genes (Myh1, Myh2, Myh4, and Myh7) and other sarcomeric genes such as myosin binding protein c 1 and 2, myosin light chain 1, myopalladin, and troponin I2, as well as an increase in the membrane repair gene dysferlin (Dysf; Fig. 7B and Table 2). Many of these genes returned to baseline by 60 d, although, of note, embryonic Myh3 remained elevated throughout the study (Fig. 7B and Table 2).
Numerous autophagy and proteosome genes such as beclin-1, m-calpain, and MUSA-1 were induced 10 d after injury (Fig. 7C), as were several genes involved with inflammation, atrophy, and fibrosis, like GDF-11, IL-1β, and TGF-β (Fig. 7C, D). However, no difference in the atrophy-inducing signaling molecules activin A or B and a down-regulation in myostatin was observed. IGF1 and bone morphogenetic protein 7, which can activate pathways that promote muscle hypertrophy, were up-regulated after rotator cuff tear (Fig. 7D).
Many ECM genes, such as type I, III, IV, VI, and XIV collagen, elastin, lumican, thrombospondin 4, and tenascin C were up-regulated at the 10- or 30-d time points, as were the fibroblast markers S100A4 and scleraxis (Fig. 7E).
Genes involved in glycolysis, such as phosphofructokinase, aldolase A, glyceraldehyde-3-phosphate dehydrogenase, phosphoglycerate, and enolase 3, were down-regulated at 10 d, with some recovery through to 60 d after injury (Fig. 7F).
For fatty acid uptake and TG synthesis genes, there was a general trend for down-regulation after rotator cuff tear. Lipoprotein lipase, which hydrolyzes extracellular TGs into fatty acids, and the fatty acid transporter CD36 were down-regulated after injury (Fig. 7G). Acyl-CoA synthetase long-chain 1 and 6, which are the major enzymes that conjugate fatty acids into fatty acyl–CoAs in skeletal muscle, were down-regulated at all time points after injury, as were AGPAT9/glycerol-3-phosphate acyltransferase 3 and glycerol-3-phosphate acyltransferase 1, mitochondrial, which convert fatty acyl–CoAs into lysophosphatidic acids (Fig. 7G). Additional genes that were down-regulated include the AGPAT1, AGPAT3, and AGPAT6 enzymes that produce phosphatidic acid from lysophosphatidic acid, lipins 1–3, which dephosphorylate phosphatidic acid to produce DG and diacylglycerol O-acyltransferase (DGAT) 1 and DGAT2, which produce TG from DGs (Fig. 7G). Whereas TG synthesis genes were down-regulated, the lipid droplet coating gene perilipin 2 was up-regulated 10 d after rotator cuff tear, and Plin5 was down-regulated. Genes involved with hydrolyzing lipids stored in droplets in fatty acids, including PLNA2, PNPLA3, and PNPLA7, hormone-sensitive lipase, and monoglyceride lipase, were all down-regulated after injury (Fig. 7G and Table 2).
Enzymes that are responsible for the transport of fatty acids into the mitochondria, and their conversion into fatty acyl–CoAs, acyl-CoA synthetase medium chain family member 5, Acyl-CoA synthetase short chain family member 1, CPT1B, carnitine acylcarnitine translocase, and CPT2, were down-regulated at 10 and 30 d after injury, although some recovery occurred by 60 d (Fig. 7H). For genes involved in β-oxidation of fatty acyl CoAs within the mitochondria, the short-, medium-, and long-chain acyl-CoA dehydrogenases (ACADs) (Acads, Acadm, and Acadl) were all down-regulated at 10 and 30 d after injury (Fig. 7H).
Similar to β-oxidation genes, Krebs cycle and oxidative phosphorylation transcripts were also down-regulated after muscle injury, including citrate synthase, aconitase, isocitrate dehydrogenase, 2-oxoglutarate dehydrogenase, succinyl CoA synthetase, succinate dehydrogenase, fumarase, malate dehydrogenase, NDUFS1, cytochrome C1, COX4 (Cox4i1), and ATP5G1 (Fig. 7H). Genes involved in mitochondrial biogenesis, such as PGC1α (Ppargc1a) and NRF1, were down-regulated 10 d after injury, with no difference in transcription factor A, mitochondrial (Tfam) expression observed until 30 and 60 d (Fig. 7H). Mitofusin (MFN) 1 and MFN2, which promote mitochondrial fission, were also down-regulated after rotator cuff tear (Fig. 7H).
Genes involved in ROS metabolism were generally up-regulated 10 d after injury, including catalase, glutathione peroxidase 3, and thioredoxin, whereas others, such as glutathione peroxidase 1, PRDX1, and superoxide dismutase, were elevated at 60 d compared with controls (Fig. 7I). Although mitochondrial β-oxidation genes were down-regulated, oxidation of fatty acids can also occur in peroxisomes in a process mediated by acyl-CoA oxidase 1 (ACOX1), which was up-regulated 10 d after injury. In addition to initiating the oxidation of fatty acyl–CoAs, ACOX1 produces H2O2 that is buffered in peroxisomes by catalase, which was markedly up-regulated 10 d after injury (Fig. 7I). ω-Oxidation of fatty acids can also occur as a way to generate acetyl-CoA during times of stress in a process regulated by cytochrome P450 family 4 subfamily B member 1, which was up-regulated after injury (Fig. 7I).
Following the analysis of transcriptional changes, we next sought to determine changes in the proteome after muscle injury. A selection of the 632 proteins detected are presented in Fig. 8. The PC analysis demonstrated that the control and 10-d groups were unique from each other and the 30- and 60-d groups, whereas the 30- and 60-d groups showed some overlap (Fig. 8A). In most cases, we saw general agreement between observed changes in mRNAs and the proteins they encode, including those involved with protein synthesis and atrophy (Fig. 8B), contractile and structural proteins (Fig. 8C), ECM proteins (Fig. 8D), metabolic proteins (Fig. 8E), and ROS proteins (Fig. 8F).
Figure 8.

Changes in the proteome after rotator cuff tear. A) Principal component (PC) analysis of overall changes across the proteome. B–F) Levels of selected protein synthesis and atrophy proteins (B), contractile and structural proteins (C), ECM proteins (D), metabolic proteins (E), and ROS proteins (F) as measured by mass spectrometry. n = 4 muscles per group. Post hoc sorting (P < 0.05): a, different from 0 d; b, different from 10 d; c, different from 30 d.
Finally, as metabolomic, transcriptomic, and proteomic analyses suggested alterations in lipid oxidation, we sought to evaluate the abundance of lipid species and proteins that are important in mitochondrial function and the ability of mitochondria to oxidize substrates after rotator cuff tear. Whereas virtually no mitochondria were observed in the peripheral space of control muscles, extensive accumulation of peripheral mitochondria was noted after muscle injury (Fig. 9A). There was no change in the ratio of mtDNA:gDNA (Fig. 9B). Acylcarnitines and l-carnitine, which shuttle fatty acids between the cytosol and mitochondria, were reduced at all time points after injury (Fig. 9C–F). Cardiolipins, which are phospholipids found almost exclusively within the inner mitochondrial membrane, were reduced 10 d after injury but recovered thereafter (Fig. 9G). Glutathionylated proteins (Fig. 9H) and 2 proteins that are critical in mitophagy, PINK1 (Fig. 9I) and parkin (Fig. 9J), were elevated after injury along with ULK1 (Fig. 9K) and p62 (Fig. 9L), which play critical roles in mitophagy and autophagy in general. The hydrogen peroxide scavenging enzymes Prdx3 and Prdx6 were elevated 10 d after injury, and Prdx3 remained elevated at 30 and 60 d (Fig. 9M, N). SDHA and COX4 are 2 critical proteins in mitochondrial respiration, and although succinate dehydrogenase was reduced after injury, COX4 abundance was not different between control and injured muscles (Fig. 9O, P). After assessing the abundance of proteins important in mitochondrial physiology, we then performed assays to determine the functional capacity of mitochondrial proteins to metabolize substrates. Complex I, II, and IV activity was reduced 10 d after injury but recovered by 30 d (Fig. 9Q–S). Similar results were observed when we evaluated the ability to oxidize pyruvate and palmitate, with an insufficiency 10 d after injury but recovery thereafter, with pyruvate oxidation nearly doubling 60 d after rotator cuff tear compared with control muscles (Fig. 9T, U).
Figure 9.

Changes in mitochondria abundance and function after rotator cuff tear. A) Representative electron micrographs taken at the sarcolemma, with arrowheads demonstrating accumulation of peripheral subsarcolemmal mitochondria. Scale bar for each panel is 2 μm. B–U) Copies of mtDNA abundance to gDNA abundance. Short-chain (≤5 carbon) acylcarnitines (C), medium-chain (6–12 carbon) acylcarnitines (D), long-chain (13–20 carbon) acylcarnitines (E), l-carnitine (F), and cardiolipins (G) as measured by mass spectrometry and presented as relative peak intensity (RPI). Quantification of Western blot band densitometry of glutathionlylated proteins (H), PINK1 (I), Parkin (J), Ulk1 (K), p62 (L), Prdx3 (M), Prdx6 (N), SDHA (O), and COX4 (P) protein levels, with representative blots shown as insets. Enzymatic activity of complex I (Q), complex II (R), and complex IV (S) is shown. Oxidation rates of 14C-pyruvate (T) and 14C-palmitate (U) are shown. Data are presented means ± sd, n = 6 muscles per group (B); n = 5 muscles per group (C–F); n = 10 muscles per group (G); n = 3 muscles per group (H–P); n = 4–6 muscles per group (Q–U). Post hoc sorting (P < 0.05): a, different from 0 d; b, different from 10 d; c, different from 30 d.
DISCUSSION
Myosteatosis is a common pathologic change observed in certain skeletal muscle groups following injury and is particularly pronounced in the rotator cuff (7, 8). Fat accumulation is associated with greater muscle weakness and dysfunction in patients with rotator cuff tears (8, 11), and the mechanisms that lead to lipid accretion in myosteatosis are not well understood. Using a translational rat model of myosteatosis, we evaluated changes in muscle fiber force production, broadly profiled the changes in the muscle lipidome, metabolome, transcriptome, and proteome, and utilized bioinformatics techniques to help identify potential factors that lead to fat accumulation in myosteatosis. Testing of muscle fiber force, along with electron micrographs, demonstrated a reduction in force production that accompanied disruptions to myofibril alignment and cytoskeletal architecture. Based on the transcriptional bioinformatics and supporting lipidomics, metabolomics, and electron micrographs, we then formulated the hypothesis that pathologic lipid accumulation occurs in torn rotator cuffs because of mitochondrial dysfunction and reduced lipid oxidation. In support of this hypothesis, we observed a reduced capacity of mitochondria to oxidize lipids early in the injury process, along with transcriptional changes indicative of increased lipid droplet storage with reduced fatty acid uptake and mobilization from lipid droplet stores. Although mitochondrial function appears to recover at later time points, there is a general increase in glycolytic metabolites in muscles and a greater capacity to oxidize pyruvate. These findings support the notion that myosteatosis occurs because of a reduction in mitochondrial lipid oxidation and not increased uptake of circulating lipids into the muscle. A summary of the pathologic changes that occur after rotator cuff tear, and the relationships between these changes, is presented in Fig. 10.
Figure 10.
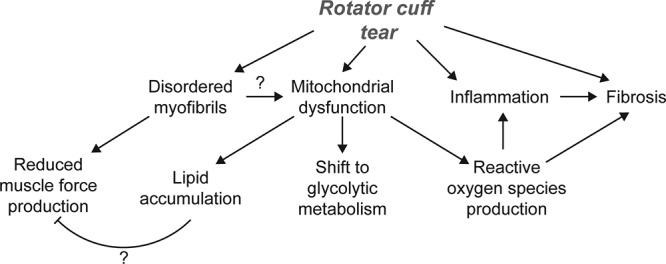
Overview of pathologic changes after rotator cuff tear. An overview of the pathologic changes observed and proposed that contribute to myosteatosis, weakness, and fibrosis after rotator cuff tear.
Shoulder weakness is a common observation in patients with rotator cuff tears, and this often does not recover even after successful repair of the torn tendon and completion of postoperative rehabilitation and strengthening programs (8, 11, 33). Satellite cells, which are myogenic progenitor cells that play an important role in regenerating muscle after injury, are found in equal abundance between untorn and fully torn rotator cuffs and display similar in vitro proliferative and fusion capacity (34), indicating that altered satellite cell activity is unlikely to be responsible for the persistent dysfunction in patients who undergo rotator cuff repair. Despite apparently normal satellite cells, disordered sarcomere organization and reduced muscle force production has been reported in patients with chronic rotator cuff tears and animal models of chronic rotator cuff disease (1, 11, 12, 35, 36). However, less was known about subacute changes in contractile function after rotator cuff tear and how the changes occur over time. In the current study, we observed a reduction in force production that occurred 10 d after the injury, continuing to decline by 30 d, with some recovery by 60 d. Centrally located nuclei were observed at 10 d, indicative of a regenerative response corresponding to satellite cell activation and myotube fusion occurring around this time point. Electron micrographs demonstrated early sarcomere streaming, with the most grossly disorganized appearance of myofibrils at 30 d. By 60 d, myofibril organization improved, but with persistent z-disc malalignment that likely contributed to the reduced specific force at this time point. Numerous sarcomeric genes and proteins displayed marked changes in abundance at the 10 and 30 d time points, further suggesting active myofibril remodeling occurring at these time points that tapers to some extent by 60 d. Genes and proteins involved with protein degradation, such as the E3-ligases MUSA-1, atrogin-1, MuRF-1, and NEDD4 and the calcium-dependent protease m-calpain (37) were induced at 10 d. In agreement with these findings, the abundance of 2 important proteins in the 20S catalytic subunit of the 26S proteasome, PSMA6 and PSMB2 (38), were also increased after muscle injury. TGF-β, which can induce muscle atrophy by activating proteasomal protein degradation (39), was induced after injury, although, surprisingly, no differences in the closely related genes activin A and B and a down-regulation in myostatin (40) was observed. IL-1β, which can promote inflammation and muscle atrophy through activating the NFκB pathway (41), was elevated across all injury time points.
IGF1, which is activated by exercise and can induce muscle hypertrophy through the Akt/p70S6K pathway (37) was up-regulated after injury, but interestingly, phosphorylation of the IGF1 receptor was reduced 30 and 60 d after rotator cuff tear. Although the reason for this is not known, DG- and ceramide-induced inflammation, lipotoxicity, and mitochondrial dysfunction are known to activate various serine and threonine kinases that block activation of the insulin receptor in patients with type 2 diabetes (42). Although the lipotoxic and inflammatory environment is greater in these injured muscles than what is observed in type 2 diabetes, given the homologies between the insulin and IGF1 receptors, it is possible that similar mechanisms are inhibiting activation of the IGF1 receptor after rotator cuff tear. Phosphorylation of ERK1/2, which is a kinase downstream of IGF1 and several other mechanosensitive pathways in skeletal muscle (43), was also reduced after rotator cuff tear. IGF1 can activate p70S6K pathway through both an Akt/mammalian target of rapamycin–dependent phosphorylation of the T389 residue (44) and ERK1/2 through the T421/S424 residues (45). Although p70S6K is a well-known activator of rpS6 (46), numerous other signaling pathways can also phosphorylate rpS6 (47), many of which are associated with cellular stress and inflammation, which is likely also occurring after rotator cuff tear. Additionally, p70S6K activation is required for increasing muscle force during growth (48), suggesting a potential role for p70S6K in the translation of myofibrillar mRNAs. For rotator cuff tears, because many patients continue to develop muscle atrophy and have persistent weakness after surgical repair and rehabilitation (8), it is possible that the reason the muscles of these patients fails to recover is suppression of the IGF1 signaling pathway that is normally activated in response to exercise.
In addition to muscle atrophy, fibrosis is a common feature of rotator cuff tears (49–51). In the current study, 10 d after injury, there was an increase in the levels of the fibroblast marker S100A4 and several proteoglycans including lumican, osteoglycin, periostin, prolargin, thrombospondin 4, and vinculin. However, fibrillar collagens, measured by hydroxyproline levels, did not increase until 30 and 60 d after tear, corresponding to increases in the expression of several collagen transcripts and other ECM components at the same time points. These findings indicate that pathologic changes to muscle fibers occur prior to substantial fibrotic changes in the ECM. As the accumulation of fibrotic ECM impairs lateral force transmission between muscle fibers, which increases injury susceptibility during lengthening contractions (52), the changes that occur to the ECM likely further exacerbate weakness following rotator cuff tear.
Although myosteatosis has been well documented in various types of muscle injuries and diseases, little is known about the ontogeny of fat accumulation in this condition (5, 6). In the current study, we identified a progressive increase in TG after injury, with TG levels at 60 d that were 3-fold higher than controls. This was consistent with observations of increased lipid accumulation observed in histology and electron microscopy. FFAs were also elevated at 30 and 60 d after rotator cuff tear. There was a down-regulation in nearly all of the genes responsible for the transport of FFAs into the muscle cells, and the synthesis of TGs from FFAs (53), including CD36, ACSL1, ACSL6, AGPAT9/glycerol-3-phosphate acyltransferase 3, glycerol-3-phosphate acyltransferase 1, mitochondrial, AGPAT1, AGPAT3, AGPAT6, lipin 1-3, and DGAT1-2. PLIN2, which coats lipid droplets and appears to be important for lipid droplet growth and stability (54), was also up-regulated after rotator cuff tear, whereas PLIN5, which also coats lipid droplets but also helps to target fatty acids to mitochondria for oxidation (54), was down-regulated. Consistent with these findings, genes involved with hydrolyzing TG stored in lipid droplets in fatty acids (53, 55) were down-regulated after injury, including ATGL and PNPLA3, hormone-sensitive lipase, and monoglyceride lipase. These findings suggest that the intrafiber fat that accumulates in myosteatosis does not occur because of increased fatty acid transport into fibers or de novo synthesis of fatty acids from other substrates but likely because of a reduction in lipolysis.
In further support of this notion, mitochondrial lipid oxidation was also reduced 10 d after rotator cuff tear, with a corresponding reduction in the activity of complex I, II, and IV. It can be difficult to precisely measure mitochondrial abundance, especially because mitochondria often exist in large, interconnected networks throughout the muscle fiber (56), but mtDNA abundance and cardiolipin levels are often used to estimate mitochondrial mass (30, 57, 58). Although we did not observe a difference in relative levels of mtDNA, a transient decrease in cardiolipins was observed 10 d after rotator cuff tear. Genes involved in the transport of fatty acids into the mitochondria and their conversion into fatty acyl–CoAs (acyl-CoA synthetase medium chain family member 5, Acyl-CoA synthetase short chain family member 1, CPT1b, carnitine acylcarnitine translocase, and CPT2), the β-oxidation of fatty acyl–CoAs within the mitochondria (ACADS, ACADM, ACADL), and Krebs cycle and oxidative phosphorylation (citrate synthase, aconitase, isocitrate dehydrogenase, 2-oxoglutarate dehydrogenase, succinyl CoA synthetase, SDHA, fumarase, malate dehydrogenase, NDUFS1, cytochrome C1, COX4, and ATP5G1) (53, 59, 60) were all down-regulated after rotator cuff tear, with most remaining so through 60 d after injury. Whereas in vitro assays demonstrated a reduction in fatty acid oxidation 10 d after injury, medium- and long-chain acylcarnitines, which serve as markers for the amount of fatty acids transported into mitochondria (60, 61), were reduced at all postinjury time points, suggesting a sustained reduction in fatty acid oxidation by mitochondria in vivo. Amino acids can be metabolized and eventually oxidized through the formation of short-chain acylcarnitines (61), but these were also reduced after muscle injury, indicating that amino acid oxidation is not likely taking the place of lipid oxidation as a source of energy following muscle injury. Although mitochondrial lipid and protein oxidation appear to be reduced, ACOX1, which initiates the oxidation of fatty acids in peroxisomes (62), was also up-regulated 10 d after rotator cuff tear. Peroxisomal oxidation of lipids also generates ROS (62), which likely contribute to the inflammatory environment in muscles after injury.
While mitochondrial lipid oxidation appears reduced after rotator cuff tears, but metabolites involved in glycolysis are enriched 30 and 60 d after injury. Genes involved in glycolytic metabolism, such as phosphofructokinase, aldolase A, glyceraldehyde-3-phosphate dehydrogenase, phosphoglycerate, and enolase 3 (63), were down at 10 d but recovered to some extent by 60 d after injury, although glycolytic metabolites remained elevated. The net increase in glycolytic metabolites corresponded with a greater ability of mitochondria to oxidize pyruvate in vitro, and these findings in combination with the reduced abundance of acylcarnitines suggest muscle fibers are using much less lipid for oxidation. Furthermore, although there was an accumulation in glycolytic metabolites, no apparent change in myosin isoform expression is present as would be expected when a major fiber-type transition occurred. The overall lipid accumulation and shift to a glycolytic phenotype that we observed in this study is similar to findings in a mouse model of skeletal muscle–specific CPT1b deletion in which mitochondria had a drastically reduced ability to take up long-chain fatty acids, resulting in an accumulation of cytosolic lipid droplets, as well as elevated levels of TG and ceramides and an increase in glycolytic metabolism (64).
Several reports involving animal and human models of skeletal muscle unloading and denervation have identified profound mitochondrial dysfunction and accompanying increases in ROS production that occur after the injury (65–68). We also observed increased markers of ROS in injured muscles, including elevated levels of glutathionylated proteins, as well as an increase in the abundance of Prdx3 and Prdx6, which scavenge hydrogen peroxide in the mitochondria and cytoplasm, respectively (69, 70). The production of ROS by dysfunctional mitochondria, as suggested by the elevation in Prdx3, likely further exacerbates the inflammatory environment within injured rotator cuff muscle fibers because elevated ROS has been linked to inhibition of protein synthesis signaling pathways, the induction of proteolytic and autophagic pathways, and fibrosis (71, 72). To address the dysfunctional mitochondria, injured rotator cuff muscle fibers do appear to be activating mitophagy, as evidenced by increased levels of PINK1 and Parkin, which target depolarized mitochondria for breakdown in autophagosomes in a processe mediated by ULK1 (73). p62, which plays an important regulatory role in both mitophagy and general autophagy (40), was also markedly elevated at all time points after rotator cuff tear. However, although there appears to be an increase in mitophagy, key genes involved in mitochondrial biogenesis, including PGC1α, nuclear respiratory factor 1, and transcription factor A, mitochondrial (74), were down-regulated after injury, as were the mitochondrial fusion genes Mfn1 and Mfn2. We also noted an accumulation of peripheral segment mitochondria in torn rotator cuffs.
In the classic 2–mitochondrial population model, a collection of peripheral mitochondria has decreased oxidative capacity compared with the physically distinct pool of mitochondria in the myofibrillar space (75–77). In the newly emerging view of mitochondria, in which mitochondria are thought to exist in a dynamic reticulum extending from the sarcolemma to the myofibrils and actively undergo fusion and fission in continuous networks throughout the cell, peripheral segment mitochondria have a greater abundance of proton motive proteins, whereas the connected intermyofibrillar mitochondria located in the I-band have more ATP-generating proteins for use by sarcomeres (56, 78). In the current study, the abnormal spherical mitochondria in the peripheral space of injured muscles at 30 and 60 d after rotator cuff tear could reflect a mitochondrial network that has been mechanically and biochemically disrupted; this is supported by observations in yeast in which the small mitochondria that bud off of larger networks of mitochondria have a spherical appearance (79). Although the nature of mitochondrial dysfunction in torn rotator cuffs remains unknown, because the continuum of mitochondrial networks that normally exists in healthy skeletal muscle likely requires extensive support from the cytoskeleton of the fiber to maintain shape, we posit that the highly disrupted myofibril architecture that occurs as a result of rotator cuff tear likely interferes with the ability to form a stable intermyofibrillar network, resulting in mitochondrial dysfunction and subsequent lipid accumulation.
There are several limitations to this study. Although the rat model is commonly used in the study of rotator cuff pathology, the quadripedal nature of rats results in increased relative loads transmitted through the glenohumeral joint and therefore greater forces transmitted through the rotator cuff during normal locomotion in rats than in humans. The interfiber fat accumulation phenotype in rats is less pronounced than what is observed in patients with chronic rotator cuff tears. We also focused on pathologic fatty changes within muscle fibers, although the adjacent adipocytes are likely important in contributing to pathologic changes as well. The tendons of rats will spontaneously reattach to the humerus or surrounding soft tissue through a fibrous scar, which does not occur in humans; therefore, a tenectomy must be performed to chronically unload the SSP muscle of rats. Additionally, humans and large animals of rotator cuff injury develop a combination of inter- and intrafiber lipid accumulation, with the intrafiber accumulation occurring through an expansion of adipocytes. We only evaluated rats with a rotator cuff tear and did not evaluate changes that occur within the muscle after the tear is repaired. Although we measured transcriptional changes in myosin isoforms, we did not directly perform histologic fiber type analysis. We also did not demonstrate a direct causal mechanism between mitochondrial dysfunction and pathologic lipid accumulation, although experiments in which mitochondria are directly manipulated and lipid transport and storage are measured would add further understanding to the mechanism of rotator cuff dysfunction proposed in this paper. A total of 3 postinjury time points were selected to look at subacute, early chronic, and chronic changes in the muscle, but extending the evaluation to early and later time points would likely add additional information about the pathology. Finally, only male rats were studied, but we think the results are informative of rotator cuff pathology in both sexes.
Rotator cuff tears are among the most prevalent upper extremity disorders and can result in profound pain and disability that persist despite surgical repair (8, 9, 80). Although surgical techniques have evolved to improve the repair of the torn tendon back to its insertion on the humerus, our ability to treat the extensive muscle atrophy and myosteatosis that occur subsequent to the tear is limited (1, 7). The findings from this study demonstrate that the accumulation of fat in torn rotator cuffs likely occurs because of deficits in mitochondrial lipid oxidation and likely leads to a lipid-induced proinflammatory and lipotoxic state, which reduces regeneration. Further exploration of therapies to enhance mitochondrial function and increase lipid oxidation may lead to improvements for patients with rotator cuff tears and other myosteatosis-related conditions.
Supplementary Material
This article includes supplemental data. Please visit http://www.fasebj.org to obtain this information.
ACKNOWLEDGMENTS
The authors acknowledge technical contributions from Dr. Richard McEachin, Dr. James Markworth (both from the University of Michigan, Ann Arbor, MI), and Jacob Swanson (Hospital for Special Surgery, New York, NY). This work was supported by Grants from the U.S. National Institutes of Health (NIH) National Institute of Arthritis and Musculoskeletal and skin Diseases (F31-AR065931, R01-AR063649), and from the NIH National Institute of Diabetes and Digestive and Kidney Diseases (R01-DK107397, R03-DK109888, and U24-DK097153). The authors declare no conflicts of interest.
Glossary
- ACAD
acyl-CoA dehydrogenase
- ACOX1
acyl-CoA oxidase 1
- Acsl
acyl-CoA synthetase long-chain
- Akt
protein kinase B
- CoA
coenzyme A
- COX4
cytochrome c oxidase subunit 4
- CPT
carnitine palmitoyltransferase
- CSA
cross-sectional area
- Cys
cysteine
- DG
diglyceride
- DGAT
diacylglycerol O-acyltransferase
- ECM
extracellular matrix
- FDR
false discovery rate
- FFA
free fatty acid
- Fo
maximum isometric force
- gDNA
genomic DNA
- IPA
Ingenuity Pathway Analysis
- MFN
mitofusin
- MS
mass spectrometry
- MS/MS
tandem MS
- mtDNA
mitochondrial DNA
- MYH
myosin heavy chain
- p70S6K
p70S6 kinase
- PC
principal component
- Plin
perilipin
- Pnpla
patatin-like phospholipase domain-containing
- Prdx
peroxiredoxin
- PTM
post-translational modification
- qPCR
quantitative PCR
- RNA-seq
RNA sequencing
- ROS
reactive oxygen species
- rpS6
ribosomal protein S6
- SDHA
succinate dehydrogenase-A
- sFo
pecific maximum isometric force
- SSP
supraspinatus
- TG
triglyceride
- WGA
wheat germ agglutinin
Footnotes
This article includes supplemental data. Please visit http://www.fasebj.org to obtain this information.
AUTHOR CONTRIBUTIONS
J. P. Gumucio, K. Funai, B. McDonagh, and C. L. Mendias designed research; J. P. Gumucio, A. H. Qasawa, P. J. Ferrara, B. McDonagh, and C. L. Mendias performed research; A. N. Malik contributed analytic tools; J. P. Gumucio, A. H. Qasawa, P. J. Ferrara, K. Funai, B. McDonagh, and C. L. Mendias analyzed data; and J. P. Gumucio and C. L. Mendias wrote the manuscript.
REFERENCES
- 1.Mendias C. L., Roche S. M., Harning J. A., Davis M. E., Lynch E. B., Sibilsky Enselman E. R., Jacobson J. A., Claflin D. R., Calve S., Bedi A. (2015) Reduced muscle fiber force production and disrupted myofibril architecture in patients with chronic rotator cuff tears. J. Shoulder Elbow Surg. 24, 111–119 [DOI] [PubMed] [Google Scholar]
- 2.Fry C. S., Johnson D. L., Ireland M. L., Noehren B. (2017) ACL injury reduces satellite cell abundance and promotes fibrogenic cell expansion within skeletal muscle. J. Orthop. Res. 35, 1876–1885 [DOI] [PMC free article] [PubMed] [Google Scholar]
- 3.Gibbons M. C., Singh A., Anakwenze O., Cheng T., Pomerantz M., Schenk S., Engler A. J., Ward S. R. (2017) Histological evidence of muscle degeneration in advanced human rotator cuff disease. J. Bone Joint Surg. Am. 99, 190–199 [DOI] [PMC free article] [PubMed] [Google Scholar]
- 4.Carda S., Cisari C., Invernizzi M. (2013) Sarcopenia or muscle modifications in neurologic diseases: a lexical or patophysiological difference? Eur. J. Phys. Rehabil. Med. 49, 119–130 [PubMed] [Google Scholar]
- 5.Zoico E., Corzato F., Bambace C., Rossi A. P., Micciolo R., Cinti S., Harris T. B., Zamboni M. (2013) Myosteatosis and myofibrosis: relationship with aging, inflammation and insulin resistance. Arch. Gerontol. Geriatr. 57, 411–416 [DOI] [PMC free article] [PubMed] [Google Scholar]
- 6.Flores D. V., Mejía Gómez C., Estrada-Castrillón M., Smitaman E., Pathria M. N. (2018) MR imaging of muscle trauma: anatomy, biomechanics, pathophysiology, and imaging appearance. Radiographics 38, 124–148 [DOI] [PubMed] [Google Scholar]
- 7.Bedi A., Dines J., Warren R. F., Dines D. M. (2010) Massive tears of the rotator cuff. J. Bone Joint Surg. Am. 92, 1894–1908 [DOI] [PubMed] [Google Scholar]
- 8.Gladstone J. N., Bishop J. Y., Lo I. K., Flatow E. L. (2007) Fatty infiltration and atrophy of the rotator cuff do not improve after rotator cuff repair and correlate with poor functional outcome. Am. J. Sports Med. 35, 719–728 [DOI] [PubMed] [Google Scholar]
- 9.Colvin A. C., Egorova N., Harrison A. K., Moskowitz A., Flatow E. L. (2012) National trends in rotator cuff repair. J. Bone Joint Surg. Am. 94, 227–233 [DOI] [PMC free article] [PubMed] [Google Scholar]
- 10.Gigliotti D., Leiter J. R., Macek B., Davidson M. J., MacDonald P. B., Anderson J. E. (2015) Atrophy, inducible satellite cell activation, and possible denervation of supraspinatus muscle in injured human rotator-cuff muscle. Am. J. Physiol. Cell Physiol. 309, C383–C391 [DOI] [PubMed] [Google Scholar]
- 11.Gerber C., Schneeberger A. G., Hoppeler H., Meyer D. C. (2007) Correlation of atrophy and fatty infiltration on strength and integrity of rotator cuff repairs: a study in thirteen patients. J. Shoulder Elbow Surg. 16, 691–696 [DOI] [PubMed] [Google Scholar]
- 12.Gumucio J. P., Davis M. E., Bradley J. R., Stafford P. L., Schiffman C. J., Lynch E. B., Claflin D. R., Bedi A., Mendias C. L. (2012) Rotator cuff tear reduces muscle fiber specific force production and induces macrophage accumulation and autophagy. J. Orthop. Res. 30, 1963–1970 [DOI] [PMC free article] [PubMed] [Google Scholar]
- 13.Soslowsky L. J., Carpenter J. E., DeBano C. M., Banerji I., Moalli M. R. (1996) Development and use of an animal model for investigations on rotator cuff disease. J. Shoulder Elbow Surg. 5, 383–392 [DOI] [PubMed] [Google Scholar]
- 14.Liu X., Manzano G., Kim H. T., Feeley B. T. (2011) A rat model of massive rotator cuff tears. J. Orthop. Res. 29, 588–595 [DOI] [PubMed] [Google Scholar]
- 15.Davis M. E., Stafford P. L., Jergenson M. J., Bedi A., Mendias C. L. (2015) Muscle fibers are injured at the time of acute and chronic rotator cuff repair. Clin. Orthop. Relat. Res. 473, 226–232 [DOI] [PMC free article] [PubMed] [Google Scholar]
- 16.Mathewson M. A., Kwan A., Eng C. M., Lieber R. L., Ward S. R. (2014) Comparison of rotator cuff muscle architecture between humans and other selected vertebrate species. J. Exp. Biol. 217, 261–273 [DOI] [PMC free article] [PubMed] [Google Scholar]
- 17.Morag Y., Jacobson J. A., Miller B., De Maeseneer M., Girish G., Jamadar D. (2006) MR imaging of rotator cuff injury: what the clinician needs to know. Radiographics 26, 1045–1065 [DOI] [PubMed] [Google Scholar]
- 18.Ward S. R., Sarver J. J., Eng C. M., Kwan A., Würgler-Hauri C. C., Perry S. M., Williams G. R., Soslowsky L. J., Lieber R. L. (2010) Plasticity of muscle architecture after supraspinatus tears. J. Orthop. Sports Phys. Ther. 40, 729–735 [DOI] [PMC free article] [PubMed] [Google Scholar]
- 19.Roche S. M., Gumucio J. P., Brooks S. V., Mendias C. L., Claflin D. R. (2015) Measurement of maximum isometric force generated by permeabilized skeletal muscle fibers. J. Vis. Exp. (100), e52695 [DOI] [PMC free article] [PubMed] [Google Scholar]
- 20.Claflin D. R., Larkin L. M., Cederna P. S., Horowitz J. F., Alexander N. B., Cole N. M., Galecki A. T., Chen S., Nyquist L. V., Carlson B. M., Faulkner J. A., Ashton-Miller J. A. (2011) Effects of high- and low-velocity resistance training on the contractile properties of skeletal muscle fibers from young and older humans. J. Appl. Physiol. 111, 1021–1030 [DOI] [PMC free article] [PubMed] [Google Scholar]
- 21.Sugg K. B., Korn M. A., Sarver D. C., Markworth J. F., Mendias C. L. (2017) Inhibition of platelet-derived growth factor signaling prevents muscle fiber growth during skeletal muscle hypertrophy. FEBS Lett. 591, 801–809 [DOI] [PMC free article] [PubMed] [Google Scholar]
- 22.Mendias C. L., Schwartz A. J., Grekin J. A., Gumucio J. P., Sugg K. B. (2017) Changes in muscle fiber contractility and extracellular matrix production during skeletal muscle hypertrophy. J. Appl. Physiol. 122, 571–579 [DOI] [PMC free article] [PubMed] [Google Scholar]
- 23.Sarver D. C., Sugg K. B., Disser N. P., Enselman E. R. S., Awan T. M., Mendias C. L. (2017) Local cryotherapy minimally impacts the metabolome and transcriptome of human skeletal muscle. Sci. Rep. 7, 2423 [DOI] [PMC free article] [PubMed] [Google Scholar]
- 24.Afshinnia F., Rajendiran T. M., Soni T., Byun J., Wernisch S., Sas K. M., Hawkins J., Bellovich K., Gipson D., Michailidis G., Pennathur S.; Michigan Kidney Translational Core CPROBE Investigator Group (2018) Impaired β-oxidation and altered complex lipid fatty acid partitioning with advancing CKD. J. Am. Soc. Nephrol. 29, 295–306 [DOI] [PMC free article] [PubMed] [Google Scholar]
- 25.Kind T., Liu K. H., Lee D. Y., DeFelice B., Meissen J. K., Fiehn O. (2013) LipidBlast in silico tandem mass spectrometry database for lipid identification. Nat. Methods 10, 755–758 [DOI] [PMC free article] [PubMed] [Google Scholar]
- 26.Lorenz M. A., Burant C. F., Kennedy R. T. (2011) Reducing time and increasing sensitivity in sample preparation for adherent mammalian cell metabolomics. Anal. Chem. 83, 3406–3414 [DOI] [PMC free article] [PubMed] [Google Scholar]
- 27.Trapnell C., Roberts A., Goff L., Pertea G., Kim D., Kelley D. R., Pimentel H., Salzberg S. L., Rinn J. L., Pachter L. (2012) Differential gene and transcript expression analysis of RNA-seq experiments with TopHat and Cufflinks. Nat. Protoc. 7, 562–578; erratum: 9, 2513 [DOI] [PMC free article] [PubMed] [Google Scholar]
- 28.McDonagh B., Sakellariou G. K., Smith N. T., Brownridge P., Jackson M. J. (2014) Differential cysteine labeling and global label-free proteomics reveals an altered metabolic state in skeletal muscle aging. J. Proteome Res. 13, 5008–5021 [DOI] [PMC free article] [PubMed] [Google Scholar]
- 29.Chong J., Soufan O., Li C., Caraus I., Li S., Bourque G., Wishart D. S., Xia J. (2018) MetaboAnalyst 4.0: towards more transparent and integrative metabolomics analysis. Nucleic Acids Res. 46 (W1), W486–W494 [DOI] [PMC free article] [PubMed] [Google Scholar]
- 30.Ajaz S., Czajka A., Malik A. (2015) Accurate measurement of circulating mitochondrial DNA content from human blood samples using real-time quantitative PCR. Methods Mol. Biol. 1264, 117–131 [DOI] [PubMed] [Google Scholar]
- 31.Dohm G. L., Huston R. L., Askew E. W., Weiser P. C. (1972) Effects of exercise on activity of heart and muscle mitochondria. Am. J. Physiol. 223, 783–787 [DOI] [PubMed] [Google Scholar]
- 32.Jong-Yeon K., Hickner R. C., Dohm G. L., Houmard J. A. (2002) Long- and medium-chain fatty acid oxidation is increased in exercise-trained human skeletal muscle. Metabolism 51, 460–464 [DOI] [PubMed] [Google Scholar]
- 33.Baumer T. G., Chan D., Mende V., Dischler J., Zauel R., van Holsbeeck M., Siegal D. S., Divine G., Moutzouros V., Bey M. J. (2016) Effects of rotator cuff pathology and physical therapy on in vivo shoulder motion and clinical outcomes in patients with a symptomatic full-thickness rotator cuff tear. Orthop. J. Sports Med. 4, 2325967116666506. [DOI] [PMC free article] [PubMed] [Google Scholar]
- 34.Meyer G. A., Farris A. L., Sato E., Gibbons M., Lane J. G., Ward S. R., Engler A. J. (2015) Muscle progenitor cell regenerative capacity in the torn rotator cuff. J. Orthop. Res. 33, 421–429 [DOI] [PMC free article] [PubMed] [Google Scholar]
- 35.Gibbons M. C., Sato E. J., Bachasson D., Cheng T., Azimi H., Schenk S., Engler A. J., Singh A., Ward S. R. (2016) Muscle architectural changes after massive human rotator cuff tear. J. Orthop. Res. 34, 2089–2095 [DOI] [PMC free article] [PubMed] [Google Scholar]
- 36.Valencia A. P., Lai J. K., Iyer S. R., Mistretta K. L., Spangenburg E. E., Davis D. L., Lovering R. M., Gilotra M. N. (2018) Fatty infiltration is a prognostic marker of muscle function after rotator cuff tear. Am. J. Sports Med. 46, 2161–2169 [DOI] [PMC free article] [PubMed] [Google Scholar]
- 37.Gumucio J. P., Sugg K. B., Mendias C. L. (2015) TGF-β superfamily signaling in muscle and tendon adaptation to resistance exercise. Exerc. Sport Sci. Rev. 43, 93–99 [DOI] [PMC free article] [PubMed] [Google Scholar]
- 38.Elenich L. A., Nandi D., Kent A. E., McCluskey T. S., Cruz M., Iyer M. N., Woodward E. C., Conn C. W., Ochoa A. L., Ginsburg D. B., Monaco J. J. (1999) The complete primary structure of mouse 20S proteasomes. Immunogenetics 49, 835–842 [DOI] [PubMed] [Google Scholar]
- 39.Mendias C. L., Gumucio J. P., Davis M. E., Bromley C. W., Davis C. S., Brooks S. V. (2012) Transforming growth factor-beta induces skeletal muscle atrophy and fibrosis through the induction of atrogin-1 and scleraxis. Muscle Nerve 45, 55–59 [DOI] [PMC free article] [PubMed] [Google Scholar]
- 40.Sartori R., Gregorevic P., Sandri M. (2014) TGFβ and BMP signaling in skeletal muscle: potential significance for muscle-related disease. Trends Endocrinol. Metab. 25, 464–471 [DOI] [PubMed] [Google Scholar]
- 41.Yamaki T., Wu C. L., Gustin M., Lim J., Jackman R. W., Kandarian S. C. (2012) Rel A/p65 is required for cytokine-induced myotube atrophy. Am. J. Physiol. Cell Physiol. 303, C135–C142 [DOI] [PMC free article] [PubMed] [Google Scholar]
- 42.Boucher J., Kleinridders A., Kahn C. R. (2014) Insulin receptor signaling in normal and insulin-resistant states. Cold Spring Harb. Perspect. Biol. 6, a009191 [DOI] [PMC free article] [PubMed] [Google Scholar]
- 43.West D. W., Baehr L. M., Marcotte G. R., Chason C. M., Tolento L., Gomes A. V., Bodine S. C., Baar K. (2016) Acute resistance exercise activates rapamycin-sensitive and -insensitive mechanisms that control translational activity and capacity in skeletal muscle. J. Physiol. 594, 453–468 [DOI] [PMC free article] [PubMed] [Google Scholar]
- 44.Burnett P. E., Barrow R. K., Cohen N. A., Snyder S. H., Sabatini D. M. (1998) RAFT1 phosphorylation of the translational regulators p70 S6 kinase and 4E-BP1. Proc. Natl. Acad. Sci. USA 95, 1432–1437 [DOI] [PMC free article] [PubMed] [Google Scholar]
- 45.Iijima Y., Laser M., Shiraishi H., Willey C. D., Sundaravadivel B., Xu L., McDermott P. J., Kuppuswamy D. (2002) c-Raf/MEK/ERK pathway controls protein kinase C-mediated p70S6K activation in adult cardiac muscle cells. J. Biol. Chem. 277, 23065–23075 [DOI] [PubMed] [Google Scholar]
- 46.Tavares M. R., Pavan I. C., Amaral C. L., Meneguello L., Luchessi A. D., Simabuco F. M. (2015) The S6K protein family in health and disease. Life Sci. 131, 1–10 [DOI] [PubMed] [Google Scholar]
- 47.Biever A., Valjent E., Puighermanal E. (2015) Ribosomal protein S6 phosphorylation in the nervous system: from regulation to function. Front. Mol. Neurosci. 8, 75 [DOI] [PMC free article] [PubMed] [Google Scholar]
- 48.Marabita M., Baraldo M., Solagna F., Ceelen J. J. M., Sartori R., Nolte H., Nemazanyy I., Pyronnet S., Kruger M., Pende M., Blaauw B. (2016) S6K1 is required for increasing skeletal muscle force during hypertrophy. Cell Rep. 17, 501–513 [DOI] [PubMed] [Google Scholar]
- 49.Killian M. L., Lim C. T., Thomopoulos S., Charlton N., Kim H. M., Galatz L. M. (2013) The effect of unloading on gene expression of healthy and injured rotator cuffs. J. Orthop. Res. 31, 1240–1248 [DOI] [PMC free article] [PubMed] [Google Scholar]
- 50.Wilde J. M., Gumucio J. P., Grekin J. A., Sarver D. C., Noah A. C., Ruehlmann D. G., Davis M. E., Bedi A., Mendias C. L. (2016) Inhibition of p38 mitogen-activated protein kinase signaling reduces fibrosis and lipid accumulation after rotator cuff repair. J. Shoulder Elbow Surg. 25, 1501–1508 [DOI] [PMC free article] [PubMed] [Google Scholar]
- 51.Davis M. E., Korn M. A., Gumucio J. P., Harning J. A., Saripalli A. L., Bedi A., Mendias C. L. (2015) Simvastatin reduces fibrosis and protects against muscle weakness after massive rotator cuff tear. J. Shoulder Elbow Surg. 24, 280–287 [DOI] [PMC free article] [PubMed] [Google Scholar]
- 52.Zhang C., Gao Y. (2014) Effects of aging on the lateral transmission of force in rat skeletal muscle. J. Biomech. 47, 944–948 [DOI] [PMC free article] [PubMed] [Google Scholar]
- 53.Watt M. J., Hoy A. J. (2012) Lipid metabolism in skeletal muscle: generation of adaptive and maladaptive intracellular signals for cellular function. Am. J. Physiol. Endocrinol. Metab. 302, E1315–E1328 [DOI] [PubMed] [Google Scholar]
- 54.MacPherson R. E., Peters S. J. (2015) Piecing together the puzzle of perilipin proteins and skeletal muscle lipolysis. Appl. Physiol. Nutr. Metab. 40, 641–651 [DOI] [PubMed] [Google Scholar]
- 55.Kienesberger P. C., Oberer M., Lass A., Zechner R. (2009) Mammalian patatin domain containing proteins: a family with diverse lipolytic activities involved in multiple biological functions. J. Lipid Res. 50 (Suppl), S63–S68 [DOI] [PMC free article] [PubMed] [Google Scholar]
- 56.Glancy B., Hartnell L. M., Malide D., Yu Z. X., Combs C. A., Connelly P. S., Subramaniam S., Balaban R. S. (2015) Mitochondrial reticulum for cellular energy distribution in muscle. Nature 523, 617–620 [DOI] [PMC free article] [PubMed] [Google Scholar]
- 57.Menshikova E. V., Ritov V. B., Fairfull L., Ferrell R. E., Kelley D. E., Goodpaster B. H. (2006) Effects of exercise on mitochondrial content and function in aging human skeletal muscle. J. Gerontol. A. Biol. Sci. Med. Sci. 61, 534–540 [DOI] [PMC free article] [PubMed] [Google Scholar]
- 58.Larsen S., Nielsen J., Hansen C. N., Nielsen L. B., Wibrand F., Stride N., Schroder H. D., Boushel R., Helge J. W., Dela F., Hey-Mogensen M. (2012) Biomarkers of mitochondrial content in skeletal muscle of healthy young human subjects. J. Physiol. 590, 3349–3360 [DOI] [PMC free article] [PubMed] [Google Scholar]
- 59.Carter H. N., Chen C. C., Hood D. A. (2015) Mitochondria, muscle health, and exercise with advancing age. Physiology (Bethesda) 30, 208–223 [DOI] [PubMed] [Google Scholar]
- 60.Aon M. A., Bhatt N., Cortassa S. C. (2014) Mitochondrial and cellular mechanisms for managing lipid excess. Front. Physiol. 5, 282 [DOI] [PMC free article] [PubMed] [Google Scholar]
- 61.Overmyer K. A., Evans C. R., Qi N. R., Minogue C. E., Carson J. J., Chermside-Scabbo C. J., Koch L. G., Britton S. L., Pagliarini D. J., Coon J. J., Burant C. F. (2015) Maximal oxidative capacity during exercise is associated with skeletal muscle fuel selection and dynamic changes in mitochondrial protein acetylation. Cell Metab. 21, 468–478 [DOI] [PMC free article] [PubMed] [Google Scholar]
- 62.Zeng J., Li D. (2004) Expression and purification of his-tagged rat peroxisomal acyl-CoA oxidase I wild-type and E421 mutant proteins. Protein Expr. Purif. 38, 153–160 [DOI] [PubMed] [Google Scholar]
- 63.Demine S., Reddy N., Renard P., Raes M., Arnould T. (2014) Unraveling biochemical pathways affected by mitochondrial dysfunctions using metabolomic approaches. Metabolites 4, 831–878 [DOI] [PMC free article] [PubMed] [Google Scholar]
- 64.Wicks S. E., Vandanmagsar B., Haynie K. R., Fuller S. E., Warfel J. D., Stephens J. M., Wang M., Han X., Zhang J., Noland R. C., Mynatt R. L. (2015) Impaired mitochondrial fat oxidation induces adaptive remodeling of muscle metabolism. Proc. Natl. Acad. Sci. USA 112, E3300–E3309 [DOI] [PMC free article] [PubMed] [Google Scholar]
- 65.Gram M., Vigelsø A., Yokota T., Helge J. W., Dela F., Hey-Mogensen M. (2015) Skeletal muscle mitochondrial H2 O2 emission increases with immobilization and decreases after aerobic training in young and older men. J. Physiol. 593, 4011–4027 [DOI] [PMC free article] [PubMed] [Google Scholar]
- 66.Bhattacharya A., Muller F. L., Liu Y., Sabia M., Liang H., Song W., Jang Y. C., Ran Q., Van Remmen H. (2009) Denervation induces cytosolic phospholipase A2-mediated fatty acid hydroperoxide generation by muscle mitochondria. J. Biol. Chem. 284, 46–55 [DOI] [PMC free article] [PubMed] [Google Scholar]
- 67.Bhattacharya A., Lustgarten M., Shi Y., Liu Y., Jang Y. C., Pulliam D., Jernigan A. L., Van Remmen H. (2011) Increased mitochondrial matrix-directed superoxide production by fatty acid hydroperoxides in skeletal muscle mitochondria. Free Radic. Biol. Med. 50, 592–601 [DOI] [PMC free article] [PubMed] [Google Scholar]
- 68.Pollock N., Staunton C. A., Vasilaki A., McArdle A., Jackson M. J. (2017) Denervated muscle fibers induce mitochondrial peroxide generation in neighboring innervated fibers: role in muscle aging. Free Radic. Biol. Med. 112, 84–92 [DOI] [PMC free article] [PubMed] [Google Scholar]
- 69.Ma S., Zhang X., Zheng L., Li Z., Zhao X., Lai W., Shen H., Lv J., Yang G., Wang Q., Ji J. (2016) Peroxiredoxin 6 is a crucial factor in the initial step of mitochondrial clearance and is upstream of the PINK1-parkin pathway. Antioxid. Redox Signal. 24, 486–501 [DOI] [PubMed] [Google Scholar]
- 70.Watabe S., Hiroi T., Yamamoto Y., Fujioka Y., Hasegawa H., Yago N., Takahashi S. Y. (1997) SP-22 is a thioredoxin-dependent peroxide reductase in mitochondria. Eur. J. Biochem. 249, 52–60 [DOI] [PubMed] [Google Scholar]
- 71.Powers S. K., Morton A. B., Ahn B., Smuder A. J. (2016) Redox control of skeletal muscle atrophy. Free Radic. Biol. Med. 98, 208–217 [DOI] [PMC free article] [PubMed] [Google Scholar]
- 72.Richter K., Kietzmann T. (2016) Reactive oxygen species and fibrosis: further evidence of a significant liaison. Cell Tissue Res. 365, 591–605 [DOI] [PMC free article] [PubMed] [Google Scholar]
- 73.Drake J. C., Yan Z. (2017) Mitophagy in maintaining skeletal muscle mitochondrial proteostasis and metabolic health with ageing. J. Physiol. 595, 6391–6399 [DOI] [PMC free article] [PubMed] [Google Scholar]
- 74.Tryon L. D., Vainshtein A., Memme J. M., Crilly M. J., Hood D. A. (2014) Recent advances in mitochondrial turnover during chronic muscle disuse. Integr. Med. Res. 3, 161–171 [DOI] [PMC free article] [PubMed] [Google Scholar]
- 75.Cogswell A. M., Stevens R. J., Hood D. A. (1993) Properties of skeletal muscle mitochondria isolated from subsarcolemmal and intermyofibrillar regions. Am. J. Physiol. 264, C383–C389 [DOI] [PubMed] [Google Scholar]
- 76.Ferreira R., Vitorino R., Alves R. M., Appell H. J., Powers S. K., Duarte J. A., Amado F. (2010) Subsarcolemmal and intermyofibrillar mitochondria proteome differences disclose functional specializations in skeletal muscle. Proteomics 10, 3142–3154 [DOI] [PubMed] [Google Scholar]
- 77.Koves T. R., Noland R. C., Bates A. L., Henes S. T., Muoio D. M., Cortright R. N. (2005) Subsarcolemmal and intermyofibrillar mitochondria play distinct roles in regulating skeletal muscle fatty acid metabolism. Am. J. Physiol. Cell Physiol. 288, C1074–C1082 [DOI] [PubMed] [Google Scholar]
- 78.Patel K. D., Glancy B., Balaban R. S. (2016) The electrochemical transmission in I-Band segments of the mitochondrial reticulum. Biochim. Biophys. Acta 1857, 1284–1289 [DOI] [PMC free article] [PubMed] [Google Scholar]
- 79.Mears J. A., Lackner L. L., Fang S., Ingerman E., Nunnari J., Hinshaw J. E. (2011) Conformational changes in Dnm1 support a contractile mechanism for mitochondrial fission. Nat. Struct. Mol. Biol. 18, 20–26 [DOI] [PMC free article] [PubMed] [Google Scholar]
- 80.Yamaguchi K., Ditsios K., Middleton W. D., Hildebolt C. F., Galatz L. M., Teefey S. A. (2006) The demographic and morphological features of rotator cuff disease. A comparison of asymptomatic and symptomatic shoulders. J. Bone Joint Surg. Am. 88, 1699–1704 [DOI] [PubMed] [Google Scholar]
Associated Data
This section collects any data citations, data availability statements, or supplementary materials included in this article.