Abstract
Statins, widely used to treat hypercholesterolemia, inhibit the 3-hydroxy-3-methylglutaryl-coenzyme A reductase, the rate-limiting enzyme of de novo cholesterol (Chol) synthesis. Statins have been also reported to slow tumor progression. In cancer cells, ATP is generated both by glycolysis and oxidative phosphorylation. Mitochondrial membrane potential (ΔΨ), a readout of mitochondrial metabolism, is sustained by the oxidation of respiratory substrates in the Krebs cycle to generate NADH and flavin adenine dinucleotide, which are further oxidized by the respiratory chain. Here, we studied the short-term effects of statins (3–24 h) on mitochondrial metabolism on cancer cells. Lovastatin (LOV) and simvastatin (SIM) increased ΔΨ in HepG2 and Huh7 human hepatocarcinoma cells and HCC4006 human lung adenocarcinoma cells. Mitochondrial hyperpolarization after LOV and SIM was dose and time dependent. Maximal increase in ΔΨ occurred at 10 µM and 24 h for both statins. The structurally unrelated atorvastatin also hyperpolarized mitochondria in HepG2 cells. Cellular and mitochondrial Chol remained unchanged after SIM. Both LOV and SIM decreased basal respiration, ATP-linked respiration, and ATP production. LOV and SIM did not change the rate of lactic acid production. In summary, statins modulate mitochondrial metabolism in cancer cells independently of the Chol content in cellular membranes without affecting glycolysis.—Christie, C. F., Fang, D., Hunt, E. G., Morris, M. E., Rovini, A., Heslop, K. A., Beeson, G. C., Beeson, C. C., Maldonado, E. N. Statin-dependent modulation of mitochondrial metabolism in cancer cells is independent of cholesterol content.
Keywords: glycolysis, lovastatin, mitochondrial membrane potential, oxidative phosphorylation, simvastatin
Statins, used worldwide to treat hypercholesterolemia, inhibit the 3-hydroxy-3-methylglutaryl-coenzyme A (HMGCoA)reductase, the rate-limiting enzyme for de novo cholesterol (Chol) synthesis in the mevalonate pathway (1, 2). In spite of the effectiveness in decreasing plasmatic Chol, 20% of the population who have a clinical indication for statin therapy display intolerance to these drugs (3). The most common adverse effects are myopathies, which include myalgia, muscle stiffness and tenderness, loss of muscle strength, and cramps (4). In rare cases, damage to muscles progresses to fatal rhabdomyolysis (5–7). Although some evidence suggests that mitochondrial dysfunction might be the cause of statin-induced myopathies, the molecular mechanisms remain undetermined (8).
Statins have also been proposed to decrease cancer progression. Several meta-analyses have associated statins with a reduced risk of developing liver, prostate, gastric, lung, esophageal, and colorectal cancers, although a beneficial effect on tumor development is still controversial (9). Statins increased survival in patients with hepatocellular carcinoma and simple squamous cell carcinoma of the head, neck, and cervix by a median of 9 and 7.5 mo, respectively (10, 11). Statins arrested choroidal melanoma, lung cancer, hepatocellular carcinoma, and breast cancer cells in the G1 phase of the cell cycle and induced apoptosis (12–14). Statins also induced mitochondrial dysfunction and apoptosis in all-trans retinoic acid-resistant promyelocytic leukemia (15).
The metabolic consequences of statins on tumor cells are poorly understood. A distinctive feature of cancer cells is the Warburg phenotype characterized by enhanced glycolysis and partial suppression of mitochondrial metabolism (16). The current consensus is that the Warburg phenotype favors proliferation by providing carbon backbones for the synthesis of biomass (lipids, proteins, and nucleic acids) required for the formation of new cells. Tumor mitochondria contribute to cell bioenergetics by generating ATP and also metabolic intermediaries for the biosynthetic needs of proliferating cells (17, 18).
Total cellular ATP generation is contributed both by mitochondrial oxidative phosphorylation (oxphos) and glycolysis. Oxphos generates more than 95% of ATP in nonproliferating cells, whereas in cancer cells, aerobic glycolysis accounts for 20–90% of ATP formation (19, 20). Respiratory substrates (fatty acyl-CoAs, pyruvate, and certain amino acids), ADP, and inorganic phosphate (Pi) enter the mitochondrial matrix after crossing the mitochondrial outer and inner membranes. Respiratory substrates fuel the Krebs cycle to generate reduced nicotinamide adenine dinucleotide (NADH) and flavin adenine dinucleotide (FADH2), which are oxidized by the electron transport chain. The electron transport chain pumps protons into the intermembrane space at complexes I, III, and IV to produce a proton motive force further used by the ATP F1-F0 synthase to generate ATP from ADP and Pi. The higher concentration of protons in the intermembrane space relative to that of the matrix form the negative mitochondrial membrane potential (ΔΨ), a useful readout to follow changes in mitochondrial metabolism in intact cells (21–24). The relative contribution of oxphos and glycolysis, genetically determined, vary substantially over time depending on multiple nongenetic factors. Availability of different fuels, level of oxygenation, stage of the cell cycle, proximity to newly formed vs. mature blood vessels, and pharmacological manipulation influence the oxidative or glycolytic phenotype. In many tumors, a decrease in mitochondrial metabolism triggers an increase in the Warburg phenotype and vice versa (25–27).
In preliminary studies, short-term treatment with lovastatin (LOV) (<6 h) in human liver hepatocellular carcinoma cell line HepG2 cells increased ΔΨ without changes in cell morphology, whereas longer treatments (72–96 h) collapsed ΔΨ and promoted cell shrinking among other morphologic changes. It has been shown that although simvastatin (SIM) inhibits HMG-CoA reductase in HepG2 cells, total Chol content remains unchanged after 18–24 h of treatment (28, 29). The loss of cellular morphology after 72–96 h of LOV is consistent with a decrease in Chol content, which is essential for the maintenance of the structure of cellular membranes. Chol content has been reported to decrease after exposing HepG2 and human prostate cancer (C4-2) cells to statins for more than 48 h (30, 31). The short-term LOV-dependent increase in ΔΨ in cancer cells led to the hypothesis that statins promote mitochondrial hyperpolarization by altering mitochondrial metabolism independent of cellular or mitochondrial Chol content.
Here, we show that the increase in ΔΨ after statins is both dose and time dependent and not restricted to a particular cell line. Mitochondrial hyperpolarization is associated with decreased ATP production and respiration, indicative of a lower mitochondrial metabolism without a compensatory up-regulation of glycolysis. Unchanged cellular and mitochondrial total Chol levels after statins indicates that the effect on mitochondrial metabolism in cancer cells is independent of Chol content.
MATERIALS AND METHODS
Materials
Antimycin A, atorvastatin (ATOR), carbonyl cyanide 3-chlorophenylhydrazone (CCCP), methyl-β-cyclodextrin (CD), oligomycin (oligo), rotenone, and SIM were purchased from MilliporeSigma (Burlington, MA, USA). LOV was purchased from Selleck Chemicals (Houston, TX, USA) and 2-deoxy-d-glucose (2-DG) was purchased from Thermo Fisher Scientific (Waltham, MA, USA). Eagle’s Minimum Essential Medium was purchased from the American Type Culture Collection (ATCC; Manassas, VA, USA) and RPMI 1640 containing 2.05 mM l-glutamine was purchased from Thermo Fisher Scientific. RIPA buffer was prepared with 50 mM Tris, 150 mM NaCl, 1% sodium deoxycholate, 1 mM EGTA, 1% Triton X-100, and 0.1% SDS (pH adjusted to 7.4). Buffer for Seahorse experiments contained the following (mM): l-glutamine 4, d-glucose 10, sodium pyruvate 1, CaCl2 0.036, MgCl2 0.06, KH2PO4 0.05, KCl 0.54, Na2HPO4 heptahydrate 0.05, and NaCl 13. Chloroform and methanol were HPLC grade. All other chemicals were analytical grade.
Cell cultures
HepG2 (HB-8065) and HCC4006 (CRl-2871) cells were both obtained from ATCC. Huh7 human hepatocarcinoma cells were a gift from Dr. Jack R. Wands (Brown University, Providence, RI, USA). HepG2 cells were grown in Eagle’s Minimum Essential Medium supplemented with 10% premium fetal bovine serum (Atlanta Biologicals, Flowery Branch, GA, USA) with the addition of 100 U/ml penicillin and 100 µg/ml streptomycin. Huh7 cells were grown in the same growth medium as HepG2 with the addition of 1% 100× MEM nonessential amino acids (11140-50; Thermo Fisher Scientific). HCC4006 cells were grown with Rosewell Park Memorial Institute (RPMI) 1640 supplemented with 10% fetal bovine serum, 100 U/ml penicillin, and 100 µg/ml streptomycin. All cell lines were maintained in a 5% CO2 air/gas mixture at 37°C and used 48 h after plating when confluency was 70–80%. Experiments with live cells were performed in a 5% CO2 air/gas mixture at 37°C in a modified HBSS containing the following (mM): NaCl 137, Na2HPO4 0.35, KCl 5.4, KH2PO4 1, MgSO4 0.81, Ca2Cl 0.95, glucose 5.5, NaHCO3 25, and HEPES 20 (pH 7.4), as previously described (23, 24).
Confocal microscopy
ΔΨ was assessed by confocal microscopy of tetramethylrhodamine methyl ester (TMRM; Thermo Fisher Scientific). HepG2, HCC4006, and Huh7 cells plated in Cellview 4-chamber plates (Greiner Bio-One, Monroe, NC, USA) or MatTek dishes (Ashland, MA, USA) were cultured in whole-growth medium for each time point (0, 3, 6, and 24 h). Before imaging, whole medium was replaced after washing with HBSS. Cells were loaded with 200 nM TMRM for 30 min and maintained with 50 nM TMRM before imaging as previously described (23, 32). TMRM was excited at 561 nm, and emission was detected with a Quasar multichannel spectral detector at 590–610 nm through a 1-Airy unit diameter pinhole. NADPH autofluorescence was imaged using multiphoton laser excitation (720 nm) and an infrared-blocking emission barrier filter (460 ± 25 nm). TMRM fluorescence and NADH autofluorescence were imaged by a Zeiss LSM 880 NLO inverted laser-scanning confocal microscope (Carl Zeiss, Oberkochen, Germany) using a ×63 1.4 numerical aperture plan-apochromat oil immersion lens. TMRM and NADH intensity were quantified using Zeiss Zen and Photoshop CS4 software (Adobe Systems, San Jose, CA, USA) after subtraction of background fluorescence as previously described in Maldonado et al. (22).
Fluorescent polystyrene microspheres (4 µm) (MultiSpeck Multispectral Fluorescence Microscopy Standards Kit, M-7901; Thermo Fisher Scientific) were used as fiducial markers. Microspheres diluted in HBSS were added to TMRM-loaded cells at a final concentration of 30,000 microspheres/ml (24). All images were taken 20 min or longer after addition to allow sedimentation of the microspheres.
Quantification of ATP
ATP was determined in lysed cells using the luciferase-based Abcam Luminescent ATP Detection Assay Kit (ab113849; Cambridge, MA, USA). Luminescence (relative light units) was measured in a Biotek Synergy H1 plate reader (Winooski, VT, USA). All luminescence values were normalized per million cells and expressed as percentage compared with vehicle (Veh).
l-lactate determination
Medium from HepG2 cells grown in 6-well plates was collected and centrifuged at 1000 g for 5 min. Pellets were discarded and supernatants were used to determine lactate content using an l-Lactate Assay Kit (1200011002; Eton Bioscience, San Diego, CA, USA). Absorbance was measured at 490 nm in a Biotek Synergy H1 plate reader.
Lipid extraction
Whole-cell lipids
HepG2 cells (500,000/well) were plated in 6-well plates. Cells were washed with PBS, scraped, transferred to microcentrifuge tubes, and centrifuged at 600 g for 5 min. The supernatants were discarded and the pellets containing whole cells were resuspended in 0.4 ml PBS. Lipid extraction was performed following a Bligh & Dyer modified method (33). Briefly, a 2:1 ratio of a mixture of 1 ml methanol and 0.5 ml HPLC-grade chloroform were added to the cell suspension. After mixing in a vortex for 1 min, an additional 0.5 ml chloroform and 0.5 ml distilled water were added. Polar and organic phases were separated by centrifugation at 1000 g for 20 min. The top polar phase was discarded, and the lipid containing bottom phase was evaporated in a N2 atmosphere to prevent lipid oxidation. Dried lipids were resuspended in chloroform and stored at −4°C.
Mitochondrial lipids
HepG2 cells (500,000/well) in 6-well plates were collected and centrifuged at 600 g for 5 min. The pellets were washed with PBS, centrifuged again, and resuspended in cytosolic extraction buffer using a Mitochondria/Cytosol Fractionation Kit (K256; Biovision, Milpitas, CA, USA). Homogenates prepared using a Dounce tissue grinder (DWK Life Sciences, Millville, NJ, USA) were centrifuged at 700 g for 10 min. Supernatants were collected and centrifuged at 10,000 g for 30 min. Pellets containing mitochondria were resuspended in 0.4 ml PBS. Mitochondrial lipids were extracted using the modified Bligh & Dyer method as previously described.
Whole-cell and mitochondrial Chol assessment
Chloroform containing total lipids from whole-cell and mitochondrial fractions after lipid extraction was evaporated in a N2 atmosphere. Dried lipids were resuspended in isopropanol alcohol, and Chol was quantified using an Amplex Red Cholesterol Assay (A12216; Thermo Fisher Scientific) that measures both free Chol and cholesteryl esters according to manufacturer’s instructions. Absolute values of fluorescence were normalized per million cells for cellular Chol and per mg of protein for mitochondrial Chol and expressed as percentages compared with Veh.
Protein quantification
Cells and isolated mitochondria were lysed in RIPA buffer and centrifuged at 5000 g for 15 min at −4°C. Supernatants were transferred to new tubes and stored at −80°C until further processing. Whole-cell and mitochondrial protein absorbance at 562 nm were measured using the Pierce BCA Protein Assay Kit (23227; Thermo Fisher Scientific).
Respirometric assay
Oxygen consumption rate (OCR) was measured using a Seahorse XFe96 Analyzer (Agilent Technologies, Santa Clara, CA, USA) and calculated from the continuous average slope of the O2 partitioning among plastic, atmosphere, and cellular uptake (34, 35). HepG2 cells (25,000/well) in XF 96-well microplates were maintained in growth medium and treated 48 h after plating for 3, 6, and 24 h. Experiments were performed in 200 µl/well of the buffer described Materials and Methods. Microplates and sensor cartridges were kept in an air incubator for 1 h before starting the experiments. Basal, oligo-sensitive, and maximal respiratory capacity were determined after sequential addition of oligo (1 µM), CCCP (2 µM.), and rotenone (2 µM) + antimycin A (2 µM), respectively.
Statistics
Differences between groups were analyzed by a Student’s t test using a value of P < 0.05 as the criterion of significance. Data points are the means ± se of 3–5 independent experiments. Images in figures are representative of 3 or more independent experiments.
RESULTS
LOV, SIM, and ATOR hyperpolarize mitochondria
To assess the effects of statins on ΔΨ, HepG2 cells were loaded with the ΔΨ-indicating fluorophore TMRM and imaged by confocal microscopy. In untreated cells and Veh-treated cells, TMRM-labeled mitochondria were mostly filamentous and distributed throughout the cytoplasm. Basal ΔΨ was heterogeneous as previously described (23, 24).
Dose response
ΔΨ in HepG2 cells increased after treatment with LOV (10 µM) or SIM (10 µM) for 6 h. The increase in ΔΨ was dose dependent for both LOV and SIM. LOV (1, 3, and 10 µM) increased ΔΨ by 46, 116, and 114%, respectively. Similarly, SIM (1, 3, and 10 µM) increased ΔΨ by 84, 191, and 176%, respectively. Both statins caused maximal increase in ΔΨ at 3–10 µM (Fig. 1). After statins, ΔΨ was similar in most cells, indicating that the magnitude of the hyperpolarizing effect was higher for lower ΔΨ cells compared with constitutively high ΔΨ cells.
Figure 1.
Mitochondrial hyperpolarization after LOV is dose dependent. HepG2 cells maintained in HBSS were loaded with TMRM as described in Materials and Methods. A) Cells were treated with LOV (1, 3, and 10 µM) for 3 h. Fluorescent polystyrene microspheres were used as fiducial markers indicated by arrows. Image intensity was pseudocolored according to the reference bar. B) Quantitative analysis of TMRM-relative fluorescence after LOV and SIM compared with Veh. Four to 5 randomly selected fields with 10–20 cells per field were analyzed. A.u., arbitrary units. *P < 0.05 from 3 independent experiments.
Time course
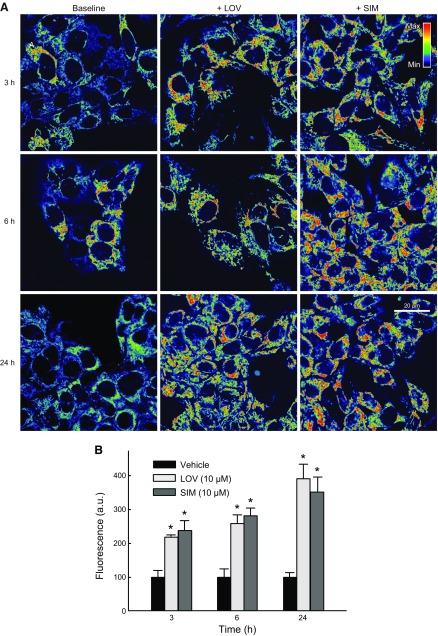
To determine if the hyperpolarizing effect of statins was progressive over time, we treated HepG2 cells with LOV (10 µM) or SIM (10 µM) for 3, 6, and 24 h. LOV increased ΔΨ by ∼118, 133, and 291% at 3, 6, and 24 h, respectively. SIM increased ΔΨ by ∼138, 181, and 252% at 3, 6, and 24 h, respectively. The hyperpolarizing effect of LOV and SIM was time dependent, reaching maximal intensity at 24 h (Fig. 2). Mitochondrial morphology remained unchanged during the first 6 h of treatment. At 24 h after statins, mitochondria of some cells became less filamentous and more rounded (data not shown).
Figure 2.
SIM and LOV hyperpolarize mitochondria progressively. HepG2 cells maintained in HBSS were loaded with TMRM as described in Materials and Methods. A) LOV (10 µM) and SIM (10 µM) were added for 3, 6, and 24 h. Image intensity was pseudocolored according to the reference bar. B) TMRM-relative fluorescence was quantified after SIM or LOV compared with Veh. Four to 5 randomly selected fields with 10–20 cells per field were analyzed. A.u., arbitrary units. *P < 0.05 from 3 independent experiments.
Structurally different statin
ATOR (10 µM), a structurally unrelated statin, also hyperpolarized mitochondria by 65% after 6 h in HepG2 cells (data not shown), indicating that the increase in ΔΨ after SIM and LOV was independent of chemical similarities between statins.
Cell lines
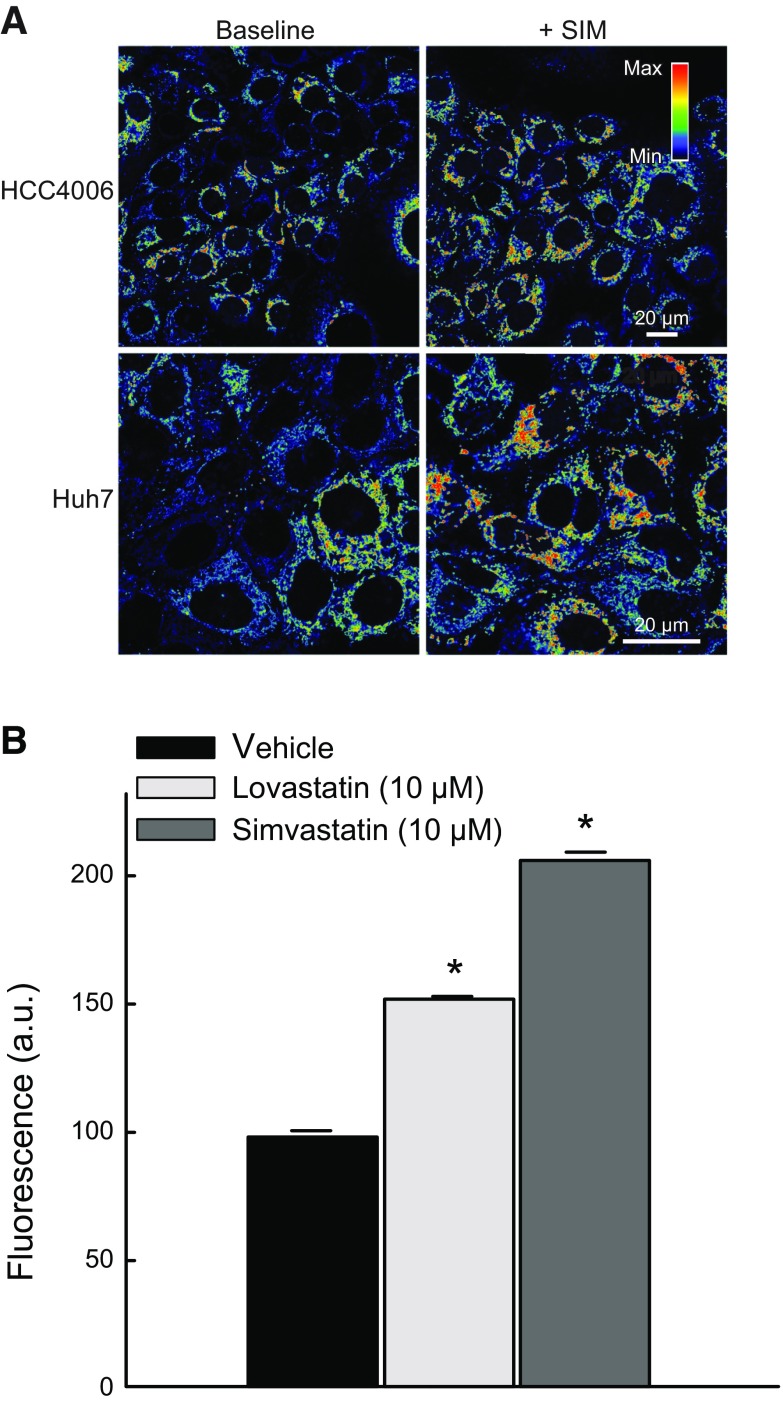
To assess if the effects of statins on ΔΨ were cell-line specific, we treated two additional cancer cell lines from different tissue origin. SIM (10 µM) hyperpolarized mitochondria in HCC4006 human lung carcinoma cells and Huh7 human hepatocarcinoma cells (Fig. 3A, upper panel). LOV (10 µM) and SIM (10 µM) for 6 h increased ΔΨ in Huh7 cells by ∼52 and 101%, respectively, confirming that the hyperpolarizing effect of statins was not cell-line dependent (Fig. 3).
Figure 3.
SIM and LOV increase ΔΨ in different cell lines. A) HCC4006 human lung carcinoma cells (upper panel) and Huh7 human hepatocarcinoma cells (lower panel) were treated with SIM (10 µM) for 6 h. B) TMRM-relative fluorescence after SIM and LOV was quantified in comparison with Veh in Huh7 cells. Four to 5 randomly selected fields with 10–20 cells per field were analyzed. A.u., arbitrary units. *P < 0.05 from 3 independent experiments.
SIM does not change cellular and mitochondrial Chol content
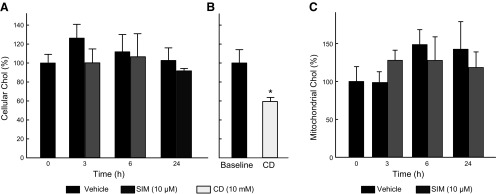
HepG2 cells were treated with SIM (10 µM) for 3, 6, and 24 h. Chol content in whole cells and isolated mitochondria after Veh or SIM remained unchanged (Fig. 4A, B). These findings indicated that the short-term inhibition of de novo synthesis of Chol did not affect total Chol levels in cellular membranes.
Figure 4.
SIM does not alter cellular and mitochondrial Chol content. A, C) HepG2 cells were treated with SIM (10 µM) for 3, 6, and 24 h. Chol was measured after lipid extraction from whole cells and isolated mitochondria as described in Materials and Methods. Cellular Chol (A) content was normalized per million cells, and mitochondrial Chol (C) was normalized per milligram of protein and expressed as a percentage in both cases. B) β-Methyl-cyclodextrine (CD) (10 mM) for 3 h was used as a positive control. Analysis corresponds to 3 independent experiments.
LOV and SIM inhibit respiration and ATP production
Cellular respiration
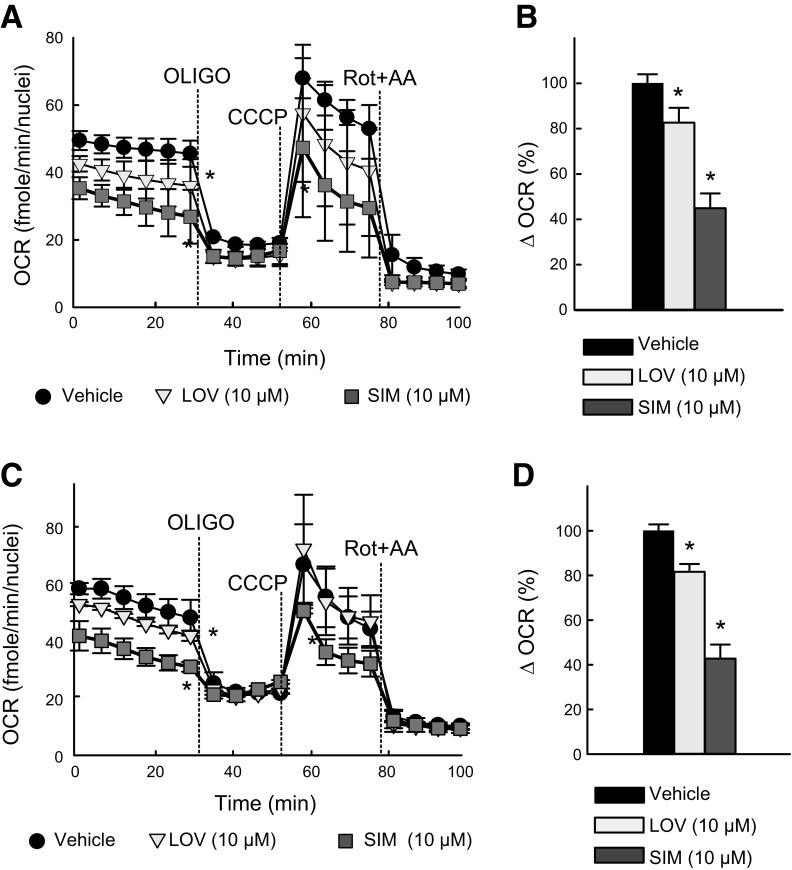
The effects of LOV and SIM on respiration (assessed as OCR) in HepG2 cells was determined using a Seahorse XFe96 extracellular flux analyzer. Cells maintained in whole-growth medium in XF 96-well plates were treated with Veh, LOV (10 µM), or SIM (10 µM) for 3, 6, and 24 h. Each experiment was performed immediately after finalizing the treatments. LOV and SIM decreased basal respiration by ∼26 and 47% at 3 h and by 18 and 39% at 24 h (Fig. 5A–C). Subsequent addition of oligo (1 µM), an ATP synthase inhibitor, decreased oxygen consumption by ∼25, 19, and 10% 3 h after treatment for Veh, LOV, and SIM, respectively. At 24 h, oligo decreased respiration by ∼24, 19, and 9% for Veh, LOV, and SIM respectively. The decrease in oligo-sensitive respiration (Δ = OCR before oligo – OCR after oligo) was lowest for SIM (SIM < LOV < Veh), indicating that ATP synthesis driven by the ATP synthase was decreased by statins both at 3 and 24 h (Fig. 5B–D). SIM but not LOV decreased maximal respiration after the uncoupler CCCP (2 µM), indicating a partial inhibitory effect of SIM on the maximum functional efficiency of mitochondria (Fig. 5A–C). The same pattern (lower basal respiration, lower ATP-linked respiration, and lower maximal respiratory capacity) was observed after 6 h, indicating that the acute effect of SIM and LOV on respiration is maintained in the first 24 h (data not shown).
Figure 5.
SIM and LOV decrease cellular respiration. OCR after SIM and LOV was determined using a Seahorse XFe96 Analyzer. A, C) Basal respiration, oligo-sensitive respiration, and maximal respiration after uncoupling. B, D) Differences in respiration before and after oligo. A, B) 3-h treatment. C, D) Twenty four-hour treatment. *P < 0.05 vs. baseline from 3 independent experiments.
ATP production
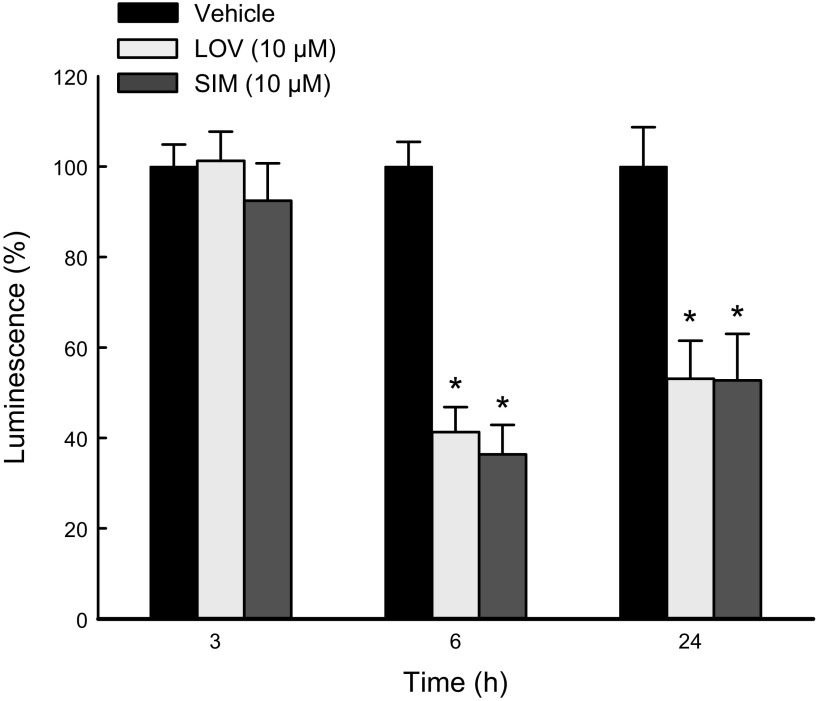
To determine if the decrease in respiration was associated with a decrease in ATP production, we measured ATP using a luminescence assay after treatment with LOV (10 µM) or SIM (10 µM) for 3, 6, and 24 h. LOV and SIM did not decrease ATP at 3 h. Longer exposures to statins caused a drop in ATP. LOV decreased ATP by ∼60 and 48% after 6 and 24 h, respectively. Similarly, ATP dropped by ∼56 and 40% after 6 and 24 h of SIM, respectively (Fig. 6).
Figure 6.
SIM decreases ATP production. ATP in HepG2 cells after SIM for 3, 6, and 24 h was measured as described in Materials and Methods. Absolute values of luminescence were normalized per million cells and expressed as percentages compared with Veh. *P < 0.05 vs. baseline from 3 independent experiments.
Statins do not increase NADH generation
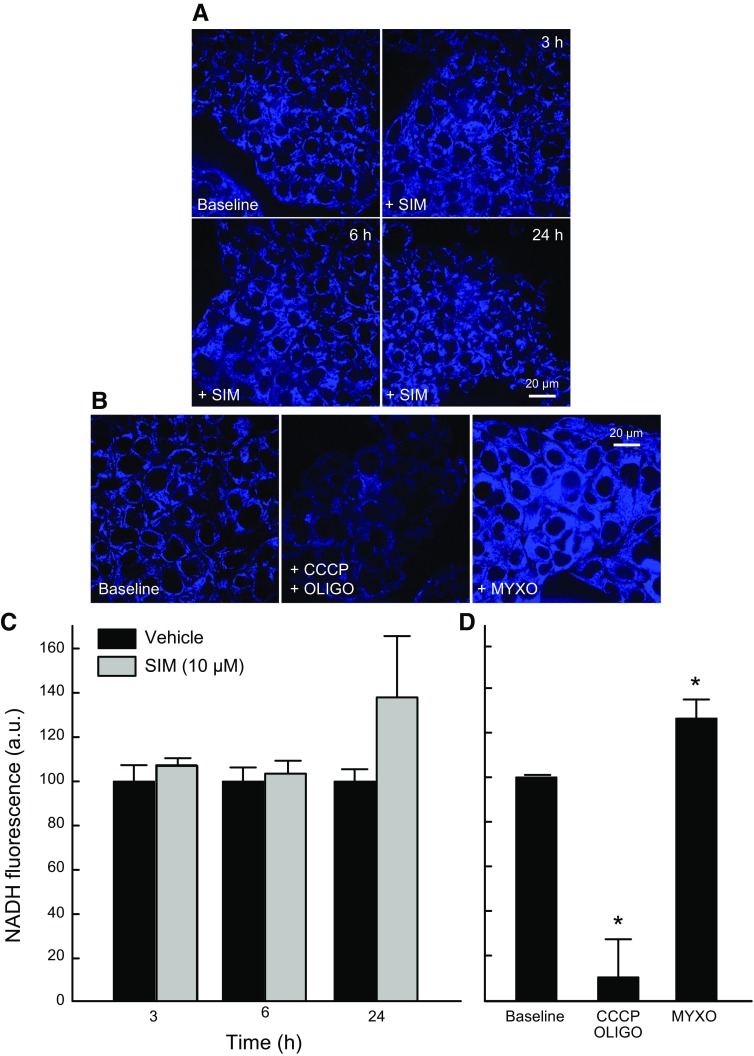
Oxidation of pyruvate, acyl-CoAs, and most other respiratory substrates in mitochondria reduce NAD+ to NADH. To determine if lower respiration was associated with changes in the levels of NADH, we assessed by multiphoton microscopy the effect of SIM (10 µM) on mitochondrial NADH. Multiphoton fluorescence of reduced pyridine nucleotides, NADH, and NADPH arises almost exclusively from mitochondria, because fluorescence of NAD(P)H is highly quenched in the cytosol. NADH remained unchanged after SIM both at 6 and 24 h, suggesting less oxidation of respiratory substrates, possibly as a compensatory mechanism associated with diminished respiration (Fig. 7).
Figure 7.
SIM does not change NADH. HepG2 cells treated with SIM (10 µM) for 3, 6, and 24 h were grown in whole medium and imaged in HBSS. A) NADH autofluorescence after SIM was assessed by multiphoton confocal microscopy as described in Materials and Methods. B, D) CCCP + oligo and Myxo were used as controls of NADH autofluorescence. C) Quantitative analysis of relative NADH autofluorescence from 3 independent experiments. Four to 5 randomly selected fields with 10–20 cells per field were analyzed. A.u., arbitrary units. *P < 0.05 vs. baseline from 3 independent experiments.
Statins do not increase glycolysis
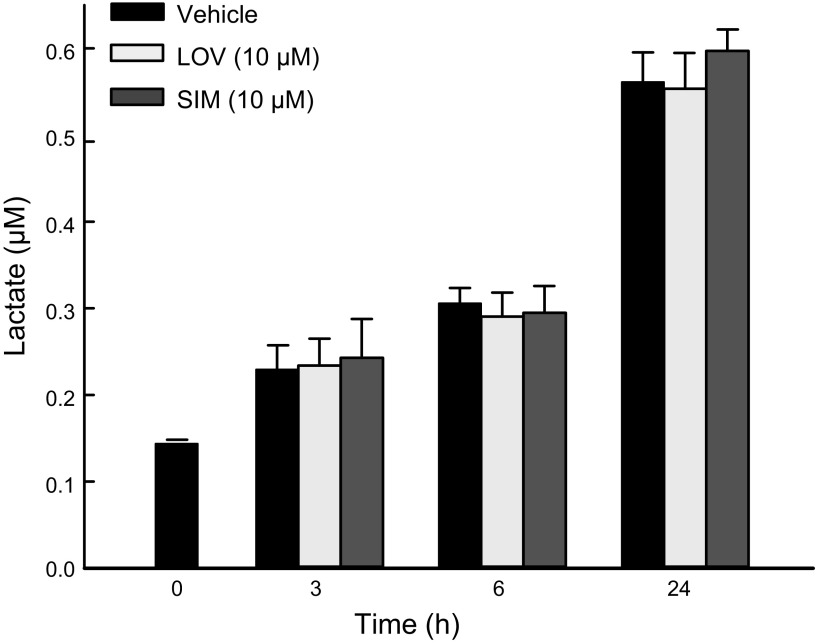
To determine whether decreased oxidative metabolism promoted by statins occurs simultaneously with a compensatory increase in glycolysis, we assessed the effect of LOV (10 µM) and SIM (10 µM) on lactate generation in HepG2 cells. LOV and SIM did not change the rate of lactate formation after 3, 6, and 24 h compared with cells treated with Veh (Fig. 8). These findings indicate that, despite a decrease in mitochondrial metabolism induced by statins, cells did not up-regulate glycolysis.
Figure 8.
SIM and LOV do not increase glycolysis. HepG2 cells were treated with LOV (10 µM) or SIM (10 µM) for 3, 6, and 24 h. Cell-culture medium was collected and lactate was determined as described in Materials and Methods. Analysis of 3 independent experiments.
Statins only partially block oxphos and utilization of glycolytic ATP
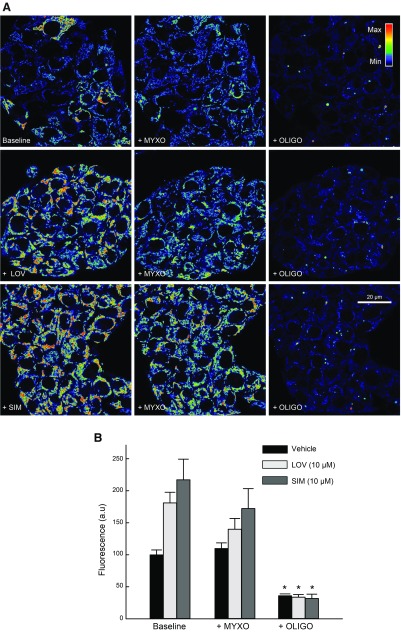
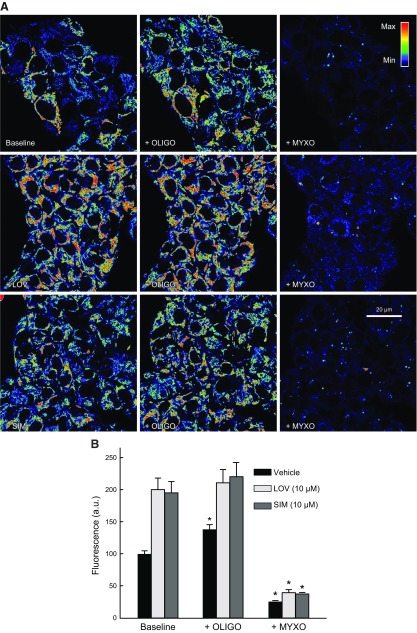
To assess if hyperpolarization induced by statins was caused by changes in the activity of the respiratory chain, the activity of the ATP synthase, or in the utilization of glycolytic ATP, we used combinations of complex III, complex V (ATP F1-F0 synthase), and glycolysis inhibitors. Myxothiazol (Myxo; 10 µM), an inhibitor of complex III, slightly decreased ΔΨ after LOV (10 µM) and SIM (10 µM) but not in Veh-treated cells. Subsequent addition of oligo (10 µg/ml), an inhibitor of the ATP F1-F0 synthase (complex V), collapsed ΔΨ, indicating that after inhibition of the respiratory chain, ΔΨ was maintained by hydrolysis of ATP by the ATP synthase (Fig. 9). When oligo was added first, ΔΨ increased only after Veh but not after LOV or SIM. Subsequent addition of Myxo collapsed ΔΨ in all cases [Fig. 10 and Maldonado et al. (23)]. These findings indicate that, in HepG2 cells, ΔΨ is sustained both by oxphos and ATP hydrolysis, regardless of statin treatments.
Figure 9.
Respiratory chain sustains the formation of ΔΨ after statins. A) HepG2 cells were treated with LOV (10 µM) or SIM (10 µM) for 6 h. Myxo (10 µM) was added and followed for 20 min. Oligo (10 µg/ml) was added sequentially for an additional 20 min. Image intensity was pseudocolored according to the reference bar. B) TMRM fluorescence was quantified against Veh. Four to five randomly selected fields with 10–20 cells/field were analyzed. A.u., arbitrary units. *P < 0.05 from 3 independent experiments.
Figure 10.
Statins do not inhibit ATP synthase. A) HepG2 cells were treated with SIM (10 µM) and LOV (10 µM) for 6 h. Oligo (10 µg/ml) for 20 min was followed by Myxo (10 µM) for additional 20 min. Image intensity was pseudocolored according to the reference bar. B) TMRM fluorescence after each drug was compared with Veh. Four to 5 randomly selected fields with 10–20 cells/field were analyzed. A.u., arbitrary units. *P < 0.05 from 3 independent experiments.
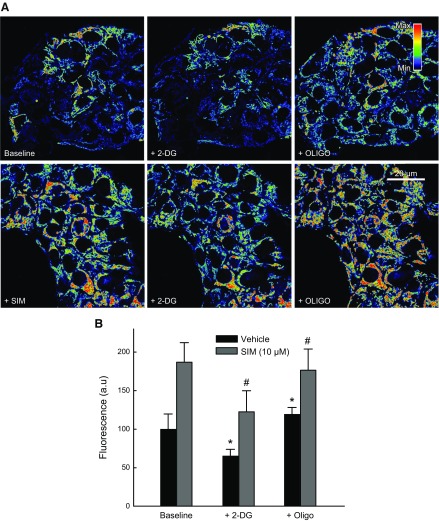
To assess the contribution of the respiratory chain to the formation and maintenance of ΔΨ, we treated cells with oligo after the glycolysis inhibitor 2-DG in cells pretreated with Veh, LOV (10 µM), or SIM (10 µM) for 6 h. 2-DG (50 mM) decreased ΔΨ by ∼35, 68, and 64% after treatment with Veh, SIM, or LOV, respectively. Subsequent addition of oligo increased ΔΨ by ∼54, 52, and 53% in cells treated with Veh, SIM, or LOV, respectively (Fig. 11 and data not shown). These experiments showed that the respiratory chain remains at least partially functional after treatment with statins even after glycolysis inhibition.
Figure 11.
Statins partially block respiratory chain. A) HepG2 cells were treated with SIM (10 µM) for 6 h; 2-DG (50 mM) was added for 20 min followed by oligo (10 µg/ml) for additional 20 min. Image intensity was pseudocolored according to the reference bar. B) Quantitative analysis of TMRM-relative fluorescence after each drug was compared with Veh. Four to 5 randomly selected fields with 10–20 cells per field were analyzed. A.u., arbitrary units. *,#P < 0.05 from 3 independent experiments.
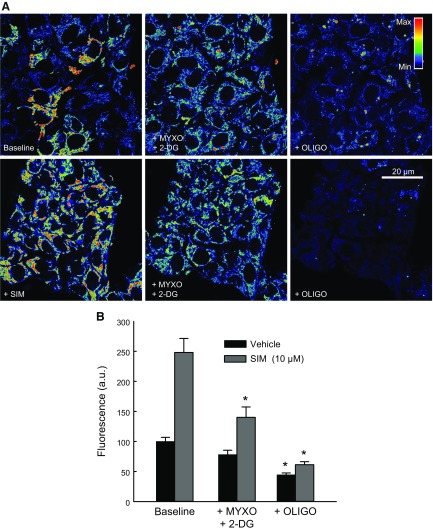
To determine if glycolysis was the source of ATP hydrolyzed by mitochondria after statins, we inhibited respiration and glycolysis using Myxo (10 µM) and 2-DG (50 mM) and sequentially added oligo (10 µg/ml). In Veh-treated cells, 2-DG after Myxo decreased ΔΨ by ∼22%, which dropped by ∼55% after oligo. In cells pretreated with SIM (10 µM) for 6 h, Myxo slightly decreased ΔΨ. Subsequent 2-DG decreased ΔΨ by ∼45%. Oligo following 2-DG dropped ΔΨ by ∼77%. These findings indicate that glycolytic ATP was sustaining ΔΨ when respiration was inhibited in the presence or in the absence of statins (Fig. 12).
Figure 12.
Statins do not block mitochondrial utilization of glycolytic ATP. A) HepG2 cells were treated with SIM (10 µM) for 6 h; 2-DG (50 mM) plus Myxo (10 µM) were followed for 20 min. Subsequent oligo (10 µg/ml) was added for an additional 20 min. Image intensity was pseudocolored according to the reference bar. B) Quantitative analysis of TMRM-relative fluorescence after each drug was compared with Veh. Four to 5 randomly selected fields with 10–20 cells per field were analyzed. A.u., arbitrary units. *,#P < 0.05 from 3 independent experiments.
DISCUSSION
Statins that specifically target the HMG-CoA reductase inhibiting de novo Chol synthesis also display pleiotropic effects (36, 37). Statins have been reported to alter mitochondrial function in skeletal muscle (38, 39), but the information available regarding the effects on mitochondria in cancer cells is scarce (40). Here, we studied the short-term effects (3–24 h) of statins on ΔΨ and mitochondrial metabolism in cancer cells.
We showed that statins induced mitochondrial hyperpolarization in HepG2 and Huh7 hepatocellular carcinoma cells and HCC4006 lung adenocarcinoma cells (Figs. 1–3). The hyperpolarizing effect was dose dependent, being maximal at 3–10 µM for both SIM and LOV (Fig. 1). The increase in ΔΨ after statins was progressive, starting as early as 3 h reaching a maximum at 24 h (Fig. 2). ATOR, a structurally unrelated statin, induced similar changes (data not shown). Our findings were consistent with previous reports. ATOR and SIM, but not fluvastatin, induced mitochondrial hyperpolarization in MCF-7 human breast adenocarcinoma cancer cells loaded with Rhodamine 123 (41). LOV also increased ΔΨ in MCF-7 cells (42). By contrast, other studies showed opposite results. Fluvastatin and pravastatin decreased ∆Ψ assessed by flow cytometry using the mitochondrial potential sensor JC-1 in lymphoma cells and hepatocellular carcinoma cells (43, 44). JC-1 is a ratiometric ∆Ψ-indicating dye that, in the monomeric form, indicates lower ∆Ψ and, in aggregates, indicates a higher ∆Ψ. It remains to be clarified if the difference in mitochondrial polarization between studies was influenced by the different type of dye or the different type of statins used.
To determine if the hyperpolarizing effect of the statins was influenced by the Chol content in cellular membranes, we measured total Chol from whole-cell and mitochondrial membranes. Chol content in both whole-cell and mitochondrial membranes did not change within 24 h of treatment (Fig. 4). Our results indicate that, despite inhibition of the de novo synthesis of Chol induced by statins in cancer cells (29, 31), total Chol remains the same, possibly because the turnover of preexisting Chol is longer than the 24-h period studied here. Moreover, a slow Chol turnover could be a protective mechanism to prevent abrupt disruptions in lipid homeostasis in the intracellular milieu. Similar observations were reported for SIM in C2C12 mouse myocytes, HepG2 cells for 18 h and the prostate cancer cell line C4-2 for 48 h (29–31). Therefore, the mitochondrial hyperpolarization induced by statins is independent of the Chol content in cellular membranes.
The effects of statins on mitochondrial metabolism were also assessed by determining respiration, ATP production, and NADH generation (Figs. 5–7). Oxygen consumption in intact cells not exposed to uncoupling is a reliable indicator of the oxidation of respiratory substrates and oxphos. SIM and LOV decreased basal respiration, ATP-linked respiration, and maximal respiratory capacity. A reduction in basal respiration suggests a decrease in the activity of the respiratory chain or in the oxidation of respiratory substrates by the Krebs cycle. The inhibitory effects of statins on respiration, evident as early as 3 h after treatment, was correlated with a drop in ATP production at 6 and 24 h, but not at 3 h. These findings suggest the onset of transient acute metabolic adjustments to increase nonmitochondrial ATP production or to decrease ATP utilization after statins. Impaired respiration and decreased ATP production are consistent with studies demonstrating an inhibition of the activity of the respiratory chain by statins (29, 45). NADH that fuels the respiratory chain remained unchanged after SIM. It is possible that if statins lower oxphos, the oxidation of respiratory substrates decreases and NADH generation reaches a new equilibrium, which prevents NADH accumulation.
Several cancer cells compensate for a drop in oxphos with an up-regulation in glycolysis (46). Metabolically flexible tumors switch between a predominantly oxidative metabolism to a glycolytic phenotype and vice versa. Nevertheless, the transition is subjected to genetic and epigenetic regulation and may depend on several factors, including time of exposure to a chemical agent or environmental change, magnitude of the mitochondrial or glycolytic inhibition, and differential tumor and cell-line response (27). Partial inhibition of mitochondrial metabolism after statins, as reported here, may still be enough to provide a minimum amount of ATP required for maintenance of cell functions without triggering a compensatory increase in glycolysis. Moreover, it is uncertain if there is a minimum threshold of ATP generation to promote the metabolic rewiring required to switch to a more glycolytic phenotype. Regardless, the lack of compensatory increase in glycolysis after statins raises questions about the mechanisms involved in the lack of adaptation to a glycolytic phenotype (Fig. 8).
Overall, the increased ∆Ψ occurring with a decrease in respiration and ATP production after statins may indicate changes in oxphos and the activity of the ATP synthase. Two general mechanisms contribute to the accumulation of protons in the intermembrane space leading to increased ∆Ψ, namely augmented oxidation of respiratory substrates or inhibition of the ATP synthase. Increased oxidation of respiratory substrates may occur, among other mechanisms, if more metabolites enter mitochondria or the activity of respiratory chain complexes increases (27, 47, 48). If ATP synthase is inhibited by statins, similar to the effects of oligo, protons pumped by complexes I, III, and IV would accumulate in the intermembrane space. In fact, statins in the lactone form inhibit the Qo site of complex III (39). Statins may decrease respiration by this and possibly other mechanisms still to be determined.
We used a combination of specific inhibitors of the respiratory chain to elucidate the relative contribution of oxphos and ATP synthesis to the hyperpolarization induced by statins in intact cells. Myxo was used to inhibit complex III and oligo to inhibit ATP synthase. In Veh-treated cells, Myxo did not decrease ∆Ψ because ATP synthase working in reverse hydrolyzes ATP, pumping protons to the intermembrane space when oxphos is inhibited (23). Subsequent addition of oligo collapsed ∆Ψ, confirming that ∆Ψ after respiratory inhibition was supported by the activity of the ATP synthase. Similar to Veh-treated cells, ∆Ψ was maintained in statin-treated cells after Myxo and collapsed after sequential addition of oligo (Fig. 9). Oligo alone hyperpolarized mitochondria in Veh-treated cells because protons were not pumped to the matrix by the ATP synthase to generate ATP from ADP and Pi. ∆Ψ after oligo in statin-treated cells remained high and did not increase further (Fig. 10). Possibly, hyperpolarized mitochondria after LOV or SIM are already close to a maximum threshold, preventing further increases in ∆Ψ after oligo.
To assess mitochondrial utilization of glycolytic ATP, we used 2-DG to inhibit glycolysis. 2-DG alone partially decreased ∆Ψ (Fig. 11), indicating a modest contribution of glycolytic ATP to the maintenance of ∆Ψ both after Veh and statins. In cells treated with Veh, LOV, SIM, or oligo after 2-DG in the absence of Myxo hyperpolarized mitochondria, indicating a functional respiratory chain sustaining ATP production when glycolysis is inhibited (Fig. 11 and data not shown). By contrast, oligo after Myxo + 2-DG collapsed ∆Ψ, confirming that glycolytic ATP contributes to the formation of ∆Ψ when oxphos is blocked (Fig. 12). These findings indicate that ∆Ψ was maintained by both oxphos and glycolysis.
In summary, our findings indicate that statins hyperpolarize mitochondria and decrease mitochondrial metabolism and ATP production without a compensatory increase in glycolysis. We also show that the respiratory chain and ATP synthase are at least partially functional and that both mitochondrial and glycolytic ATP contribute to the formation and maintenance of ∆Ψ after statins. A functional respiratory chain as assessed by changes in ∆Ψ after the use of inhibitors of the respiratory chain does not preclude the possibility that statins partially inhibit one or more respiratory complexes as suggested by respirometric studies and ATP determinations. It is likely that statin-dependent inhibition of the respiratory chain is incomplete and that the remaining functional capability is enough for the formation of basal ∆Ψ. Our results also show that the short-term effects of statins on mitochondrial metabolism do not cause cytotoxicity.
Further investigations will aim to elucidate if similar effects on mitochondrial metabolism occur in muscles during statin-induced myopathies and if the early effects of statins on mitochondrial metabolism are related to long-term cytotoxic effects in cancer cells.
ACKNOWLEDGMENTS
This work was supported, in part, by the U.S. National Institutes of Health (NIH) National Cancer Institute (NCI) Grant RO1 CA184456 and NIH National Institute of General Medical Sciences Grant P20 GM103542 [Centers of Biomedical Research Excellence (COBRE) Investigator] to E.N.M., and an NCI Administrative Supplement (R01CA184456-02) to M.E.M. The Cell and Molecular Imaging Shared Resource and the Medical University of South Carolina (MUSC) Bioenergetic Profiling Core Facility are supported, in part, by the South Carolina COBRE in Oxidants, Redox Balance, and Stress Signaling (NIH National Institute of General Medical Sciences Grant P20 GM103542). The authors declare no conflicts of interest.
Glossary
- ΔΨ
mitochondrial membrane potential
- 2-DG
2-deoxy-d-glucose
- ATOR
atorvastatin
- C4-2
human prostate cancer cell line
- CCCP
carbonyl cyanide 3-chlorophenylhydrazone
- Chol
cholesterol
- HMGCoA
3-hydroxy-3-methylglutaryl-coenzyme A
- LOV
lovastatin
- Myxo
myxothiazol
- OCR
oxygen consumption rate
- oligo
oligomycin
- oxphos
oxidative phosphorylation
- Pi
inorganic phosphate
- SIM
simvastatin
- TMRM
tetramethylrhodamine methyl ester
- Veh
vehicle
AUTHOR CONTRIBUTIONS
C. F. Christie and D. Fang performed experiments, analyzed data, and contributed to writing the manuscript; E. G. Hunt, M. E. Morris, A. Rovini, K. A. Heslop, G. Beeson, and C. Beeson partially contributed to the experiments; and E. N. Maldonado supervised and coordinated experimentation, data analysis and interpretation, and writing of the manuscript.
REFERENCES
- 1.Goldstein J. L., Brown M. S. (1990) Regulation of the mevalonate pathway. Nature 343, 425–430 [DOI] [PubMed] [Google Scholar]
- 2.Boudreau D. M., Yu O., Johnson J. (2010) Statin use and cancer risk: a comprehensive review. Expert Opin. Drug Saf. 9, 603–621 [DOI] [PMC free article] [PubMed] [Google Scholar]
- 3.Arca M., Pigna G. (2011) Treating statin-intolerant patients. Diabetes Metab. Syndr. Obes. 4, 155–166 [DOI] [PMC free article] [PubMed] [Google Scholar]
- 4.Bitzur R., Cohen H., Kamari Y., Harats D. (2013) Intolerance to statins: mechanisms and management. Diabetes Care 36 (Suppl 2), S325–S330 [DOI] [PMC free article] [PubMed] [Google Scholar]
- 5.Ballantyne C. M., Corsini A., Davidson M. H., Holdaas H., Jacobson T. A., Leitersdorf E., März W., Reckless J. P., Stein E. A. (2003) Risk for myopathy with statin therapy in high-risk patients. Arch. Intern. Med. 163, 553–564 [DOI] [PubMed] [Google Scholar]
- 6.Staffa J. A., Chang J., Green L. (2002) Cerivastatin and reports of fatal rhabdomyolysis. N. Engl. J. Med. 346, 539–540 [DOI] [PubMed] [Google Scholar]
- 7.Thompson P. D., Clarkson P., Karas R. H. (2003) Statin-associated myopathy. JAMA 289, 1681–1690 [DOI] [PubMed] [Google Scholar]
- 8.Ramachandran R., Wierzbicki A. S. (2017) Statins, muscle disease and mitochondria. J. Clin. Med. 6 [DOI] [PMC free article] [PubMed] [Google Scholar]
- 9.Stryjkowska-Góra A., Karczmarek-Borowska B., Góra T., Krawczak K. (2015) Statins and cancers. Contemp. Oncol. (Pozn.) 19, 167–175 [DOI] [PMC free article] [PubMed] [Google Scholar]
- 10.Kawata S., Yamasaki E., Nagase T., Inui Y., Ito N., Matsuda Y., Inada M., Tamura S., Noda S., Imai Y., Matsuzawa Y. (2001) Effect of pravastatin on survival in patients with advanced hepatocellular carcinoma. A randomized controlled trial. Br. J. Cancer 84, 886–891 [DOI] [PMC free article] [PubMed] [Google Scholar]
- 11.Knox J. J., Siu L. L., Chen E., Dimitroulakos J., Kamel-Reid S., Moore M. J., Chin S., Irish J., LaFramboise S., Oza A. M. (2005) A phase I trial of prolonged administration of lovastatin in patients with recurrent or metastatic squamous cell carcinoma of the head and neck or of the cervix. Eur. J. Cancer 41, 523–530 [DOI] [PubMed] [Google Scholar]
- 12.Relja B., Meder F., Wilhelm K., Henrich D., Marzi I., Lehnert M. (2010) Simvastatin inhibits cell growth and induces apoptosis and G0/G1 cell cycle arrest in hepatic cancer cells. Int. J. Mol. Med. 26, 735–741 [DOI] [PubMed] [Google Scholar]
- 13.Shen Y. Y., Yuan Y., Du Y. Y., Pan Y. Y. (2015) Molecular mechanism underlying the anticancer effect of simvastatin on MDA-MB-231 human breast cancer cells. Mol. Med. Rep. 12, 623–630 [DOI] [PubMed] [Google Scholar]
- 14.Wang Y., Xu S. L., Wu Y. Z., Zhao M. S., Xu W. J., Yang H. Y., Li Y. X. (2013) Simvastatin induces caspase-dependent apoptosis and activates P53 in OCM-1 cells. Exp. Eye Res. 113, 128–134 [DOI] [PubMed] [Google Scholar]
- 15.Tomiyama N., Matzno S., Kitada C., Nishiguchi E., Okamura N., Matsuyama K. (2008) The possibility of simvastatin as a chemotherapeutic agent for all-trans retinoic acid-resistant promyelocytic leukemia. Biol. Pharm. Bull. 31, 369–374 [DOI] [PubMed] [Google Scholar]
- 16.Warburg O. (1956) On the origin of cancer cells. Science 123, 309–314 [DOI] [PubMed] [Google Scholar]
- 17.Keibler M. A., Wasylenko T. M., Kelleher J. K., Iliopoulos O., Vander Heiden M. G., Stephanopoulos G. (2016) Metabolic requirements for cancer cell proliferation. Cancer Metab. 4, 16 [DOI] [PMC free article] [PubMed] [Google Scholar]
- 18.Liberti M. V., Locasale J. W. (2016) The Warburg effect: how does it benefit cancer cells? Trends Biochem. Sci. 41, 211–218; erratum: 287 [DOI] [PMC free article] [PubMed] [Google Scholar]
- 19.Griguer C. E., Oliva C. R., Gillespie G. Y. (2005) Glucose metabolism heterogeneity in human and mouse malignant glioma cell lines. J. Neurooncol. 74, 123–133 [DOI] [PubMed] [Google Scholar]
- 20.Moreno-Sánchez R, Rodríguez-Enríquez S., Marín-Hernández A., Saavedra E. (2007) Energy metabolism in tumor cells. FEBS J. 274, 1393–1418 [DOI] [PubMed] [Google Scholar]
- 21.Maldonado E. N. (2009) Assessment of respiration-dependent intra- and extramitochondrial ATP turnover: HepG2 cancer cells do not utilize ATP from oxidative phosphorylation in the cytosol. Biophys. J. 96, 245A [Google Scholar]
- 22.Maldonado E. N., DeHart D. N., Patnaik J., Klatt S. C., Gooz M. B., Lemasters J. J. (2016) ATP/ADP turnover and import of glycolytic ATP into mitochondria in cancer cells is independent of the adenine nucleotide translocator. J. Biol. Chem. 291, 19642–19650; erratum: 292, 16969 [DOI] [PMC free article] [PubMed] [Google Scholar]
- 23.Maldonado E. N., Patnaik J., Mullins M. R., Lemasters J. J. (2010) Free tubulin modulates mitochondrial membrane potential in cancer cells. Cancer Res. 70, 10192–10201 [DOI] [PMC free article] [PubMed] [Google Scholar]
- 24.Maldonado E. N., Sheldon K. L., DeHart D. N., Patnaik J., Manevich Y., Townsend D. M., Bezrukov S. M., Rostovtseva T. K., Lemasters J. J. (2013) Voltage-dependent anion channels modulate mitochondrial metabolism in cancer cells: regulation by free tubulin and erastin. J. Biol. Chem. 288, 11920–11929 [DOI] [PMC free article] [PubMed] [Google Scholar]
- 25.Fang D., Maldonado E. N. (2018) VDAC regulation: a mitochondrial target to stop cell proliferation. Adv. Cancer Res. 138, 41–69 [DOI] [PMC free article] [PubMed] [Google Scholar]
- 26.Kerkweg U., Jacob M., De Groot H., Mannherz H. G., Rauen U. (2003) Cold-induced apoptosis of rat liver endothelial cells: contribution of mitochondrial alterations. Transplantation 76, 501–508 [DOI] [PubMed] [Google Scholar]
- 27.Maldonado E. N. (2017) VDAC-Tubulin, an anti-Warburg pro-oxidant switch. Front. Oncol. 7, 4 [DOI] [PMC free article] [PubMed] [Google Scholar]
- 28.Bergstrom J. D., Bostedor R. G., Rew D. J., Geissler W. M., Wright S. D., Chao Y. S. (1998) Hepatic responses to inhibition of 3-hydroxy-3-methylglutaryl-CoA reductase: a comparison of atorvastatin and simvastatin. Biochim. Biophys. Acta 1389, 213–221 [DOI] [PubMed] [Google Scholar]
- 29.Mullen P. J., Lüscher B., Scharnagl H., Krähenbühl S., Brecht K. (2010) Effect of simvastatin on cholesterol metabolism in C2C12 myotubes and HepG2 cells, and consequences for statin-induced myopathy. Biochem. Pharmacol. 79, 1200–1209 [DOI] [PubMed] [Google Scholar]
- 30.Scharnagl H., Schinker R., Gierens H., Nauck M., Wieland H., März W. (2001) Effect of atorvastatin, simvastatin, and lovastatin on the metabolism of cholesterol and triacylglycerides in HepG2 cells. Biochem. Pharmacol. 62, 1545–1555 [DOI] [PubMed] [Google Scholar]
- 31.Kim J. H., Cox M. E., Wasan K. M. (2014) Effect of simvastatin on castration-resistant prostate cancer cells. Lipids Health Dis. 13, 56 [DOI] [PMC free article] [PubMed] [Google Scholar]
- 32.Lemasters J. J., Ramshesh V. K. (2007) Imaging of mitochondrial polarization and depolarization with cationic fluorophores. Methods Cell Biol. 80, 283–295 [DOI] [PubMed] [Google Scholar]
- 33.Bligh E. G., Dyer W. J. (1959) A rapid method of total lipid extraction and purification. Can. J. Biochem. Physiol. 37, 911–917 [DOI] [PubMed] [Google Scholar]
- 34.Beeson C. C., Beeson G. C., Schnellmann R. G. (2010) A high-throughput respirometric assay for mitochondrial biogenesis and toxicity. Anal. Biochem. 404, 75–81 [DOI] [PMC free article] [PubMed] [Google Scholar]
- 35.Gerencser A. A., Neilson A., Choi S. W., Edman U., Yadava N., Oh R. J., Ferrick D. A., Nicholls D. G., Brand M. D. (2009) Quantitative microplate-based respirometry with correction for oxygen diffusion. Anal. Chem. 81, 6868–6878 [DOI] [PMC free article] [PubMed] [Google Scholar]
- 36.Allen S. C., Mamotte C. D. S. (2017) Pleiotropic and adverse effects of statins-do epigenetics play a role? J. Pharmacol. Exp. Ther. 362, 319–326 [DOI] [PubMed] [Google Scholar]
- 37.Zeiser R. (2018) Immune modulatory effects of statins. Immunology 154, 69–75 [DOI] [PMC free article] [PubMed] [Google Scholar]
- 38.Du Souich P., Roederer G., Dufour R. (2017) Myotoxicity of statins: mechanism of action. Pharmacol. Ther. 175, 1–16 [DOI] [PubMed] [Google Scholar]
- 39.Schirris T. J., Renkema G. H., Ritschel T., Voermans N. C., Bilos A., van Engelen B. G., Brandt U., Koopman W. J., Beyrath J. D., Rodenburg R. J., Willems P. H., Smeitink J. A., Russel F. G. (2015) Statin-induced myopathy is associated with mitochondrial complex III inhibition. Cell Metab. 22, 399–407 [DOI] [PubMed] [Google Scholar]
- 40.Gazzerro P., Proto M. C., Gangemi G., Malfitano A. M., Ciaglia E., Pisanti S., Santoro A., Laezza C., Bifulco M. (2012) Pharmacological actions of statins: a critical appraisal in the management of cancer. Pharmacol. Rev. 64, 102–146 [DOI] [PubMed] [Google Scholar]
- 41.Sánchez C. A., Rodríguez E., Varela E., Zapata E., Páez A., Massó F. A., Montaño L. F., Lóopez-Marure R. (2008) Statin-induced inhibition of MCF-7 breast cancer cell proliferation is related to cell cycle arrest and apoptotic and necrotic cell death mediated by an enhanced oxidative stress. Cancer Invest. 26, 698–707 [DOI] [PubMed] [Google Scholar]
- 42.Wei N., Mi M. T., Zhou Y. (2007) Influences of lovastatin on membrane ion flow and intracellular signaling in breast cancer cells. Cell. Mol. Biol. Lett. 12, 1–15 [DOI] [PMC free article] [PubMed] [Google Scholar]
- 43.Qi X. F., Zheng L., Lee K. J., Kim D. H., Kim C. S., Cai D. Q., Wu Z., Qin J. W., Yu Y. H., Kim S. K. (2013) HMG-CoA reductase inhibitors induce apoptosis of lymphoma cells by promoting ROS generation and regulating Akt, Erk and p38 signals via suppression of mevalonate pathway. Cell Death Dis. 4, e518 [DOI] [PMC free article] [PubMed] [Google Scholar]
- 44.Sutter A. P., Maaser K., Höpfner M., Huether A., Schuppan D., Scherübl H. (2005) Cell cycle arrest and apoptosis induction in hepatocellular carcinoma cells by HMG-CoA reductase inhibitors. Synergistic antiproliferative action with ligands of the peripheral benzodiazepine receptor. J. Hepatol. 43, 808–816 [DOI] [PubMed] [Google Scholar]
- 45.Mullen P. J., Zahno A., Lindinger P., Maseneni S., Felser A., Krähenbühl S., Brecht K. (2011) Susceptibility to simvastatin-induced toxicity is partly determined by mitochondrial respiration and phosphorylation state of Akt. Biochim. Biophys. Acta 1813, 2079–2087 [DOI] [PubMed] [Google Scholar]
- 46.Cui Q., Wen S., Huang P. (2017) Targeting cancer cell mitochondria as a therapeutic approach: recent updates. Future Med. Chem. 9, 929–949 [DOI] [PubMed] [Google Scholar]
- 47.Lemasters J. J. (2017) Evolution of voltage-dependent anion channel function: from molecular sieve to governator to actuator of ferroptosis. Front. Oncol. 7, 303 [DOI] [PMC free article] [PubMed] [Google Scholar]
- 48.Manjeri G. R., Rodenburg R. J., Blanchet L., Roelofs S., Nijtmans L. G., Smeitink J. A., Driessen J. J., Koopman W. J., Willems P. H. (2016) Increased mitochondrial ATP production capacity in brain of healthy mice and a mouse model of isolated complex I deficiency after isoflurane anesthesia. J. Inherit. Metab. Dis. 39, 59–65 [DOI] [PMC free article] [PubMed] [Google Scholar]


