Abstract
Background:
RTOG-0129 recursive partitioning analysis was the basis for risk-based therapeutic intensification trials for oropharynx cancer (OPC). Whether RTOG-0129 overall survival (OS) estimates for low-, intermediate- and high-risk groups are similar in other datasets or applicable to progression-free survival (PFS) is unknown. Therefore, we evaluated whether survival differences between RTOG-0129 risk groups persist at 5 years, are reproducible in an independent clinical trial, applicable to PFS and whether toxicities differ across risk groups.
Methods:
Prospective randomized clinical trials were retrospectively analyzed. RTOG-0129 evaluated standard vs. accelerated fractionation (AFX) radiotherapy concurrent with cisplatin. RTOG-0522 compared cisplatin-AFX ± cetuximab. OPC patients with available p16 status and tobacco history were eligible.
Results:
260 and 287 patients from RTOG-0129 and RTOG-0522 with median follow-up for surviving patients of 7.9 years (range 1.7-9.9) and 4.7 years (range 0.1-7.0), respectively. Previous OS differences in RTOG-0129 persisted at 5-years. In RTOG-0522, the 5-year OS for low-, intermediate- and high-risk groups were 88.1%, 69.9% and 45.1%, respectively (p-trend<0.001); 5-year PFS was 72.9%, 56.1% and 42.2%, respectively. In a subgroup of very good risk patients (p16-positive, ≤10 pack-years and T1-2 with ipsilateral ≤6centimeter nodes or T3 without contralateral or >6 centimeter nodes) 5-year OS and PFS were 93.8% and 82.2%, respectively in RTOG-0522. Overall rates of acute and late toxicities were similar by risk-groups.
Conclusions:
RTOG-0129 risk groups persist at 5 years, are reproducible in RTOG-0522, however there is variability in estimates. These data underscore the importance of long-term follow-up and appropriate patient selection in therapeutic de-intensification trials.
Clinical trials:
Keywords: oropharynx cancer, head and neck cancer, HPV
Precis:
Whether RTOG-0129 overall survival (OS) estimates for low-, intermediate- and high-risk groups are similar in other datasets or applicable to progression-free survival (PFS) is unknown. RTOG-0129 risk groups persist at 5 years, are reproducible in RTOG-0522, apply to PFS, however there is variability in estimates which underscores the importance of long term follow up in therapeutic de-intensification.
Introduction
Human papillomavirus (HPV) tumor status is the most influential determinant of survival for oropharynx cancer (OPC).1,2 The RTOG-0129 recursive partitioning analysis (RPA) identified three distinct groups at low-, intermediate- or high-risk of death and introduced the concept of therapeutic de-intensification for the low-risk group.1 While the authors cautioned that the model would require validation in other cohorts prior to implementation of therapeutic de-intensification for select low-risk patients in clinical trials,1 such data do not yet exist. It is also unknown whether the observed overall survival differences across risk groups in RTOG-0129 persist with longer follow-up, and if they can be extrapolated to progression-free survival. These data are important to determine whether the low-risk group as defined by the RTOG-0129 RPA is indeed at low-risk of progression and thus the ideal group for de-intensification.
Therapeutic de-intensification requires accurate and generalizable risk-stratification. Clinical staging is an alternative form of risk stratification, which has historically served as eligibility criteria for trials; it is unknown how the new 8th edition American Joint Committee on Cancer (AJCC)3 staging performs in a clinical trial cohort. Additionally, an underpinning of therapeutic de-intensification is reduction of toxicities for the low-risk patients; whether they experience toxicities differently from other risk groups is unknown.
For the success of therapeutic de-intensification, a group with predictable and durable high progression-free survival (PFS) and overall survival (OS) is crucial. Therefore, 5-year survival data in RTOG-0129 was evaluated to determine whether the previously reported 3-year estimates of overall survival were sustained, whether they apply to progression- free survival, and data from RTOG-0522 were utilized to ascertain whether RTOG-0129 risk groups were reproducible in an independent cohort.
Methods
Protocol and Treatment
This was a retrospective analysis using data from prospective clinical trials RTOG-0129 and RTOG-0522.1,4 RTOG-0129 was a phase III trial comparing standard fractionation chemoradiotherapy with concurrent cisplatin (SFX; 70 Gy in 35 fractions [2 Gy per fraction] over seven weeks) to accelerated fractionation by concomitant boost radiotherapy (AFX-C) with concurrent cisplatin (72 Gy delivered in 42 fractions over six weeks, inclusive of twice-a-day irradiation for 12 treatment days).1 RTOG-0522 was a phase III trial testing the addition of cetuximab to radiation therapy (IMRT 70 Gy in 35 fractions [2 Gy per fraction] over 6 weeks, 6 fractions/week) with concurrent cisplatin for patients with advanced head and neck cancer.4 Chemotherapy consisted of intravenous cisplatin 100 mg/m2 of body surface area on days 1, 22 and 43 for SFX and on days 1 and 22 for AFX-C. Cetuximab dose was intravenous 400 mg/m2 the week before radiotherapy, then 250 mg/m2 weekly during radiotherapy.15 Eligibility included: stage III-IV5, Zubrod performance status 0-1, age ≥18 years, adequate hematopoietic, hepatic, and renal function. Both were approved by institutional review boards.
History of cigarette smoking in pack-years was obtained at study enrollment by interviewer-administered questionnaire. To assess disease status, follow-up exam and imaging studies were performed quarterly for two years, biannually through year five and then annually.
Patients eligible for this analysis had OPC with evaluable p16 expression status and available smoking data. Characteristics of patients eligible and ineligible are summarized in Supplemental Table 1.
Laboratory analysis
HPV status was evaluated by tumor p16 expression, as previously described1, an established surrogate in OPC16. p16 expression was positive if strong and diffuse nuclear and cytoplasmic staining was present in ≥70% of tumor cells16. HPV in situ hybridization (ISH) results, as previously described1, were available for RTOG-0129 and used in one analysis to compare survival outcomes for p16 and HPV ISH.
Risk groups
RTOG-0129 risk groups were previously described in detail.1 In summary, HPV-positive patients with low tobacco exposure (regardless of T- or N-classification) or >10 pack-years and one ipsilateral lymph node <6 centimeter (regardless of T-classification) comprised the low-risk category. Intermediate-risk included both HPV-positive patients with >10 pack-years and advanced nodal disease (multiple ipsilateral, ≥1 contralateral, or any node >6 centimeter), as well as HPV-negative patients with low tobacco exposure and <T4. High-risk category was reserved for HPV-negative patients with >10 pack-years or T4.
Toxicities
In RTOG-0129, chemotherapy and acute (≤ 90 days after start of radiotherapy) radiation therapy toxicities were graded with Common Toxicity Criteria version 2.06 and late radiation toxicities by the RTOG/EORTC criteria.7 All toxicities in RTOG-0522 were graded with Common Terminology Criteria for Adverse events version 3.0.8 Supplemental Table 2 shows how toxicities were combined for analysis.
Statistical analysis
Overall survival (OS) was defined as death due to any cause and was measured from date of randomization. Progression-free survival (PFS) was defined by local, regional, or distant progression or death due to any cause and was measured from date of randomization. Survival post-progression was defined as death due to any cause and measured from date of first recurrence.
Survival rates were estimated by Kaplan-Meier method and risk groups were compared by two-sided log-rank test.9 Hazard ratios (HR) comparing risk groups were estimated using Cox model. Grade 3+ toxicity rates were compared between risk groups by Pearson chi-square test.
Results
Characteristics of study population
Participants in RTOG-0129 and RTOG-0522 with OPC comprised the study population.1,4 Briefly, the majority of study participants were male, white, with good performance status. The mean age was 56 years. The study population was stratified into low- (n=263), intermediate- (n=166), and high-risk (n=118) groups based upon pre-treatment characteristics (Table 1). Low-risk patients were significantly younger than intermediate- and high-risk patients (p<0.001). The low- and intermediate-risk groups had a higher percentage of white patients compared to the high-risk group (p=0.003). As expected, risk groups differed by tobacco exposure and AJCC 7th edition tumor and nodal stage. The distribution of participants with improved performance status, anemia, and tumors of the tonsil or base of tongue differed across risk groups (p<0.05 for all). For example, the high-risk group had more patients with soft palate and pharyngeal wall tumors, anemia and Zubrod performance status 1 at diagnosis (p<0.05 for all).
Table 1.
Patient and tumor characteristics by risk group for overall study population including RTOG-0129 and RTOG-0522
| Low-risk (n=263) | Intermediate-risk (n=166) | High-risk (n=118) | p-value | |
|---|---|---|---|---|
| Age (years) | 0.0002 [1] | |||
| Mean | 54.4 | 55.9 | 58.1 | |
| Std. Dev. | 8.29 | 7.37 | 7.88 | |
| Median | 54 | 56 | 58 | |
| Min – Max | 31 - 78 | 38 - 76 | 37 - 79 | |
| Q1 - Q3 | 49 - 60 | 51 - 61 | 53 - 64 | |
| Gender | 0.3267 [2] | |||
| Male | 235 (89.4%) | 145 (87.3%) | 99 (83.9%) | |
| Female | 28 (10.6%) | 21 (12.7%) | 19 (16.1%) | |
| Race | 0.0027 [2] | |||
| American Indian or Alaskan native | 3 (1.1%) | 0 (0.0%) | 1 (0.8%) | |
| Asian | 3 (1.1%) | 0 (0.0%) | 1 (0.8%) | |
| Black or African-American | 11 (4.2%) | 9 (5.4%) | 18 (15.3%) | |
| White | 242 (92.0%) | 157 (94.6%) | 98 (83.1%) | |
| Unknown | 4 (1.5%) | 0 (0.0%) | 0 (0.0%) | |
| Zubrod performance status | 0.0046 [2] | |||
| 0 | 191 (72.6%) | 116 (69.9%) | 66 (55.9%) | |
| 1 | 72 (27.4%) | 50 (30.1%) | 52 (44.1%) | |
| Hemoglobin (g/dL) | 0.0036 [1] | |||
| Mean | 14.3 | 14.2 | 13.8 | |
| Std. Dev. | 1.45 | 1.42 | 1.70 | |
| Median | 14.5 | 14.4 | 13.9 | |
| Min - Max | 8.7 - 18.2 | 9.9 - 17.9 | 8.9 - 18.6 | |
| Q1 - Q3 | 13.6 - 15.3 | 13.3 - 15.3 | 12.9 - 14.9 | |
| Anemic | 0.0024 [2] | |||
| No | 209 (79.5%) | 120 (72.3%) | 74 (62.7%) | |
| Yes | 54 (20.5%) | 46 (27.7%) | 44 (37.3%) | |
| Smoking history: pack-years | <0.0001 [1] | |||
| Mean | 7.8 | 32.6 | 41.9 | |
| Std. Dev. | 18.12 | 24.57 | 23.97 | |
| Median | 0 | 30 | 40 | |
| Min - Max | 0 - 152 | 0 - 150 | 0 - 104 | |
| Q1 - Q3 | 0 - 7 | 15 - 45 | 28 - 57.5 | |
| Primary site | 0.0002 [2] | |||
| Oropharynx, NOS | 25 (9.5%) | 18 (10.8%) | 14 (11.9%) | |
| Tonsillar fossa, tonsil | 104 (39.5%) | 72 (43.4%) | 39 (33.1%) | |
| Base of tongue | 125 (47.5%) | 73 (44.0%) | 47 (39.8%) | |
| Pharyngeal oropharynx | 5 (1.9%) | 2 (1.2%) | 10 (8.5%) | |
| Soft palate | 4 (1.5%) | 1 (0.6%) | 8 (6.8%) | |
| p16 status | <0.0001 [2] | |||
| p16-negative | 0 (0.0%) | 27 (16.3%) | 118 (100.0%) | |
| p16-positive | 263 (100.0%) | 139 (83.7%) | 0 (0.0%) | |
| T stage | <0.0001 [1] | |||
| T2 | 119 (45.2%) | 69 (41.6%) | 30 (25.4%) | |
| T3 | 80 (30.4%) | 63 (38.0%) | 30 (25.4%) | |
| T4 | 64 (24.3%) | 34 (20.5%) | 58 (49.2%) | |
| N stage | <0.0001 [1] | |||
| N0 | 24 (9.1%) | 1 (0.6%) | 10 (8.5%) | |
| N1 | 39 (14.8%) | 3 (1.8%) | 19 (16.1%) | |
| N2a | 50 (19.0%) | 4 (2.4%) | 9 (7.6%) | |
| N2b | 85 (32.3%) | 77 (46.4%) | 37 (31.4%) | |
| N2c | 47 (17.9%) | 57 (34.3%) | 35 (29.7%) | |
| N3 | 18 (6.8%) | 24 (14.5%) | 8 (6.8%) | |
| AJCC stage | 0.0003 [2] | |||
| III | 37 (14.1%) | 4 (2.4%) | 11 (9.3%) | |
| IV | 226 (85.9%) | 162 (97.6%) | 107 (90.7%) |
Std. Dev., standard deviation; Q1, first quartile; Q3, third quartile.
Kruskal-Wallis test.
Pearson chi-square test. Race was tested as white vs. others.
Durability of risk groups with longer follow up in RTOG-0129
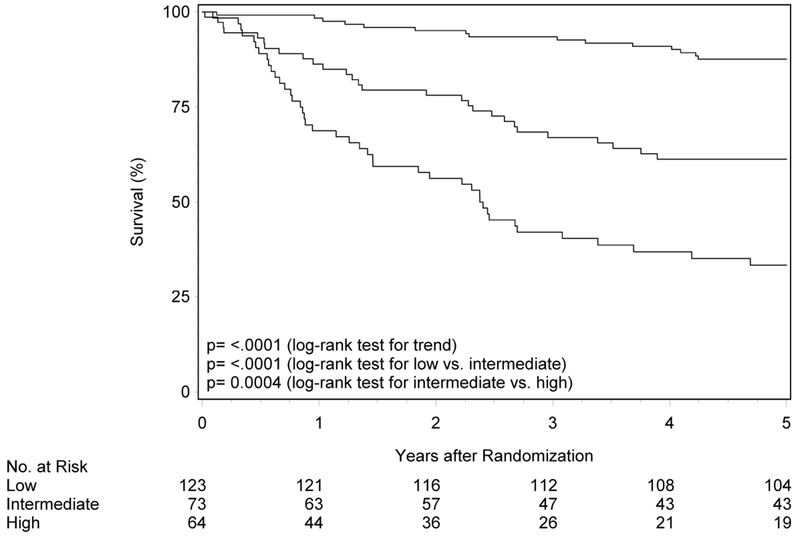
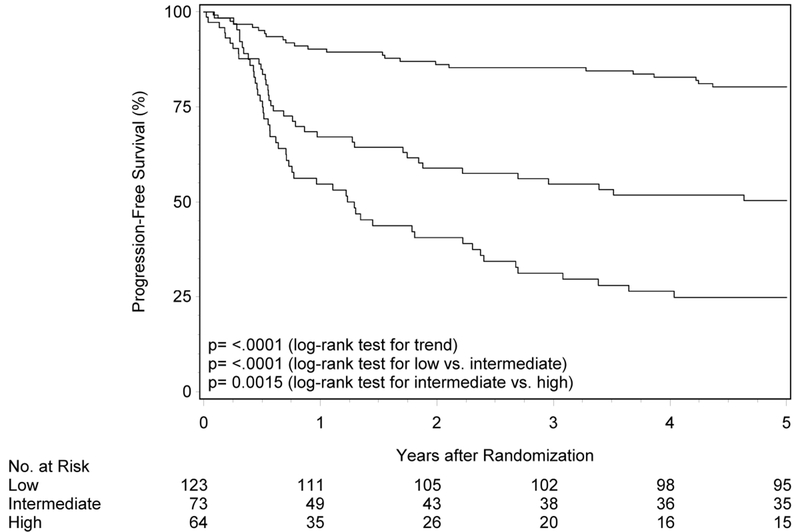
The initial description of risk groups was based upon 3-year estimates of survival.1 To determine whether the previously described differences in OS and PFS by risk group persist with longer follow-up, Kaplan-Meier analysis was performed in RTOG-0129 (n=260; Figure 1 panels A and B, Table 2). Median follow-up for surviving patients was 7.9 years (range 1.7-9.9). Almost half of RTOG-0129 study participants were in the low-risk group (n=123, 47.3%), while the remainder were in the intermediate- (n=73, 28.1%) and high-risk groups (n=64, 24.6%). At five years, OS of the low-, intermediate- and high-risk groups remained different (87.6% [95%CI 81.7-93.5], 61.3% [95%CI 50.0-72.5], and 33.4% [95%CI 21.6-45.2]; ptrend<0.001). Similarly, the risk groups were different with respect to PFS at five years (80.3% [95%CI 73.2-87.4], 50.4% [95%CI 38.8-61.9] and 24.7% [95%CI 14.1-35.4]; ptrend<0.001). Long-term OS and PFS by risk group were similar by HPV ISH and p16 (Supplemental Figure 1; p-valuerange 0.39-0.86).
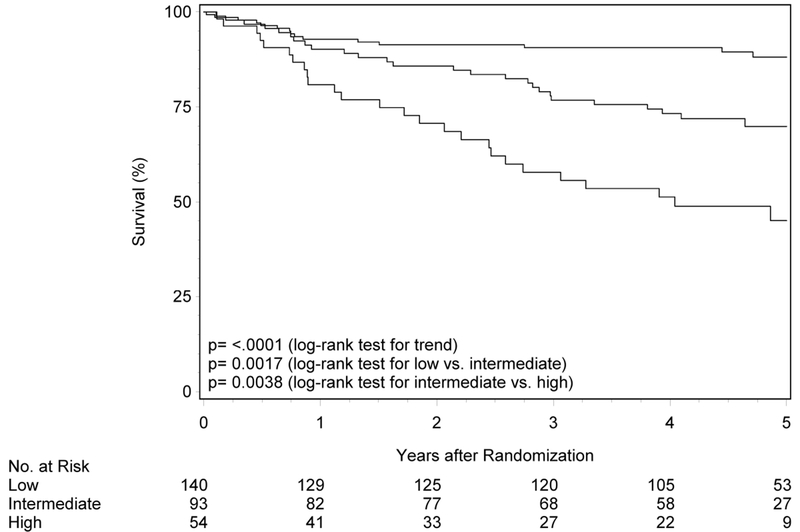
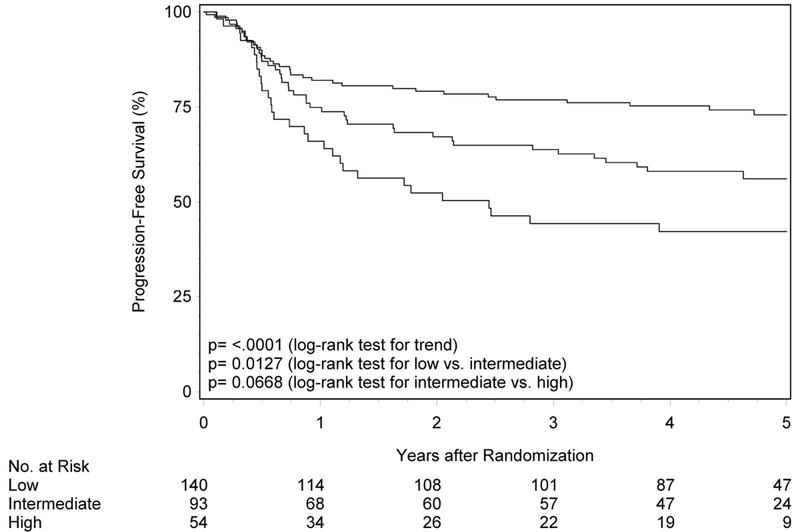
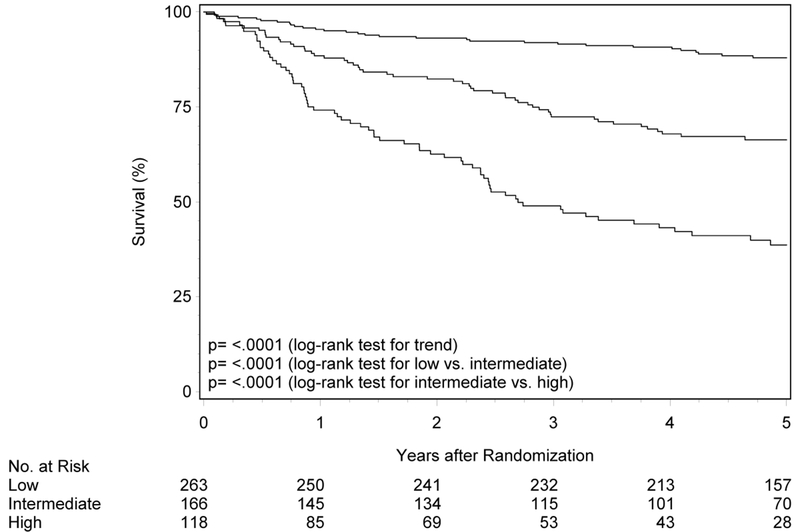
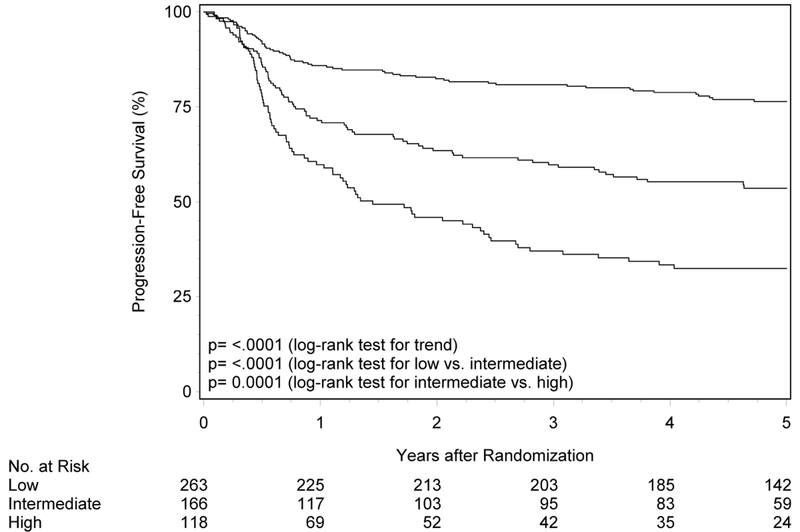
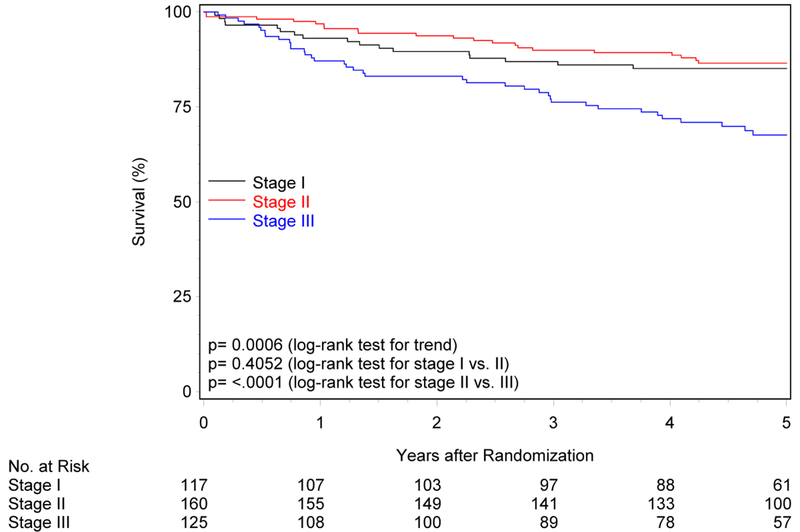
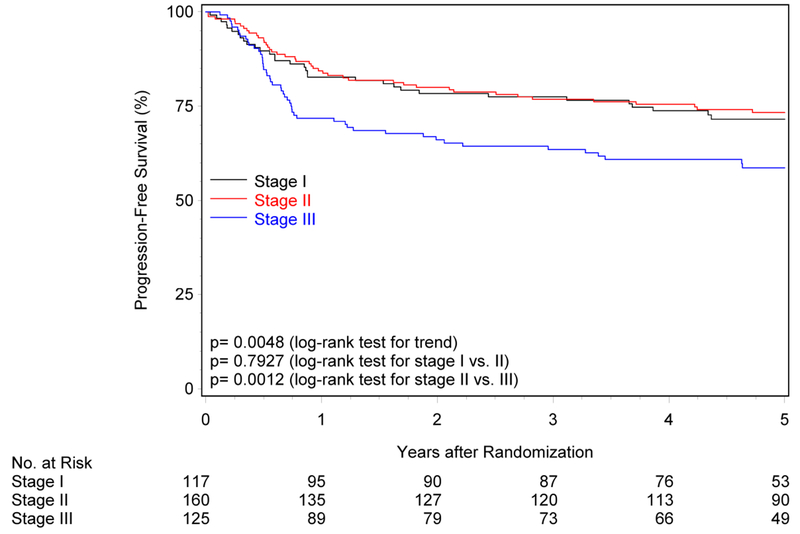
Figure 1. Overall and progression-free survival by risk group and trial.
Panels A and B show overall and progression-free survival by risk group in RTOG-0129. Panels C and D show overall and progression-free survival by risk group in RTOG-0522. Panels E and F show overall and progression-free survival by risk group in the studies combined. Panels G and F show overall and progression-free survival by 8th edition AJCC stage for p16-positive cancers in the combined study population (RTOG-0129 and RTOG-0522).
Table 2.
Overall and progression-free survival by risk group and trial
| n (%) | Events | 5-year estimate (95%CI) | Hazard ratio (95%CI) | |
|---|---|---|---|---|
|
Overall survival | ||||
| RTOG-0129 | ||||
| Low-risk | 123 (47.3%) | 24 | 87.6% (81.7-93.5) | Reference |
| Intermediate-risk | 73 (28.1%) | 34 | 61.3% (50.0-72.5) | 3.06 (1.82-5.17) |
| High-risk | 64 (24.6%) | 47 | 33.4% (21.6-45.2) | 6.90 (4.19-11.35) |
| RTOG-0522 | ||||
| Low-risk | 140 (48.8%) | 16 | 88.1% (82.3-94.0) | Reference |
| Intermediate-risk | 93 (32.4%) | 26 | 69.9% (59.9-79.8) | 2.63 (1.41-4.91) |
| High-risk | 54 (18.8%) | 26 | 45.1% (30.2-60.0) | 5.66 (3.03-10.58) |
| Overall | ||||
| Low-risk | 263 (48.1%) | 40 | 87.9% (83.9-92.0) | Reference |
| Intermediate-risk | 166 (30.3%) | 60 | 66.4% (59.0-73.7) | 2.83 (1.90-4.23) |
| High-risk | 118 (21.6%) | 73 | 38.7% (29.4-48.0) | 6.49 (4.40-9.57) |
|
Progression-free survival | ||||
| RTOG-0129 | ||||
| Low-risk | 123 (47.3%) | 31 | 80.3% (73.2-87.4) | Reference |
| Intermediate-risk | 73 (28.1%) | 40 | 50.4% (38.8-61.9) | 2.89 (1.81-4.63) |
| High-risk | 64 (24.6%) | 52 | 24.7% (14.1-35.4) | 5.70 (3.63-8.96) |
| RTOG-0522 | ||||
| Low-risk | 140 (48.8%) | 36 | 72.9% (65.2-80.6) | Reference |
| Intermediate-risk | 93 (32.4%) | 39 | 56.1% (45.6-66.7) | 1.77 (1.12-2.78) |
| High-risk | 54 (18.8%) | 30 | 42.2% (28.7-55.8) | 2.71 (1.67-4.41) |
| Overall | ||||
| Low-risk | 263 (48.1%) | 67 | 76.4% (71.2-81.7) | Reference |
| Intermediate-risk | 166 (30.3%) | 79 | 53.6% (45.9-61.4) | 2.25 (1.62-3.12) |
| High-risk | 118 (21.6%) | 82 | 32.5% (23.9-41.1) | 4.06 (2.93-5.62) |
CI, confidence interval.
External validation of risk groups in RTOG-0522
To validate the prognostic risk groups in an independent cohort, Kaplan-Meier analysis was performed in RTOG-0522 (n=287; Figure 1 panels C and D, Table 2). The median follow-up for surviving participants was 4.7 years (range 0.1-7.0). Most patients in RTOG-0522 were in the low-risk group (n=140, 48.8%), and the remainder were in the intermediate- (n=93, 32.4%) and high-risk (n=54, 18.8%) groups. OS was significantly different across risk groups (p=0.002 for low vs. intermediate; p=0.004 for intermediate vs. high; ptrend<0.001). Five-year OS was 88.1% (95%CI 82.3-94.0), 69.9% (95%CI 59.9-79.8) and 45.1% (95%CI 30.2-60.0) for the low-, intermediate-, and high-risk groups, respectively. Similarly, patients in the low-risk group had better PFS relative to patients in the intermediate-risk group (p=0.01) and the intermediate-risk group had better PFS than the high-risk group, although non-significant (p=0.07; ptrend<0.001). Five-year estimates of PFS were 72.9% (95%CI 65.2-80.6), 56.1% (95%CI 45.6-66.7), and 42.2% (95%CI 28.7-55.8) for the low-, intermediate-, and high-risk groups, respectively.
Of note, PFS for the low-risk group in RTOG-0522 was lower than that observed in RTOG-0129 (72.9%vs. 80.3%). The majority of recurrences were observed in the first year in both trials and the pattern of first failure is shown in Table 3. Although half of the recurrences in RTOG-0129 were locoregional (10 of 20), in RTOG-0522 the majority were locoregional (20 of 29, 69%). Patient and treatment characteristics of low-risk patients who experienced locoregional failures (LRF) are summarized in Supplemental Table 3. In RTOG-0129 all patients with LRF received 3D CRT, whereas in RTOG-0522 they received IMRT. The mean dose of Cisplatin received in RTOG-0129 was 254.7 mg/m2 (SD 59.4) in the SFX arm and 187.1 mg/m2 (SD 32.1) in the AFX-C arm, which were designed to receive 3 and 2 doses, respectively. In RTOG-0522 the mean dose of Cisplatin was 192.3 mg/m2 (SD 31.8; dosing similar across arms). When considering a quality control measure, one of 10 in RTOG-0129 had unacceptable deviation in the target/dose volume review score while four of 20 in RTOG-0522 were unacceptable. Additionally, in RTOG-0522, 6 of the 16 cases that were considered per-protocol or acceptable variation had advanced tumor (T4) and nodal stage (N2c-N3).
Table 3.
Distribution of type of first disease progression by risk-group
| First progression event | Low-risk | Intermediate-risk | High-risk |
|---|---|---|---|
| RTOG-0129* | (n=123) | (n=73) | (n=64) |
| Locoregional | 10 (8.1%) | 14 (19.2%) | 21 (32.8%) |
| Distant (± locoregional) | 10 (8.1%) | 12 (16.4%) | 11 (17.2%) |
| Any | 20 (16.3%) | 26 (35.6%) | 32 (50.0%) |
| RTOG-0522Ω | (n=140) | (n=93) | (n=54) |
| Locoregional | 20 (14.3%) | 11 (11.8%) | 10 (18.5%) |
| Distant (± locoregional) | 9 (6.4%) | 18 (19.4%) | 11 (20.4%) |
| Any | 29 (20.7%) | 29 (31.2%) | 21 (38.9%) |
| Overall£ | (n=263) | (n=166) | (n=118) |
| Locoregional | 30 (11.4%) | 25 (15.1%) | 31 (26.3%) |
| Distant (± locoregional) | 19 (7.2%) | 30 (18.1%) | 22 (18.6%) |
| Any | 49 (18.6%) | 55 (33.1%) | 53 (44.9%) |
Among RTOG-10129 participants with recurrence (e.g. restricting analysis to those who have disease progression), there was no difference in distribution of locoregional vs. distant failures (±locoregional) by risk groups (p=0.48).
Among participants with recurrence in RTOG-0522 (e.g. restricting analysis to those who have disease progression), when considering distribution for type of first failure there was a non-significant increase in locoregional failure in the low-risk group as compared with the intermediate- and high- risk groups (p=0.05).
When considering the distribution of first disease progression among participants with recurrence in the overall study population (RTOG-0129 and RTOG-0522) by risk group there was no difference in distribution of locoregional or distant failures by risk groups (p=0.22).
In light of the lower than expected five-year survival for RTOG-0522 low-risk group, survival was evaluated for participants for a more conservatively defined low-risk group who would be eligible for treatment de-escalation in NRG-HN002 trial10 (p16-positive OPC, ≤10 pack-years and T1-2 with ipsilateral ≤6 centimeter nodes or T3 without contralateral or >6 centimeter nodes). Sixty-one and 65 patients in RTOG-0129 and RTOG-0522, respectively fit these criteria. The 2- and 5-year OS and 2- and 5-year PFS in RTOG-0129 was 95.1% and 86.7%, and 86.9% and 80.1%, respectively. The 2- and 5- year OS and 2- and 5-year PFS in RTOG-0522 was 93.8% and 93.8%, and 90.8% and 82.2%, respectively.
Risk groups in overall study population
For the overall study population combining RTOG-0129 and RTOG-0522, median follow-up time was 5.4 years (range 0.1-9.9). There were significant differences in OS and PFS across risk groups (p<0.001 for all comparisons). Five-year OS for low-, intermediate- and high-risk groups was 87.9% (95%CI 83.9-92.0), 66.4% (95%CI 59.0-73.7), and 38.7% (95%CI 29.4-48.0), respectively. Five-year PFS was 76.4% (95%CI 71.2-81.7), 53.6% (95%CI 45.9-61.4) and 32.5% (95%CI 23.9-41.1) for the low-, intermediate- and high-risk categories, respectively.
8th edition AJCC staging
The 8th edition AJCC staging system for HPV-positive OPC3 was evaluated in the overall study population (Figure 1G; Supplemental Table 4). While five-year OS differed across the three stages (ptrend<0.001), stages I and II were similar (85.1% vs. 86.5%, p=0.41), but stage II was significantly higher than stage III (86.5% vs. 67.6%, p<0.001). Similarly, five-year PFS differed across stages (ptrend=0.005), however survival curves for stages I and II were overlapping and statistically similar (71.5% vs. 73.3%, p=0.79; Figure 1H). PFS for stage II was significantly higher than stage III (73.3% vs. 58.7%, p=0.001).
Treatment toxicity by risk group
Given the interest in reducing toxicities for patients with expected good prognosis, differences in distributions of early and late toxicities were explored across risk groups in the overall study population. The distribution of early toxicities was similar across risk groups (p=0.14), with few notable exceptions. A significantly higher proportion of high-risk patients developed grade 3-5 hematologic abnormalities (including anemia and neutropenia) when compared to the low- and intermediate-risk patients (p=0.01 for each, Supplemental Table 5). In contrast, a significantly lower proportion of high-risk patients reported severe treatment-related symptoms including grade 3-4 dysphagia, nausea and mucositis (p<0.03 for each). Notably, there were no differences in late sequelae of treatment across risk groups (p>0.05 for each).
Discussion
This analysis shows that the prognostic risk groups defined in RTOG-0129 for OPC remain robust with longer follow-up and reproducible in RTOG-0522, an independent prospective cohort. In addition to validating the RTOG-0129 risk model for overall survival, this strategy of risk stratification appears to be applicable to PFS. While long-term toxicities of treatment are similar across risk groups, the low-risk group experienced significantly higher rates of specific acute treatment toxicities.
Examination of the risk groups with longer follow-up is important to confirm that their distinct trajectories remain at five years. To our knowledge, only one retrospective study of 120 Italian patients with high tobacco exposure treated non-uniformly has reproduced RTOG-0129 risk groups.11 Previously published risk group data from RTOG-0129 included 266 participants and 433 individuals contributed imputed data. Herein, the prognostic risk groups were confirmed without imputed data and externally validated using the independent large prospective randomized study cohort of RTOG-0522. In addition, the combined study populations of RTOG-0129 and RTOG-0522 provide a large cohort of OPC patients (n=547) treated in the U.S. with primary full dose radiation-based therapy and concomitant chemotherapy, and thereby offer robust estimates of 5-year survival for each risk group.
It is important to highlight the lower than expected 5-year estimates of PFS in the low-risk group of RTOG-0522 versus RTOG-0129 (72.9% vs. 80.3%). Although only 8% of the low-risk group in RTOG-0129 experienced locoregional failure, 14% had locoregional failure in RTOG-0522; yet distant metastases remained similar (8% vs. 6%). It is possible that the addition of Cetuximab, which is now established to be inferior to Cisplatin in two randomized prospective studies RTOG-1016 and DeEscalate,12,13 to an arm of RTOG-0522, accounted for the observed differences in LRF (Supplemental Table 3). Of the 20 patients in RTOG-0522 with LRF, 65% received Cetuximab. In RTOG-1016, the risk of locoregional failure was two-fold higher in the Cetuximab than the Cisplatin group, but risk of distant metastases was similar.12 It is possible that Cetuximab may be responsible for the increase in LRF in the present analysis. We also considered whether differing radiotherapy techniques across trials (mostly 3D-CRT in RTOG-0129 and IMRT exclusively in RTOG-0522) may have contributed to the increased LRFs (Supplemental Table 3). Based upon the review of clinical characteristics, the increased LRFs in RTOG-0522 may be due to a combination of unacceptable dose volume deviation of the targets and enrichment of patients with high tumor burden (T4N2c-N3 AJCC 7th edition). The adoption of IMRT may have also resulted in geographic misses, however, LRFs were only elevated for the low-risk, but not intermediate- or high-risk groups in RTOG-0522 relative to RTOG-0129, suggesting that this may not be the case. Nevertheless, the present analysis provides estimates of outcomes for each risk group in cohorts treated with full dose concomitant chemoradiotherapy regimens without de-intensification strategies. This permits us to consider the starting place for each risk group prior to modulating intensity of therapy. Consideration of whether the low-risk group as defined by RTOG-0129 is too broad to include in de-intensification trials may be warranted.
The RTOG-0129 low-risk group included p16-positive patients with low tobacco exposure regardless of tumor and nodal stage and a subset with >10 pack-years. However, it has become recognized that despite HPV-positivity patients with large volume disease (AJCC 7th edition T4 or >N2b) have worse outcomes than those with smaller primary tumors or less extensive nodal metastases.14 In addition, in a trial using induction chemotherapy and de-intensification radiotherapy p16-positive patients with >10 pack-years demonstrated poor survival.15 Based on these data, as well as the observed RTOG-0522 PFS, caution is indicated in selecting patients for treatment de-intensification and support a more stringent definition of low-risk than that defined by RTOG-0129. An alternative definition aligned with the NRG HN002 eligibility was explored; when applied to RTOG-0129 and RTOG-0522 data, 5-year OS was ~87% and 94%, respectively.
In order to de-escalate, one has to define an acceptable threshold of PFS and OS at a certain time point below which de-escalation would not be considered acceptable for most patients. For example, a potential approach is to identify a good risk group with a >90% 5-year OS. In addition, determining type and risk of failure may be important when considering therapeutic de-intensification. For example, if 80% 5-year PFS for low-risk patients is deemed acceptable, this may only be in the context of the majority of failures being loco-regional and salvageable and not if most are distant failures for which prognosis remains poor. Finally, a personalized de-intensification approach can be applied using risk estimates from a published nomogram16 which may be in line with contemporary patient-centered care. In summary, these data provide strong caution to drastic de-intensification and support “gentle” de-intensification strategies.
Staging systems stratify patients based upon prognosis. Since the 7th AJCC staging system did not successfully discriminate HPV-positive OPC,19 a novel system was created.14 However, its performance in prospective clinical trial cohort has not previously been examined. While OS was significantly different by 8th edition overall stages (ptrend<0.001), stages I and II were statistically similar (p=0.41). These observations may be a reflection of the eligibility criteria for the trials (restricted to AJCC 7th edition stage III-IV, age cut-off, exclusions based upon co-morbidities, performance status and selection bias), and uniform treatments. However other analyses have observed similar limitations in application of the new staging system.17,19–22
Prior analyses of RTOG-0129 have shown no difference in acute or late toxicities by HPV tumor status.23 In the current assessment, low-risk group patients were more symptomatic in the short-term, without long-term differences. This is consistent with smaller studies that have evaluated dysphagia and quality of life in TORS patients and a study of health-related quality of life measures.24–27 HPV-positive patients have a rapid decline from baseline, but largely resume their prior higher quality of life relative to HPV-negative patients.
It is important to acknowledge the limitations of this analysis. Both of these trials are chemoradiation platforms and therefore results may not be generalizable to primary surgical modalities. Although mature cohorts, these patients were treated in different “era”. Toxicity data were pooled from two trials with different treatments.
In conclusion, this study demonstrates the reproducibility and durability of survival estimates for RTOG-0129 risk groups, but suggests caution in patient selection for de-intensification and support gentle de-intensification strategies.
Supplementary Material
Acknowledgements:
Dr(s). Fakhry, Fortin, Lambert, Le, Raben, Rao, Ridge, Rosenthal, Spencer, Thorstad, Trotti, Weber, Wong, Yom and Jonathan Harris disclose having no conflicts of interest. Dr. Gillison discloses consulting unrelated to manuscript content with BMS, TRM, Genocea, EMD Serono, Merck, Inc., Amgen, AstraZeneca, Newlink, and Aspyrian. Dr. Nguyen-Tan discloses an advisory role with Bristol-Myers Squibb. Dr. Zhang discloses that his wife owns stock from Pfizer, Inc.
Funding: This project was supported by grants U10CA180868 (NRG Oncology Operations), U10CA180822 (NRG Oncology SDMC), UG1CA189867 (NCORP) from the National Cancer Institute (NCI) and Eli Lilly.
Disclosures: Jonathan Harris and Dr(s). Barrett, Fakhry, Lambert, Ridge, Spencer, Weber, Wong, disclose nothing. Dr. Fortin discloses a consulting or advisory role with Bristol-Myers Squibb. Dr. Gillison discloses a consulting or advisory role with Bristol-Myers Squibb, Amgen, Celgene, Merck & Co., Aspyrian Therapeutics, Inc., AstraZeneca, and EMD Serono, Inc. Dr. Le discloses research funding from Amgen, Varian Medical Systems, and RedHill Biopharma, Ltd. and travel, accommodations or expenses from Bristol-Myers Squibb for a consultant role. Dr. Nguyen-Tan discloses a consulting or advisory role with Bristol-Myers Squibb. Dr. Raben discloses honoraria from AstraZeneca, Merck & Co., Genentech, Nanobiotix, and Bioline, and a consulting or advisory role from AstraZeneca, Genentech, Merck & Co., and Nanobiotix. Dr. Rao discloses travel, accommodations, or expenses from Varian Medical Systems. Dr. Rosenthal discloses stock or other ownership with Concordia International and honoraria, a consulting or advisory role, and research funding from Merck & Co. Dr. Thorstad discloses employment with Elekta. Dr. Trotti discloses his institution received research funding per case reimbursement for enrollment. Dr. Yom discloses research funding from Genentech, Merck & Co., and Bristol-Myers Squibb. Dr. Zhang discloses stock or other ownership with Pfizer.
References
- 1.Ang KK, Harris J, Wheeler R, et al. Human papillomavirus and survival of patients with oropharyngeal cancer. N Engl J Med. 2010;363(1):24–35. doi: 10.1056/NEJMoa0912217 [DOI] [PMC free article] [PubMed] [Google Scholar]
- 2.Fakhry C, Westra WH, Li S, et al. Improved survival of patients with human papillomavirus-positive head and neck squamous cell carcinoma in a prospective clinical trial. J Natl Cancer Inst. 2008;100(4):261–269. doi: 10.1093/jnci/djn011 [DOI] [PubMed] [Google Scholar]
- 3.Lydiatt WM, Patel SG, O’Sullivan B, et al. Head and Neck cancers—major changes in the American Joint Committee on cancer eighth edition cancer staging manual. CA Cancer J Clin. 2017;67(2):122–137. doi: 10.3322/caac.21389 [DOI] [PubMed] [Google Scholar]
- 4.Ang KK, Zhang Q, Rosenthal DI, et al. Randomized phase III trial of concurrent accelerated radiation plus cisplatin with or without cetuximab for stage III to IV head and neck carcinoma: RTOG 0522. J Clin Oncol Off J Am Soc Clin Oncol. 2014;32(27):2940–2950. doi: 10.1200/JCO.2013.53.5633 [DOI] [PMC free article] [PubMed] [Google Scholar]
- 5.Fleming ID. AJCC Cancer Staging Manual. Fifth Edition Philadelphia: Lippincott-Raven; 1997. https://cancerstaging.org/references-tools/deskreferences/Documents/AJCC5thEdCancerStagingManual.pdf. [Google Scholar]
- 6.Trotti A, Byhardt R, Stetz J, et al. Common toxicity criteria: version 2.0. an improved reference for grading the acute effects of cancer treatment: impact on radiotherapy. Int J Radiat Oncol Biol Phys. 2000;47(1):13–47. [DOI] [PubMed] [Google Scholar]
- 7.Cox JD, Stetz J, Pajak TF. Toxicity criteria of the Radiation Therapy Oncology Group (RTOG) and the European organization for research and treatment of cancer (EORTC). Int J Radiat Oncol. 1995;31(5):1341–1346. doi: 10.1016/0360-3016(95)00060-C [DOI] [PubMed] [Google Scholar]
- 8.Trotti A, Colevas AD, Setser A, et al. CTCAE v3.0: development of a comprehensive grading system for the adverse effects of cancer treatment. Semin Radiat Oncol. 2003;13(3):176–181. doi: 10.1016/S1053-4296(03)00031-6 [DOI] [PubMed] [Google Scholar]
- 9.Kaplan EL, Meier P. Nonparametric Estimation from Incomplete Observations. J Am Stat Assoc. 1958;53(282):457–481. doi: 10.2307/2281868 [DOI] [Google Scholar]
- 10.Reduced-Dose Intensity-Modulated Radiation Therapy With or Without Cisplatin in Treating Patients With Advanced Oropharyngeal Cancer - Full Text View - ClinicalTrials.gov. https://clinicaltrials.gov/ct2/show/NCT02254278 Accessed July 17, 2018.
- 11.Granata R, Miceli R, Orlandi E, et al. Tumor stage, human papillomavirus and smoking status affect the survival of patients with oropharyngeal cancer: an Italian validation study. Ann Oncol. 2012;23(7):1832–1837. doi: 10.1093/annonc/mdr544 [DOI] [PubMed] [Google Scholar]
- 12.Gillison ML, Trotti AM, Harris J, et al. Radiotherapy plus cetuximab or cisplatin in human papillomavirus-positive oropharyngeal cancer (NRG Oncology RTOG 1016): a randomised, multicentre, non-inferiority trial. Lancet Lond Engl. November 2018. doi: 10.1016/S0140-6736(18)32779-X [DOI] [PMC free article] [PubMed] [Google Scholar]
- 13.Mehanna H, Robinson M, Hartley A, et al. Radiotherapy plus cisplatin or cetuximab in low-risk human papillomavirus-positive oropharyngeal cancer (De-ESCALaTE HPV): an open-label randomised controlled phase 3 trial. Lancet Lond Engl. November 2018. doi: 10.1016/S0140-6736(18)32752-1 [DOI] [PMC free article] [PubMed] [Google Scholar]
- 14.O’Sullivan B, Huang SH, Su J, et al. Development and validation of a staging system for HPV-related oropharyngeal cancer by the International Collaboration on Oropharyngeal cancer Network for Staging (ICON-S): a multicentre cohort study. Lancet Oncol. 2016;17(4):440–451. doi: 10.1016/S1470-2045(15)00560-4 [DOI] [PubMed] [Google Scholar]
- 15.Marur S, Li S, Cmelak AJ, et al. E1308: Phase II Trial of Induction Chemotherapy Followed by Reduced-Dose Radiation and Weekly Cetuximab in Patients With HPV-Associated Resectable Squamous Cell Carcinoma of the Oropharynx— ECOG-ACRIN Cancer Research Group. J Clin Oncol. 2016;35(5):490–497. doi: 10.1200/JCO.2016.68.3300 [DOI] [PMC free article] [PubMed] [Google Scholar]
- 16.Fakhry C, Zhang Q, Nguyen-Tân PF, et al. Development and Validation of Nomograms Predictive of Overall and Progression-Free Survival in Patients With Oropharyngeal Cancer. J Clin Oncol Off J Am Soc Clin Oncol. August 2017:JCO2016720748. doi: 10.1200/JCO.2016.72.0748 [DOI] [PMC free article] [PubMed] [Google Scholar]
- 17.Malm I-J, Fan CJ, Yin LX, et al. Evaluation of proposed staging systems for human papillomavirus-related oropharyngeal squamous cell carcinoma. Cancer. 2017;123(10):1768–1777. doi: 10.1002/cncr.30512 [DOI] [PubMed] [Google Scholar]
- 18.Husain ZA, Chen T, Corso CD, et al. A Comparison of Prognostic Ability of Staging Systems for Human Papillomavirus-Related Oropharyngeal Squamous Cell Carcinoma. JAMA Oncol. 2017;3(3):358–365. doi: 10.1001/jamaoncol.2016.4581 [DOI] [PubMed] [Google Scholar]
- 19.Porceddu SV, Milne R, Brown E, et al. Validation of the ICON-S staging for HPV-associated oropharyngeal carcinoma using a pre-defined treatment policy. Oral Oncol. 2017;66:81–86. doi: 10.1016/j.oraloncology.2017.01.002 [DOI] [PubMed] [Google Scholar]
- 20.Fakhry C, Zevallos JP, Eisele DW. Imbalance Between Clinical and Pathologic Staging in the Updated American Joint Commission on Cancer Staging System for Human Papillomavirus–Positive Oropharyngeal Cancer. J Clin Oncol. 2017;36(3):217–219. doi: 10.1200/JCO.2017.75.2063 [DOI] [PubMed] [Google Scholar]
- 21.Zhan KY, Eskander A, Kang SY, et al. Appraisal of the AJCC 8th edition pathologic staging modifications for HPV–positive oropharyngeal cancer, a study of the National Cancer Data Base. Oral Oncol. 2017;73:152–159. doi: 10.1016/j.oraloncology.2017.08.020 [DOI] [PubMed] [Google Scholar]
- 22.Mizumachi T, Homma A, Sakashita T, Kano S, Hatakeyama H, Fukuda S. Confirmation of the eighth edition of the AJCC/UICC TNM staging system for HPV-mediated oropharyngeal cancer in Japan. Int J Clin Oncol. March 2017:1–8. doi: 10.1007/s10147-017-1107-0 [DOI] [PubMed] [Google Scholar]
- 23.Nguyen-Tan PF, Zhang Q, Ang KK, et al. Randomized Phase III Trial to Test Accelerated Versus Standard Fractionation in Combination With Concurrent Cisplatin for Head and Neck Carcinomas in the Radiation Therapy Oncology Group 0129 Trial: Long-Term Report of Efficacy and Toxicity. J Clin Oncol. 2014;32(34):3858–3867. doi: 10.1200/JCO.2014.55.3925 [DOI] [PMC free article] [PubMed] [Google Scholar]
- 24.Choby GW, Kim J, Ling DC, et al. Transoral robotic surgery alone for oropharyngeal cancer: quality-of-life outcomes. JAMA Otolaryngol-- Head Neck Surg. 2015;141(6):499–504. doi: 10.1001/jamaoto.2015.0347 [DOI] [PubMed] [Google Scholar]
- 25.Dziegielewski PT, Teknos TN, Durmus K, et al. Transoral robotic surgery for oropharyngeal cancer: long-term quality of life and functional outcomes. JAMA Otolaryngol-- Head Neck Surg. 2013;139(11):1099–1108. doi: 10.1001/jamaoto.2013.2747 [DOI] [PMC free article] [PubMed] [Google Scholar]
- 26.Sinclair CF, McColloch NL, Carroll WR, Rosenthal EL, Desmond RA, Magnuson JS. Patient-perceived and objective functional outcomes following transoral robotic surgery for early oropharyngeal carcinoma. Arch Otolaryngol Head Neck Surg. 2011;137(11):1112–1116. doi: 10.1001/archoto.2011.172 [DOI] [PubMed] [Google Scholar]
- 27.Rettig EM, D’Souza G, Thompson CB, Koch WM, Eisele DW, Fakhry C. Health-related quality of life before and after head and neck squamous cell carcinoma: Analysis of the Surveillance, Epidemiology, and End Results-Medicare Health Outcomes Survey linkage. Cancer. 2016;122(12):1861–1870. doi: 10.1002/cncr.30005 [DOI] [PMC free article] [PubMed] [Google Scholar]
Associated Data
This section collects any data citations, data availability statements, or supplementary materials included in this article.


