

Abstract
Aims
A post‐hoc analysis to assess the impact in people with type 2 diabetes, of increasing doses of basal insulin on glycaemic measures, body weight and hypoglycaemia.
Research Design and Methods
We included data from prospective, randomized controlled treat‐to‐target trials of ≥24 weeks' duration in people with type 2 diabetes, uncontrolled on metformin and sulphonylureas, and treated with insulin glargine 100 units/mL (U100), who had at least six fasting plasma glucose (FPG) measurements. The impact of insulin dose on glycated haemoglobin (HbA1c) values, FPG, hypoglycaemia incidence (<3.9 mmol/L [70 mg/dL]), and body weight was analysed. A total of 458 participants from three eligible trials were included.
Results
The observed relationship between higher basal insulin doses and glycaemic control was non‐linear, with increasing insulin dose leading to smaller reductions in FPG and HbA1c for doses >0.3 IU/kg/d, with a plateauing effect at 0.5 IU/kg/d. Total daily dose of insulin >0.5 IU/kg/d resulted in greater weight gain, but without higher rates of hypoglycaemia, compared with insulin doses ≤0.5 IU/kg/d.
Conclusions
This analysis indicates that basal insulin doses >0.5 IU/kg/d have diminishing additional impact on improving glycaemic measures, with the disadvantage of additional weight gain. Clinicians should consider anti‐hyperglycaemic treatment intensification at doses approaching 0.5 IU/kg/d.
Keywords: basal insulin, glargine, HbA1c, postprandial, type 2 diabetes
1. INTRODUCTION
It has been estimated that more than 30 million people in the United States, ~9.4% of the total US population, are living with diabetes.1 Of these, the majority has type 2 diabetes.1 Given the progressive loss of β‐cell function in type 2 diabetes, most patients will eventually require insulin therapy to achieve and maintain glycaemic targets.2 The introduction of basal insulin analogues more than a decade ago has made it easier for primary care physicians to engage in the treatment of insulin‐requiring patients and to intensify insulin therapy, with lower rates of hypoglycaemia achieved compared with non‐modified human insulins.3 This is critically important because ~90% of type 2 diabetes care is carried out in the primary care setting.4, 5 Treat‐to‐target titration trials have helped define the initiation and titration of basal insulin analogues contingent on achieving fasting plasma glucose (FPG) targets.5, 6, 7, 8, 9 However, although basal insulin provides a steady level of insulin throughout the day and helps to control FPG levels by lowering baseline plasma glucose, it has no direct effect on postprandial plasma glucose (PPG).10, 11 As diabetes progresses, β‐cell function diminishes, resulting in greater PPG excursions and high levels of glycated haemoglobin (HbA1c).12, 13 Increasing basal insulin doses in such patients has limited effect on PPG, and higher doses may result in "over‐basalization,"12 which has been reported to increase the risk of hypoglycaemia and weight gain.12, 13 At this point, treatment intensification is required.
The American Diabetes Association (ADA) and American Association of Clinical Endocrinologists (AACE)/American College of Endocrinology (ACE) 2018 treatment guidelines recommend the use of prandial insulin or addition of a glucagon‐like peptide 1 receptor agonist (GLP‐1RA) to cover PPG excursions when HbA1c remains above target despite basal insulin doses of 0.5 IU/kg/d.2, 14 Recent updates to treatment guidelines also support the addition of dipeptidyl peptidase‐4 (DPP‐4) inhibitors or sodium‐glucose co‐transporter‐2 (SGLT2) inhibitors in patients with existing cardiovascular disease, or in whom weight loss is desirable, and glycaemic targets are not being achieved.15, 16 The 0.5‐IU/kg/d basal insulin threshold dose cited in the ADA and AACE/ACE 2018 guidelines appears to be mainly based on expert opinion rather than analysis of clinical data; no prospective clinical studies to date have evaluated the maximum insulin dose that should be used before intensifying beyond basal insulin treatment. Therefore, better understanding of the upper limit for basal insulin dose is of great clinical importance. Early intensive glucose control is essential to prevent long‐term micro‐ and macrovascular complications of type 2 diabetes,17 but many people with type 2 diabetes do not achieve their HbA1c targets on basal insulin.18 Moreover, a significant proportion of people with diabetes are concerned about the risks of hypoglycaemia and potential weight gain associated with higher basal insulin doses.19, 20 There is an unmet need for better appreciation of the balance between improved glycaemic control and the potential risks of a higher basal insulin dose as well as the dose at which intensification beyond basal insulin is required. Such knowledge would help primary care physicians to overcome the clinical inertia associated with intensification of insulin therapy and should improve long‐term clinical outcomes in type 2 diabetes. The present post hoc analysis of pooled data from randomized controlled treat‐to‐target clinical trials was therefore conducted to assess whether there is a basal insulin clinical response curve for glycaemic control and to investigate the effect of increasing basal insulin dose on the incidence of hypoglycaemia and weight gain in people with type 2 diabetes. The findings of our analysis are of key importance for primary care physicians to inform treatment intensification strategies for people with type 2 diabetes.
2. RESEARCH DESIGN AND METHODS
2.1. Study selection population
Data from participants in eligible studies were included in the analysis. Studies were eligible if they were at least 24 weeks in length and were prospective, randomized controlled treat‐to‐target trials, with protocol titration algorithms targeting an FPG <5.6 mmol/L (100 mg/dL) (Figure S1, Supporting Information). For inclusion in the present analysis, participants were required to have type 2 diabetes inadequately controlled on insulin glargine U100 in combination with metformin and a sulphonylurea and to have had at least six measurements of FPG taken during the study.
2.2. Outcomes
The HbA1c values, FPG level, and insulin dose values by 0.1‐IU/kg/d increases were assessed for each of the participants in the identified eligible studies at baseline and study endpoint; glycaemic data and incidence of hypoglycaemia (plasma glucose threshold: <3.9 mmol/L [70 mg/dL] are presented for patients categorized by insulin dose at the study endpoint. Change in body weight during the course of the study was analysed from baseline, and end‐of‐study data for participants were grouped by daily final basal insulin doses (≤0.5 or >0.5 IU/kg/d).
2.3. Statistical analysis
Participant demographics, baseline characteristics and clinical outcomes were summarized descriptively. The changes in FPG and HbA1c from baseline to study endpoint were calculated across all insulin doses, and additionally for each incremental 0.1‐IU/kg/d dose increase, from ≤0.3 to 0.7 IU/kg/d. Assessment of the number of participants reaching HbA1c <7.0% at study endpoint was limited to participants with a baseline HbA1c ≥53 mmol/mol (7.0%). Overall incidence of hypoglycaemia was assessed for the entire study period, also categorized by final insulin dose. Rates of daytime, nocturnal and severe hypoglycaemia have been previously assessed for this study population and are presented elsewhere.21 An evaluation of change in body weight was made, categorized for the participants who exceeded a maximum insulin dose of 0.5 IU/kg/d and for those whose maximum dose was ≤0.5 IU/kg/d during the 24‐week treatment period. Within the >0.5 IU/kg/d group, body weight change was also separately assessed for the time periods when participants received an insulin dose ≤0.5 and >0.5 IU/kg/d.
3. RESULTS
3.1. Participant demographics and clinical characteristics
A total of 63 trials of insulin glargine U100 performed between 1997 and 2007 were assessed for inclusion (Figure S1, Supporting Information). Three studies met the inclusion criteria,6, 22, 23 and data from these were pooled (Table S1, Supporting Information). A total of 458 participants who had FPG data available at both baseline and endpoint were included in the final analysis. Baseline characteristics are shown in Table 1.
Table 1.
Baseline demographics and clinical characteristics (N = 458)
| Characteristic | |
|---|---|
| Age, years | 55.5 (9.6) |
| Women, n (%) | 229 (50.0) |
| Duration of type 2 diabetes, years | 9.1 (6.0) |
| HbA1c, mmol/mol | 72.0 (10.9) |
| FPG, mmol/L | 11.1 (3.1) |
| Body weight, kg | 95.3 (18.4) |
| BMI, kg/m2 | 33.2 (5.4) |
| Starting insulin dose, IU/d | 10.0 (0.94) |
Abbreviations: BMI, body mass index; FPG, fasting plasma glucose; HbA1C, glycated haemoglobin.
Values are mean (SD) unless otherwise stated.
3.2. Changes in FPG with increasing insulin dose
The mean daily insulin starting dose at baseline was 10.0 IU/d and increased to 0.45 IU/kg/d by week 24 of intervention using standard treat‐to‐target titration. At baseline, the mean (SD) FPG level across all participants was 11.0 (3.1) mmol/L (200 [56] mg/dL). FPG declined to 6.8 (2.2) mmol/L (122 [39] mg/dL) at week 24, giving a mean reduction from baseline of 4.3 mmol/L (78 mg/dL) across all insulin doses. Figure 1 shows the basal insulin dose effect on the reduction in FPG at the end of the study period per 0.1‐IU/kg/d increase. The greatest reduction (~0.68 mmol/L per 0.1 IU/kg/d increase in insulin dose) in FPG was seen with insulin doses ≤0.3 IU/kg/d. Higher insulin doses were associated with incrementally smaller reductions in FPG, plateauing at ~0.26 mmol/L per each 0.1‐IU/kg dose increase at doses >0.5 IU/kg/d; therefore, while there was an overall cumulative effect of lowering FPG with increasing insulin dose, the decrease in the rate of FPG reduction at higher doses had incrementally diminishing impact at dose increases to between 0.3 IU/kg/d and 0.5 IU/kg/d, with little effect of insulin doses >0.5 IU/kg/d.
Figure 1.

Effect of 0.1‐IU/kg/d increases in daily insulin dose on the change in fasting plasma glucose (FPG)
3.3. Changes in HbA1c with increasing insulin dose
The mean (SD) HbA1c value at week 0 (baseline) was 72 mmol/mol (10.9); at week 12, the mean (SD) change from baseline was −16.4 mmol/mol (8.7), and at week 24, this was −18.6 mmol/mol (9.8); the mean HbA1c was 53 mmol/mol (8.7) at 24 weeks. Overall, 49.5% of participants achieved an HbA1c of <53 mmol/mol at week 24. Similar to the effect on FPG, reductions in HbA1c were greatest for the lowest insulin doses and incrementally smaller with increasing insulin doses (Figure 2). As shown in Figure 2, the impact on the cumulative reduction in HbA1c was highest below a dose of 0.3 IU/kg/d (12.0 mmol/mol reduction for each 0.1‐IU/kg/d increase). This impact decreased to 3.3 mmol/mol to 5.5 mmol/mol for each additional 0.1‐IU/kg/d increase in basal insulin dose between 0.3 and 0.5 IU/kg/d. For doses >0.5 IU/kg/d, there was a significantly reduced effect on HbA1c, plateauing at ~3.3% for each 0.1‐IU/kg/d increase.
Figure 2.
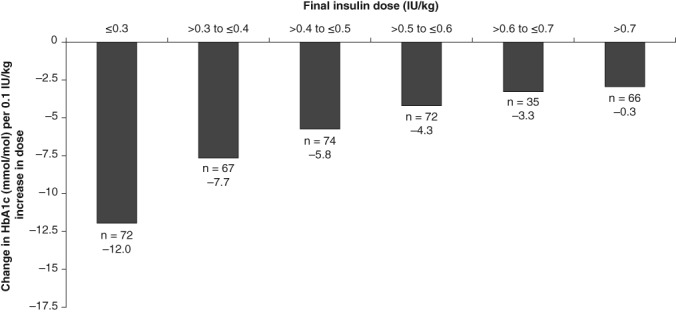
Effect of 0.1‐IU/kg/d increases in insulin dose on the change in glycated haemoglobin (HbA1c)
3.4. Effects on hypoglycaemia and weight change
The incidence of hypoglycaemia was broadly similar across insulin doses, ranging from ~55% to 75% of participants, with no significant differences between insulin doses ≤0.5 IU/kg/d compared with >0.5 IU/kg/d (Figure 3A). When analysed by insulin dose, a mean weight increase of 1.4 kg was seen for participants with final insulin dose >0.5 IU/kg/d up to the point where they were taking 0.5 IU/kg/d, but an additional weight increase of 1.8 kg was seen in these participants when their dose was increased above 0.5 IU/kg/d (Figure 3B).
Figure 3.

A, Percentage of partcipants reporting hypoglycaemia (<3.9 mmol/L [70 mg/dL]) for each 0.1‐IU/kg/d dose increment. B, Weight change from baseline to study end by daily basal insulin dose (maximal dose/kg/day). †For those patients with maximal dose of >0.5 IU/kg/d (right‐hand bar), the graph is stratified by weight increase from baseline to when the dose reached 0.5 IU/kg/d (dark bar), and then the increase from >0.5 IU/kg/d to study end (light bar)
4. DISCUSSION
The present post hoc analysis of pooled data from three basal insulin (insulin glargine) randomized treat‐to‐target studies of ≥24 weeks' duration conducted in adults with type 2 diabetes reveals proportionately smaller reductions in FPG and HbA1c with increasing doses of basal insulin. We observed a linear and greater glycaemic effect at doses ≤0.3 IU/kg/d, followed by a non‐linear diminishing response with doses between 0.3 IU/kg/d and 0.5 IU/kg/d, with a plateauing effect at doses >0.5 IU/kg/d. Higher insulin doses were associated with increasing weight gain; however, we observed no significant differences in the frequency of hypoglycaemia between lower (≤0.5 IU/kg/d) and higher (>0.5 IU/kg/d) basal insulin doses. These data are important for selecting optimal dosing of basal insulin to optimize efficacy, minimize side effects, and decrease therapeutic inertia by informing the decisions on when to intensify therapy beyond basal insulin.
Previous studies have also shown that insulin doses >0.5 IU/kg/d do not improve glycaemic control and may be associated with both an increased risk of hypoglycaemia and greater weight gain.24, 25, 26 In a pooled study of patient‐level data from 15 randomized, treat‐to‐target trials in insulin‐naive participants with type 2 diabetes treated with insulin glargine ± oral antidiabetes drugs for ≥24 weeks, data were stratified according to whether participants exceeded daily insulin dose thresholds >0.5, >0.7 and >1.0 IU/kg.24 At week 24, participants with insulin titrated beyond the three thresholds had significantly higher mean HbA1c and FPG levels compared with participants at or below each threshold, with smaller changes in HbA1c from baseline. In addition, participants who exceeded the thresholds also had greater weight gain and a higher likelihood of hypoglycaemia once the threshold was exceeded.24 Both higher initial doses and increasing dose have been shown to be associated with weight gain.25, 26 In the CREDIT (Cardiovascular Risk Evaluation in people with type 2 Diabetes on Insulin Therapy) trial, 1 year after initiating insulin therapy, mean weight gain was 1.78 kg.25 Participants who gained the most weight had higher insulin doses; after adjusting for other factors, an insulin dose of 0.6 IU/kg/d compared with 0.4 IU/kg/d at 1 year was associated with a 0.5‐kg higher weight gain.25 Consistent with these studies, we observed that increasing basal insulin doses >0.5 IU/kg/d had incrementally less effect on blood glucose reduction, but they led to a greater increase in weight. In the present study, however, there was a similar overall incidence of hypoglycaemia across insulin doses, contrary to that reported in previous studies. The reason for this is unclear, but it may relate to the titration regimen, whereby participants who experienced hypoglycaemia did not receive an increase in insulin dose.
Our data support the ADA and AACE clinical recommendations to consider treatment intensification with additional medications when insulin is titrated above a defined dose. Currently, the recommendations suggest intensification of therapy when the dose exceeds 0.5 IU/kg/d and HbA1c remains above target. The data in the present study support a change in this recommendation to consider intensification before the basal insulin dose exceeds 0.5 IU/kg/d and HbA1c remains above target.2, 14 An insulin dose of >0.4 IU/kg/d should be a signal to clinicians to start considering antidiabetic agents that better address PPG excursions, including prandial insulin, or oral or injectable incretin therapies, so that treatment intensification can be initiated before basal insulin doses exceed 0.5 IU/kg/d.2, 18
The limitations of the present study primarily relate to the fact that it is a post hoc analysis of pooled data from three studies not specifically designed to determine if there is a diminishing response to increasing basal insulin dose. Furthermore, specifying that participants required a background therapy of metformin and a sulphonylurea limited the number studies that could be included in the analysis. Participant numbers and cohorts were small and the frequency of laboratory assessment time points was limited in some cases, particularly for subgroup analyses, and dictated by trial protocols designed with different objectives. In addition, the total basal insulin dose included in this analysis was not adjusted for the presence of comorbidities or degree of insulin sensitivity in study participants. Finally, as only participants taking insulin glargine U100 were eligible to be included in the analysis, this limits extrapolation to other basal insulins such as the newer second‐generation insulins, although these newer insulins have yet to be proven to be more efficacious than insulin glargine U100.
In summary, the present study indicates a non‐linear clinical response curve for basal insulin, with diminishing glycaemic efficacy for doses of insulin >0.3 to 0.5 IU/kg/d and a plateauing glycaemic effect with doses >0.5 IU/kg/d. The present results suggest consideration of a revision to clinical practice recommendations to start antihyperglycaemic therapy intensification with additional agents to cover PPG excursions when HbA1c remains above target and the insulin dose begins to approach 0.5 IU/kg/d.
This manuscript is one of last publications that Charles Shaefer, MD participated in prior to his passing, please see Appendix S1 for an In Memoriam.
CONFLICTS OF INTEREST
G.E.U. is supported by Public Health Service Grant UL1 RR025008 from the Clinical and Translational Science Award program and 1P30DK111024‐01 from the National Institutes of Health and National Center for Research Resources, is partly supported by research grants from the Public Health Service (grants UL1 TR002378 from the Clinical and Translational Science Award program and 1P30DK111024‐01 from the National Institutes of Health and National Center for Research Resources), has received unrestricted research support for inpatient studies (to Emory University) from Sanofi, Merck, Novo Nordisk, AstraZeneca and Boehringer Ingelheim, and has received honoraria for advisory board/consultant roles for Sanofi and Intarcia Pharmaceuticals. N.S. is a member of the advisory panel of and author for AstraZeneca, Boehringer Ingelheim, Intarsia, Janssen Pharmaceuticals, Lilly, Novartis, Sanofi US and Teva, is a member of the advisory panel and speaker's bureau of and author for AstraZeneca and Boehringer Ingelheim, and has received research support from AstraZeneca, Boehringer Ingelheim and Sanofi. T.D. is an employee and stock/shareholder of Sanofi US. L.T. is an employee and stock/shareholder of Sanofi US. J.C. is an employee of Xinyi, Inc., under contract with Sanofi US.
Author contributions
G.E.U., N.S., T.D., L.T., J.C. and C.S. participated in the preparation of the manuscript, data review, and presentation. G.E.U. had full access to all the data in the study and takes responsibility for the integrity of the data and the accuracy of the data analysis.
Supporting information
Figure S1. Flow diagram showing study selection for patient pool.
Table S1. Study designs of included studies.
Appendix S1. In Memoriam: Charles F. Shaefer, MD (1949‐2016).
ACKNOWLEDGMENTS
This study was funded by Sanofi US, Inc. The authors received writing/editorial support in the preparation of this manuscript, provided by Keisha Peters, MSc of Excerpta Medica funded by Sanofi US, Inc.
Umpierrez GE, Skolnik N, Dex T, Traylor L, Chao J, Shaefer C. When basal insulin is not enough: A dose–response relationship between insulin glargine 100 units/mL and glycaemic control. Diabetes Obes Metab. 2019;21:1305–1310. 10.1111/dom.13653
Funding information This study was funded by Sanofi US, Inc.
REFERENCES
- 1. CDC . National Diabetes Statistics Report, 2017. Available at https://www.cdc.gov/diabetes/pdfs/data/statistics/national-diabetes-statistics-report.pdf. Accessed September 3, 2018.
- 2. ADA . Pharmacologic approaches to glycemic treatment.Diabetes Care. 2018;41(suppl 1):S73‐S85. [DOI] [PubMed] [Google Scholar]
- 3. Hedrington MS, Pulliam L, Davis SN. Basal insulin treatment in type 2 diabetes.Diabetes Technol Ther. 2011;13(suppl 1):S33‐S42. [DOI] [PMC free article] [PubMed] [Google Scholar]
- 4. Davidson JA. The increasing role of primary care physicians in caring for patients with type 2 diabetes mellitus.Mayo Clin Proc. 2010;85(suppl 12):S3‐S4. [DOI] [PMC free article] [PubMed] [Google Scholar]
- 5. Arnolds S, Heise T, Flacke F, Sieber J. Common standards of basal insulin titration in type 2 diabetes.J Diabetes Sci Technol. 2013;7:771‐788. [DOI] [PMC free article] [PubMed] [Google Scholar]
- 6. Riddle MC, Rosenstock J, Gerich J, Insulin Glargine 4002 Study Investigators . The treat‐to‐target trial: randomized addition of glargine or human NPH insulin to oral therapy of type 2 diabetic patients.Diabetes Care. 2003;26:3080‐3086. [DOI] [PubMed] [Google Scholar]
- 7. Davies M, Storms F, Shutler S, Bianchi‐Biscay M, Gomis R, ATLANTUS Study Group . Improvement of glycemic control in subjects with poorly controlled type 2 diabetes: comparison of two treatment algorithms using insulin glargine.Diabetes Care. 2005;28:1282‐1288. [DOI] [PubMed] [Google Scholar]
- 8. Kennedy L, Herman WH, Strange P, Harris A, GOAL AIC Team . Impact of active versus usual algorithmic titration of basal insulin and point‐of‐care versus laboratory measurement of HbA1C on glycemic control in patients with type 2 diabetes: the Glycemic Optimization with Algorithms and Labs at Point of Care (GOAL A1C) trial.Diabetes Care. 2006;29:1‐8. [DOI] [PubMed] [Google Scholar]
- 9. Strange P. Treat‐to‐target insulin titration algorithms when initiating long or intermediate acting insulin in type 2 diabetes.J Diabetes Sci Technol. 2007;1:540‐548. [DOI] [PMC free article] [PubMed] [Google Scholar]
- 10. Monnier L, Lapinski H, Colette C. Contributions of fasting and postprandial plasma glucose increments to the overall diurnal hyperglycemia of type 2 diabetic patients: variations with increasing levels of HbA(1c).Diabetes Care. 2003;26:881‐885. [DOI] [PubMed] [Google Scholar]
- 11. Monnier L, Colette C. Contributions of fasting and postprandial glucose to hemoglobin A1C.Endocr Pract. 2006;12(suppl 1):42‐46. [DOI] [PubMed] [Google Scholar]
- 12. LaSalle JR, Berria R. Insulin therapy in type 2 diabetes mellitus: a practical approach for primary care physicians and other health care professionals.J Am Osteopath Assoc. 2013;113:152‐162. [PubMed] [Google Scholar]
- 13. Riddle MC. Basal glucose can be controlled, but the prandial problem persists‐it's the next target! Diabetes Care. 2017;40:291‐300. [DOI] [PMC free article] [PubMed] [Google Scholar]
- 14. Garber AJ, Abrahamson MJ, Barzilay JI, et al. Consensus statement by the American Association of Clinical Endocrinologists and American College of Endocrinology on the comprehensive type 2 diabetes management algorithm – 2018 executive summary.Endocr Pract. 2018;24:91‐120. [DOI] [PubMed] [Google Scholar]
- 15. Davies MJ, D'Alessio DA, Fradkin J, et al. Management of Hyperglycemia in Type 2 Diabetes, 2018. A Consensus Report by the American Diabetes Association (ADA) and the European Association for the Study of Diabetes (EASD).Diabetes Care. 2018;41(12):2669‐2701. [DOI] [PMC free article] [PubMed] [Google Scholar]
- 16. Diabetes Canada Clinical Practice Guidelines Expert Committee . Diabetes Canada 2018 Clinical Practice Guidelines for the Prevention and Management of Diabetes in Canada.Can J Diabetes. 2018;42(suppl 1):S1‐S325. [DOI] [PubMed] [Google Scholar]
- 17. Holman RR, Paul SK, Bethel MA, Matthews DR, Neil HAW. 10‐year follow‐up of intensive glucose control in Type 2 diabetes.N Engl J Med. 2008;359:1577‐1589. [DOI] [PubMed] [Google Scholar]
- 18. Mocarski M, Yeaw J, Divino V, et al. Slow titration and delayed intensification of basal insulin among patients with type 2 diabetes.J Manag Care Spec Pharm. 2018;24:390‐400. [DOI] [PMC free article] [PubMed] [Google Scholar]
- 19. Brunton S, Gough S, Hicks D, et al. A look into the future: improving diabetes care by 2015.Curr Med Res Opin. 2011;27(suppl 3):65‐72. [DOI] [PubMed] [Google Scholar]
- 20. Peyrot M, Rubin RR, Kruger DF, Travis LB. Correlates of insulin omission.Diabetes Care. 2010;33:240‐245. [DOI] [PMC free article] [PubMed] [Google Scholar]
- 21. Shaefer C, Traylor L, Gao L, Dex T, Sepe P, Skolnik N. Exploratory study of a dose‐response curve for basal insulin. Presented at ADA 2015, June 5–9, 2015; Boston, MA.
- 22. Rosenstock J, Sugimoto D, Strange P, Stewart JA, Soltes‐Rak E, Dailey G. Triple therapy in type 2 diabetes: insulin glargine or rosiglitazone added to combination therapy of sulfonylurea plus metformin in insulin‐naive patients.Diabetes Care. 2006;29:554‐559. [DOI] [PubMed] [Google Scholar]
- 23.HOE901_4021 [data on file]. Clinicaltrials.gov identifier: NCT01336751.
- 24. Reid T, Gao L, Gill J, et al. How much is too much? Outcomes in patients using high‐dose insulin glargine.Int J Clin Pract. 2016;70:56‐65. [DOI] [PMC free article] [PubMed] [Google Scholar]
- 25. Balkau B, Home PD, Vincent M, Marre M, Freemantle N. Factors associated with weight gain in people with type 2 diabetes starting on insulin.Diabetes Care. 2014;37:2108‐2113. [DOI] [PubMed] [Google Scholar]
- 26. Jansen HJ, Vervoort GM, de Haan AF, Netten PM, de Grauw WJ, Tack CJ. Diabetes‐related distress, insulin dose, and age contribute to insulin‐associated weight gain in patients with type 2 diabetes: results of a prospective study.Diabetes Care. 2014;37:2710‐2717. [DOI] [PubMed] [Google Scholar]
Associated Data
This section collects any data citations, data availability statements, or supplementary materials included in this article.
Supplementary Materials
Figure S1. Flow diagram showing study selection for patient pool.
Table S1. Study designs of included studies.
Appendix S1. In Memoriam: Charles F. Shaefer, MD (1949‐2016).