

Abstract
The extremely poor prognosis of patients with symptomatic hepatocellular carcinoma (HCC) diagnosed clinically at advanced stages suggests an urgent need for biomarkers that can be used for prospective surveillance and pre-clinical screening for early presence of pre-malignant lesions and tumors. In a retrospective longitudinal phase 3 biomarker study in seven medical centers of China, time-series and 6 months interval-serum samples were collected from chronic hepatitis B virus infected (CHB) patient cohorts at the pre-malignant or pre-clinical stages (average 6 months prior to clinical diagnosis) and CHB patients that did not develop cancer, and circulating miRNAs measured. A set of serum miRNAs including miR-193a-3p, miR-369-5p, miR-672, miR-429 and let-7i* were identified in pre-clinical HCC patients and have the potential to screen for CHB patients at high risk to develop HCC 6–12 months after miRNAs measurement. These circulating miRNAs combined with the conventional screening tools using α-fetoprotein and ultrasound, may have great promise for the prediction and prevention of HCC in high-risk populations.
Keywords: Hepatocellular carcinoma, Circulating miRNAs, Biomarker, Prediction, Prevention
Introduction
Liver cancer ranks as the second leading cause of cancer-related mortality in man worldwide and most notably in developing countries [1]. Hepatocellular carcinoma (HCC) is the most prevalent malignant neoplasm of the liver. Due to the lack of effective strategies for early diagnosis and pre-clinical screening for HCC in high-risk populations, only a third of HCC patients are suitable for surgical resection at the time of clinical diagnosis [2]. The 5-year survival rate for patients with HCC was disappointedly low at 14% overall, as compared to approximately 27% for early diagnosed patients (American Cancer Society, Cancer Facts and Figures 2012). Consequently, powerful and reliable diagnostic tools, especially for the diagnosis of very early stage HCC are needed to improve the outcome of tumor patients, and to screen populations at high risk.
Liver ultrasound (US) and alpha-fetoprotein (AFP) tests are the most widely used methods for diagnosing and surveillance of HCC. Ultrasound was recommended as a screening method in liver cirrhotic patients [3], while it is still difficult to distinguish small HCC tumors from benign lesions due to operator’s experience, sample size, variable surveillance frequency, and verification bias [4-6]. Although better than des-γcarboxy-prothrombin (DCP) and lectin-bound AFP (AFPL3%), the sensitivity of AFP for the diagnosis of Barcelona clinic liver cancer staging system (BCLC) stage 0/A HCC is only 66% with a cutoff of 10.9 ng/ml [7]. A considerable number of patients with HCC showed low or normal AFP levels, while approximately 20%−25% of patients with chronic hepatitis, liver cirrhosis or other liver disease have increasing AFP level [8-10].
Circulating miRNAs have unique expression patterns in various tumors including HCC [11-13], implying their promising prospects as pre-clinical screening biomarkers. Here, a seven-center retrospective longitudinal study was conducted to identify serum miRNAs biomarkers for HCC pre-clinical screening, as part of the National Cancer Institute’s Early Detection Research Network (EDRN)-defined phase 3 study [14]. A five-miRNAs set was identified as a non-invasive biomarker for prediction and early prevention of premalignant HCC in asymptomatic individuals.
Materials and methods
Patients and groups
Serum samples collected at the time of HCC diagnosis, following the national comprehensive cancer network (NCCN) guidelines, were designated as G4: the clinical diagnosis group. Retrospectively, samples longitudinally collected from the same patients at an average of 6 months prior to diagnosis, were designated as G2: the pre-clinical group. Chronic hepatitis B virus infected (CHB) patients who did not develop HCC were regarded as the control group in our study (G3, the CHB group detection 2). Serum samples collected from these patients at average 6 months earlier were designated as G1: the CHB group detection 1 (Fig. 1A). The “3 step” study procedure (Fig. 1B and C, described in “Supplemental materials and methods” section) was approved by all seven local institutional review boards. All participants signed a consent form for participation in the survey, with permission of sample collection, utilization and data analysis. The 195 pre-clinical HCC serum samples (G2) met the eligibility criteria: (A) No tumors and chronic diseases unrelated to the liver. (B) Traditional ultrasound and alpha-fetoprotein (AFP) tests was performed on that patient once every 6 months for HCC screening, and the data are available to allow assessment of sensitivity and specificity for the biomarkers. The 435 CHB group detection 1 serum samples (G1) were enrolled following the criteria: (A) No HCC was diagnosed in that patient at least one year after G3 time point; (B) Traditional ultrasound and AFP tests were performed on that patient for cancer screening and the data are available. Healthy controls are donors with normal liver function, no viral hepatitis infection, and no any malignant disease. Liver hemangioma was diagnosed by imaging test and histology. Nonalcoholic fatty liver disease (NAFLD) and alcoholic fatty liver disease (AFLD) were diagnosed by history of diseases, clinical symptoms, laboratory and imaging evidence.
Fig. 1.
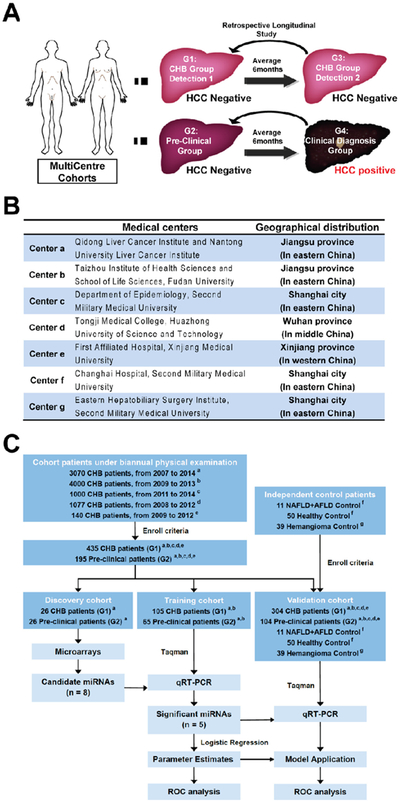
Retrospectively search for circulating miRNAs candidates as prospective surveillance biomarkers for pre-clinical HCC in high-risk populations. (A) Time series serum samples were recruited for monitor of HCC occurrence. The expression profiles of circulating miRNAs were analyzed in the G1 and G2 groups of patients as described. (B) The geographical distribution of all the patients and medical centers. (C) Design of the experimental procedure, number of patients and follow up intervals included.
Further details of the materials and methods used in this study can be found in the Supplemental materials and methods.
Results
A total of 9287 chronic hepatitis B virus infected (CHB) patients were followed up in our study (Fig. 1A and B) in the five centers (centers a-e) of China, all of which are located in the areas with a high incidence of HCC (Fig. 1B). All cohort patients had undergone biannual medical exams for screening of HCC occurrence with ultrasound and serum AFP test (Fig. 1C). A total of 195 pre-clinical HCC patients (G2) and 435 CHB (G1) controls (Fig. 1A, patients and groups were described in the Materials and methods section) were recruited for further analysis in this 3-step study following the enrollment criteria (Fig. 1C, study procedure and follow up intervals were described in the Supplemental materials and methods section).
In the discovery cohort, 26 pairs of matched G2 and G1 patients (Fig. 1C and Table S1) in Qidong center (Center a) [15] were selected. As shown in Figs. 2A and S1A, 8 miRNAs had significantly different expression levels in G2, including the down-regulation of miR-15a*, miR-758, miR-193a-3p, miR-369-5p and miR-219 and the up-regulation of miR-672, miR-429 and let-7i*, compared with G1. Quantitative RT-PCR was then used to validate each of the candidate miRNAs with independent sets (Fig. S1B). Only five of eight miRNAs (miR-193a-3p, miR-369-5p, miR-672, miR-429 and let-7i*) showed the same trend and significantly different expression in line with the microarray data, suggesting that these 5 miRNAs are potential candidates for pre-clinical screening of HCC.
Fig. 2.

A set including five serum miRNAs act as an effective screening biomarker for pre-clinical HCC. (A) In the discovery cohort, unique miRNAs that were either up-regulated or down-regulated in G2 relative to G1 were identified, based on calculation with permutation t test (n = 26). (B) ROC curve analysis was performed for the G2 (n = 65) and the G1 (n = 105) patients in the training cohort. (C) The logistic regression equation and parameters created in the training cohort was used to construct the ROC curve in the validation cohort. n = 104 for G2, n = 304 for G1. (D) The proportion of positive results of AFP (cut off = 17.850), miRNAs set (cut off=−0.272), miRNAs set plus AFP (cut off=−0.424) and ultrasound test in all 104 pre-clinical patients (G2) in the validation cohort.
Next, in the training cohort, other independent samples from the Qidong (Center a) and Taizhou centers (Center b) [16] were applied to construct receiver operating characteristics (ROC) curves to calculate the sensitivity and specificity of these miRNAs or AFP as active biomarkers (Figs. 1C and 2B). Predictive values and likelihood ratios for the circulating miRNAs and AFP in pre-clinical screening of HCC occurrence are shown in Table 1. In a comparison between G2 and G1, miR-429 showed the best AUC (area under the ROC curve) value of 0.670 (95% CI: 0.584–0.757), with a sensitivity of 35.4% and specificity of 97.1% at the cut off value of 2.866, followed by let-7i* (AUC = 0.656, Sensitivity = 56.9%, Specificity = 81.9%), miR-672 (AUC = 0.616, Sensitivity = 35.4%, Specificity = 93.3%), AFP (AUC = 0.603, Sensitivity = 36.9%, Specificity = 83.8%), miR-193a-3p (AUC = 0.580, Sensitivity = 43.1%, Specificity = 88.6%) and miR-369-5p (AUC = 0.561, Sensitivity = 26.2%, Specificity = 93.3%), separately. Logistic regression analysis also indicated that miR-429 is an independent marker for discrimination of pre-clinical patients with the odds ratio (OR) of 17.551 (95% CI: 5.676–80.292). ROC curve showed that the optimum predictive cut off value for AFP was 17.850 ng/ml with a sensitivity of 36.9%, which is better than the 26.2% sensitivity at the recommended clinical diagnostic cut off of 20 ng/ml, thus suggesting that AFP may have a population based prospective screening value when at a lower threshold. As shown in Table 1, combining above five circulating miRNAs remarkably enhanced the AUC to 0.764 (95% CI: 0.687–0.841, sensitivity = 69.2%, specificity = 80.0%). Further, all the potential combination schemes of individual biomarker were estimated (Tables S2 and S3). The five-miRNAs set plus AFP biomarker showed the best performance (Table 1, sensitivity = 75.4%, specificity = 78.1%).
Table 1.
The ROC analysis of each variate in training and validation cohort.
| Variate | AUC (95% CI) | Optimal cut off |
SE (%) |
SP (%) |
PPV (%) |
NPV (%) |
PLR | NLR | OR (95%Cl) | |
|---|---|---|---|---|---|---|---|---|---|---|
| Training cohort | miR-193a-3p | 0.580 (0.483, 0.678) | −7.480 | 43.1 | 88.6 | 70.0 | 71.5 | 3.769 | 0.643 | 5.758(2.694, 12.995) |
| miR-369-5p | 0.561 (0.468, 0.653) | −13.275 | 26.2 | 93.3 | 70.8 | 67.1 | 3.923 | 0.791 | 4.851 (1.936, 13.471) | |
| miR-672 | 0.616 (0.525, 0.707) | −1.251 | 35.4 | 93.3 | 76.7 | 70.0 | 5.308 | 0.692 | 7.462 (3.088, 20.311) | |
| miR-429 | 0.670 (0.584, 0.757) | 2.886 | 35.4 | 97.1 | 88.5 | 70.8 | 12.385 | 0.665 | 17.551 (5.676, 80.292) | |
| let-7i* | 0.656 (0.569, 0.744) | 1.606 | 56.9 | 81.9 | 66.1 | 75.4 | 3.146 | 0.526 | 5.884 (2.958, 12.094) | |
| AFP (ng/ml) | 0.603 (0.512,0.694) | 17.850 | 36.9 | 83.8 | 58.5 | 68.2 | 2.281 | 0.753 | 3.001 (1.459, 6.304) | |
| miRNAs set | 0.764 (0.687, 0.841) | −0.272 | 69.2 | 80.0 | 68.2 | 80.8 | 3.462 | 0.385 | 8.812 (4.392, 18.424) | |
| miRNAs + AFP | 0.790 (0.716, 0.864) | −0.424 | 75.4 | 78.1 | 68.1 | 83.7 | 3.441 | 0.315 | 10.661 (5.238, 22.816) | |
| Validation cohort | miR-193a-3p | 0.609 (0.535, 0.683) | −7.480 | 51.9 | 72.4 | 39.1 | 81.5 | 1.879 | 0.664 | 2.819 (1.781, 4.482) |
| miR-369-5p | 0.584 (0.514, 0.654) | −13.275 | 39.4 | 81.6 | 42.3 | 79.7 | 2.140 | 0.742 | 2.874 (1.758, 4.694) | |
| miR-672 | 0.711 (0.647, 0.776) | −1.251 | 60.6 | 79.6 | 50.4 | 85.5 | 2.970 | 0.495 | 5.956 (3.693, 9.725) | |
| miR-429 | 0.672 (0.602, 0.741) | 2.886 | 50.9 | 85.9 | 55.2 | 83.7 | 3.603 | 0.571 | 6.262 (3.803, 10.422) | |
| let-7i* | 0.506 (0.438, 0.574) | 1.606 | 35.6 | 74.7 | 32.5 | 77.2 | 1.405 | 0.863 | 1.628 (1.003, 2.620) | |
| AFP (ng/ml) | 0.635 (0.575, 0.695) | 17.850 | 26.0 | 90.1 | 47.4 | 78.1 | 2.631 | 0.821 | 3.192 (1.781, 5.714) | |
| miRNAs set | 0.798 (0.739, 0.857) | −0.272 | 80.8 | 72.7 | 50.3 | 91.7 | 2.958 | 0.265 | 11.048 (6.488, 19.612) | |
| miRNAs + AFP | 0.809 (0.753, 0.865) | −0.424 | 81.7 | 69.4 | 47.8 | 91.7 | 2.672 | 0.263 | 10.029 (5.869, 17.929) |
Note: AUC = area under curve, SE = sensitivity, SP = specificity, PPV = positive predictive value, NPV = negative predictive value, PLR = positive likelihood ratio, NLR = negative likelihood ratio, OR = odds ratio.
In the validation cohort, independent G2 and G1 samples from five medical centers (Center a: Qidong [15], Center b: Taizhou [16], Center c: Shanghai, Center d: Dongfeng-Tongji in Wuhan [17], Center e: Xinjiang) were enrolled to verify the performance of the logistic model parameters from the training cohort (Fig. 1C). We matched all clinical characteristics of the pre-clinical patients in the validation and training cohorts (Table S4). When comparing the G2 with G1 in the validation cohort, the AUC of the miRNAs set was 0.798 (95% CI: 0.739–0.857) with the sensitivity of 80.8% and the specificity of 72.7% at the cut off value of −0.272. When combining the miRNAs set with AFP, the AUC was 0.809 (95% CI: 0.753–0.865, sensitivity = 81.7%, specificity = 69.4%, Fig. 2C and Table 1). The performances of miRNAs set and miRNAs set plus AFP as biomarkers estimated in individual center is presented in Fig. S2. Note that, the non-ideal performance of these biomarkers presented in the Xinjiang center may be resulted from the possible effects of small sample size and HCV infection (Table S4).
Taking into account of all the 104 pre-clinical HCC patients in the validation cohort, we found that the positive proportion of circulating miRNAs set was extremely higher than that of AFP or ultrasound was (80.8% vs 26.0% or 0%), and the combination of miRNA set with AFP just slightly improved the positive proportion as compared with the miRNAs set alone (Fig. 2D and Table 1).
Far more important, the 5 miRNAs set biomarker displayed comparative performance for HCC pre-clinical screening regardless of AFP or cirrhosis status. Notably, 80.5% AFP-negative and 81.5% AFP-positive pre-clinical HCC patients can be diagnosed by this miRNAs set biomarker (Fig. 3A). A similar positive proportion was also obtained in both the cirrhosis-positive and negative pre-clinical HCC patients (73.3% vs 81.4%, Fig. 3B).
Fig. 3.

The prediagnostic trajectory of serum miRNAs biomarker. (A and B) The rate of positive values for serum miRNAs set (cut off =−0.272) in all 104 pre-clinical patients (G2) in the validation cohort by liver cirrhosis and AFP status (cut off = 17.850). Sixteen-six of 104 pre-clinical HCC patients in the validation cohort were lost the cirrhosis follow up messages in the study interval. (C) Twenty-seven of 35 pre-clinical HCC patients from the Qidong center (center a) in the validation cohort were estimated for serum miRNAs set positives at the cut off value −0.272, in which eighteen patients have spendable multiple sequential samples. Color line: patients with three time points sequential samples, n = 9. Black line: patients with two time points sequential samples, n = 9.
To evaluate the prediagnostic trajectory of the circulating miRNAs biomarker within an individual patient, we determined the expression of this five miRNAs set in multiple sequential samples collected at various times (at average 6, 12 and 18 months) before clinical diagnosis. The logistic values of the miRNAs set in the majority of pre-clinical HCC patients were positive (at the cut off value of −0.272) as the time interval between specimen collection and HCC diagnosis was no longer than 12 months (Fig. 3C), suggesting that the usage of this miRNAs set biomarker can dramatically improve the performance of pre-clinical screening and effective prediction the development of HCC up to one year before traditional methods (Fig. S3A). For individual miRNAs, as expected, miR-193a-3p and miR-369-5p were decreased longitudinally and miR-429, miR-672 and let-7i* were increased gradually (Fig. S3B), which similar with the trends that when compared these miRNAs expressions horizontally between G2 and G1 group.
Discussion
Due to the extremely poor prognosis of HCC at advanced stages, prospective surveillance and pre-clinical screening of HCC is of utmost importance for high-risk populations. A previous report indicated that tumor growth from an undetectable lesion to 2 cm size may take approximately 4–12 months, with individual differences [18]. This observation suggests that the screening interval for surveillance of HCC in high-risk populations set at 6 months may suitable. Herein, we identified a new set of circulating miRNAs biomarker by determining their serum profiles in patients prior to HCC clinical diagnosis with five follow-up cohorts of CHB patients and two independent controls in China, through a retrospective, longitudinal biomarker identification study. At the stage when the AFP level was low and there were no abnormal ultrasound signals, our serum miRNAs biomarker showed ideal performance in pre-clinical screening of HCC occurrence and differentiating pre-clinical HCC from CHB patients as early as 12 months prior to definite clinical diagnosis (Fig. 4). The cutoff value calculated from the miRNAs panel for HCC pre-clinical screening in CHB patients was −0.272. A calculated value higher than −0.272 is implies the high risk of HCC occurrence in the subsequent 6–12 months.
Fig. 4.

A model for circulating miRNAs set action in prospective surveillance and pre-clinical screening of HCC occurrence at the stage when the AFP levels was low and no abnormal ultrasound findings.
Citing the limitation of sensitivity and specificity, AFP was not recommended as an independent screening biomarker for populations at high risk of HCC developing (AASLD practical guidelines in 2010 and NCCN clinical practice guidelines in 2015). A recent study validated a laboratory algorithm based on the levels of AFP, platelets, and ALT, along with age, for identifying patients with hepatitis C virus-associated cirrhosis likely to develop HCC within 6 months. Patients with the 20 ng/ml and 120 ng/ml AFP values, who were 70 years old, with ALT levels of 40 IU/ml and platelet counts of 100,000, had probabilities of developing HCC of 8.1% and 29.0%, respectively. Unfortunately, the power of such traditional characteristics was significantly weakened due to the relative small patient size from one center cohort, and was based on laboratory algorithm with a lack of longitudinal samples [19]. In our seven-center retrospective longitudinal study, the application of serum miRNAs biomarker dramatically increased the sensitivity of prediction 6 months prior to HCC occurrence (Table 1, 69.2% in the training cohort and 80.8% in the validation cohort), as compared with the extremely low screen sensitivity of AFP test (36.9% in the training cohort and 26.0% in the validation cohort). Whereas, the miRNAs set combined AFP biomarker only showed slight improvement of sensitivity and specificity in comparison with miRNAs set alone did (Table 1 and Fig. 2D), which further emphasized the shortage of currently utilized methods for HCC screening. Considering a previous study showing that miR-429, an individual pre-clinical screening biomarker with best performance in this set, could serve as marker of human exposure to aflatoxins [20] and our finding that the enrichment of miR-429 can manipulate liver EpCAM positive tumor-initiating cells properties and be secreted from which to mediate the intercellular communication [21,22], these results suggest that abnormal miRNAs may function at even earlier stages in initiation and progression of liver cancer.
It is noteworthy that non-ideal specificity were documented when the five miRNAs set biomarker in pre-clinical HCC patients were compared with healthy and liver hemangioma controls, or the estimated miRNAs set combined with AFP in pre-clinical HCC patients compared with NAFLD and AFLD controls, respectively (Fig. S4). This may result from the heterogeneous expression of these variables between relative healthy and CHB controls (Fig. S5), suggesting that an optimized model and cut off value after elimination of the noise variable should be introduced when pre-clinical screening HCC in healthy population is conducted (Fig. S6, Tables S2 and S3).
To our knowledge, the five-miRNAs set we identified from a phase 3 study meeting EDRN criteria is the first specific biomarker for the prospective surveillance and pre-clinical screening of HCC occurrence in high-risk populations. At present, it takes only about 3 hours and less than 100 μl of serum to complete the evaluation. We believe that this finding may enable us to develop a non-aggressive and efficient tool for early predict and prevent of HCC. For patients who are positive got this five-miRNAs biomarker, screening HCC with a more sensitive imaging technique such as contrast-enhanced magnetic resonance imaging (MRI) or with higher frequencies than usual based on their risk of developing HCC should be conducted. Further investigation with a larger pool of prospective patients is warranted to verify the operating characteristics of this serum miRNAs biomarker. After that, this biomarker should have immediately clinical applicability.
Supplementary Material
Acknowledgements
The authors thank Professor YY Liu, GS Feng for helpful and valuable discussions and Dongping Hu, Shanhua Tang, Linna Guo, Dandan Huang, Shanna Huang, Huanlin Sun and Congli Hu for technical assistance.
Funding
We gratefully acknowledge the support from the State Key Project for Liver Cancer (2012ZX10002-009), the National Research Program of China (2012CB316503, 2012AA02A201), National Natural Science Foundation of China (81221061, 81422032, 81272212, 81300306 and 81372674) and Natural Science Foundation of Shanghai (134119a3700, 20154Y0054).
Abbreviations:
- AUC
area under the ROC curve
- AFP
alpha-fetoprotein
- AFPL3%
lectin-bound AFP
- BCLC
Barcelona Clinic Liver Cancer staging system
- CHB
chronic hepatitis B virus infection
- DCP
Des-γcarboxy-prothrombin
- HCC
hepatocellular carcinoma
- OR
odds ratio
- ROC
receiver operating characteristics
- US
ultrasound
Footnotes
Conflict of interest
No conflicts of interest exist. The authors have no financial relationship to disclose.
Appendix: Supplementary material
Supplementary data to this article can be found online at doi:10.1016/j.canlet.2016.01.028.
References
- [1].Torre LA, Bray F, Siegel RL, Ferlay J, Lortet-Tieulent J, Jemal A, Global cancer statistics, 2012, CA Cancer J. Clin. 65 (2) (2015) 87–108. [DOI] [PubMed] [Google Scholar]
- [2].Llovet JM, Di Bisceglie AM, Bruix J, et al. , Design and endpoints of clinical trials in hepatocellular carcinoma,J. Natl Cancer Inst. 100(10) (2008) 698–711. [DOI] [PubMed] [Google Scholar]
- [3].Bruix J, Sherman M, Management of hepatocellular carcinoma, Hepatology 42(2005)1208–1236. [DOI] [PubMed] [Google Scholar]
- [4].Marrero JA, Romano PR, Nikolaeva O, et al. , Gp73, a resident Golgi glycoprotein, is a novel serum marker for hepatocellular carcinoma,J. Hepatol. 43(2005) 1007–1012. [DOI] [PubMed] [Google Scholar]
- [5].Poon D, Anderson BO, Chen LT, et al. , Management of hepatocellular carcinoma in Asia: consensus statement from the Asian Oncology Summit 2009, Lancet Oncol. 10(2009) 1111–1118. [DOI] [PubMed] [Google Scholar]
- [6].Gebo KA, Chander G, Jenckes MW, et al. , Screening tests for hepatocellular carcinoma in patients with chronic hepatitis C: a systematic review, Hepatology 36 (2002) S84–S92. [DOI] [PubMed] [Google Scholar]
- [7].Marrero JA, Feng Z, Wang Y, et al. , Alpha-fetoprotein, des-gamma carboxyprothrombin, and lectin-bound alpha-fetoprotein in early hepatocellular carcinoma, Gastroenterology 137 (1)(2009) 110–118. [DOI] [PMC free article] [PubMed] [Google Scholar]
- [8].Stefaniuk P, Cianciara J, Wiercinska-Drapalo A, Present and future possibilities for early diagnosis of hepatocellular carcinoma, World J. Gastroenterol. 16 (2010) 418–424. [DOI] [PMC free article] [PubMed] [Google Scholar]
- [9].Liaw YF, Tai DI, Chen TJ, Chu CM, Huang MJ, Alpha-fetoprotein changes in the course of chronic hepatitis: relation to bridging hepatic necrosis and hepatocellular carcinoma, Liver 6(1986) 133–137. [DOI] [PubMed] [Google Scholar]
- [10].Zinkin NT, Grall F, Bhaskar K, et al. , Serum proteomics and biomarkers in hepatocellular carcinoma and chronic liver disease, Clin. Cancer Res. 14 (2008) 470–477. [DOI] [PubMed] [Google Scholar]
- [11].Mitchell PS, Parkin RK, Kroh EM, et al. , Circulating microRNAs as stable blood-based markers for cancer detection, Proc. Natl. Acad. Sci. U.S.A. 105 (30) (2008)10513–10518. [DOI] [PMC free article] [PubMed] [Google Scholar]
- [12].Chen X, Ba Y, Ma L, et al. , Characterization of microRNAs in serum: a novel class of biomarkers for diagnosis of cancer and other diseases, Cell Res. 18(10) (2008) 997–1006. [DOI] [PubMed] [Google Scholar]
- [13].Zhou J, Yu L, Gao X, et al. , Plasma microRNA panel to diagnose hepatitis B virus-related hepatocellular carcinoma, J. Clin. Oncol. 29 (36) (2011) 4781–4788. [DOI] [PubMed] [Google Scholar]
- [14].Pepe MS,Etzioni R, Feng Z, et al. , Phases of biomarker development for early detection of cancer,J. Natl Cancer Inst. 93(14) (2001) 1054–1061. [DOI] [PubMed] [Google Scholar]
- [15].Chen J, Lu J, Zhu Y, Zhu J, Zhang Y, A thirty-one year prospective follow-up program on the HBsAg carrier state and primary liver cancer in QiDong, China, Zhonghua Liu Xing BingXue Za Zhi 31 (7) (2010) 721–726. [PubMed] [Google Scholar]
- [16].Wang X, Lu M,Qian J, et al. , Rationales, design and recruitment of the TaiZhou Longitudinal Study, BMC Public Health 9 (2009) 223. [DOI] [PMC free article] [PubMed] [Google Scholar]
- [17].Wang F, Zhu J, Yao P, et al. , Cohort Profile: the Dongfeng-Tongji cohort study of retired workers, Int. J. Epidemiol. 42 (3) (2013) 731–740. [DOI] [PubMed] [Google Scholar]
- [18].Yoshino M, Growth kinetics of hepatocellular carcinoma,Jpn J. Clin. Oncol. 13 (1983)45–52. [PubMed] [Google Scholar]
- [19].El-Serag HB, Kanwal F,Davila JA,Kramer J, Richardson P, A new laboratory-based algorithm to predict development of hepatocellular carcinoma in patients with hepatitis C and cirrhosis, Gastroenterology 146 (5) (2014) 1249–1255. [DOI] [PMC free article] [PubMed] [Google Scholar]
- [20].Valencia-Quintana R, Sánchez-Alarcón J, Tenorio-Arvide MG, et al. , The microRNAs as potential biomarkers for predicting the onset of aflatoxin exposure in human beings: a review, Front. Microbiol. 5 (2014) 102. [DOI] [PMC free article] [PubMed] [Google Scholar]
- [21].Li L, Tang J, Zhang B, et al. , Epigenetic modification of MiR-429 promotes liver tumor-initiating cells properties by targeting Rb binding protein 4, Gut 64 (1) (2015)156–167. [DOI] [PubMed] [Google Scholar]
- [22].Li L, Wang H, Heterogeneity of liver cancer and personalized therapy, Cancer Lett. (2015) doi: 10.1016/j.canlet.2015.07.018 pii: S0304-3835(15)00473-5. [DOI] [PubMed] [Google Scholar]
Associated Data
This section collects any data citations, data availability statements, or supplementary materials included in this article.