

Abstract
An effective method for in vivo detection of early therapeutic response of patients with non-Hodgkin’s lymphoma would enable personalized clinical management of cancer therapy and facilitate the design of optimal treatment regimens. This study evaluates the feasibility of T2-weighted MRI (T2WI) and diffusion-weighted MRI (DWI) for in vivo detection of response of human diffuse large B-cell lymphoma xenografts in severe combined immunodeficient mice to chemotherapy. Each cycle of combination chemotherapy with cyclophosphamide, hydroxydoxorubicin, Oncovin, prednisone, and bryostatin 1 (CHOPB) was administered to tumor-carrying mice weekly for up to four cycles. T2WI and DWI were performed before the initiation of CHOPB and after each cycle of CHOPB. In order to corroborate the MRI results, histological analyses were carried out on control tumors and treated tumors after completion of all MRI studies. DWI revealed a significant (P < 0.03) increase in the mean apparent diffusion coefficient in CHOPB-treated tumors as early as 1 week after initiation of CHOPB. However, a significant (P < 0.03) decrease in mean T2 was observed only after two cycles of CHOPB. Both MRI methods produced high-resolution (0.1 × 0.1 × 1.0 mm3) maps of regional therapeutic response in the treated tumors based on local apparent diffusion coefficient and T2. Only a specific region of the tumors (in 3 of the 5 tumors) corresponding to about one third of the tumor volume exhibited a response-associate increase in ADC and decrease in T2. An adjacent region exhibited an increase in T2 and no change in ADC. The rest of the tumor was indistinguishable from sham-treated controls by MRI criteria. The therapeutic response of the treated tumors detected by MRI was accompanied by changes in tumor cell density, proliferation and apoptosis revealed by histological studies performed upon completion of the longitudinal study. The mechanism producing the regional response of the tumor remains to be elucidated.
Keywords: MRI, non-Hodgkin’s lymphoma, chemotherapy, response, apparent diffusion coefficient, T2
INTRODUCTION
Non-Hodgkin’s lymphomas (NHLs) comprise a heterogeneous group of closely related B-cell and T-cell malignancies of the lymphatic system (1). The worldwide incidence of NHL has risen steeply (e.g. by 3% per annum in the USA) in the past three decades. An estimated 59 900 new cases of NHL are diagnosed in the USA annually. NHL is the fifth and sixth most prevalent cancer in females and males, respectively (2). Currently, only about a third of NHL tumors are cured by standard chemotherapy (3). The availability of non-invasive methods for predicting and/or detecting therapeutic response of NHL tumors at an early stage of treatment would facilitate the rational design and individualization of therapy protocols for patients with this malignancy. This would spare non-responsive patients the unnecessary toxicity and expense of ineffective therapy and would offer them opportunities to explore more effective alternative treatments at an earlier time. However, an effective method of detecting early response of patients with NHL to the wide range of therapeutic agents available for treatment of this disease remains elusive, as sensitive and specific markers of therapeutic response are still under investigation.
Positron emission tomography (PET) with [18F]fluorodeoxyglucose (FDG) is widely used for clinical staging and treatment evaluation of NHL (4). Although FDG PET has higher sensitivity than anatomic imaging modalities such as computed tomography and conventional MRI, it suffers from low spatial resolution (cited as 4–5 mm, but actually often as high as 7–8 mm in clinical PET) and exposes patients to ionizing radiation (as does computed tomography). The extent of FDG uptake by lesions smaller than twice the quoted resolution of PET is often underestimated (5). For these reasons, a high-resolution non-radiation-associated imaging method for reliable early detection of therapeutic response of NHL is highly desirable.
In vivo MRS has been explored for non-invasive assessment of tumor biochemistry and physiology in response to therapy (6–14). In vivo 1H MRS detects a number of tumor metabolites associated with cell proliferation or degradation, phospholipid metabolism, and bioenergetics (6,11,15,16). In vivo 31P MR spectra display peaks originating predominantly from precursors and catabolites of membrane phospholipids, high-energy phosphates, and inorganic phosphate (14,17–19). Thus, 31P MRS has often been used to evaluate the energetic status of tumors and to detect metabolic changes associated with changes in tumor perfusion and therapeutic response (18,20). A multi-institutional clinical trial recently found that pretreatment 31P MRS of NHL tumors identified approximately two-thirds of the patients with NHL who subsequently failed to exhibit a complete clinical response (i.e. disappearance of the local tumor) to a variety of therapeutic modalities (13,21). This study suggests that proton-decoupled 31P MRS measurements of the phospholipid precursors, phosphocholine and phosphoethanolamine, normalized to total nucleoside triphosphates could serve as general predictors of therapeutic response failure for NHL. However, the low sensitivity and spatial resolution of 31P MRS compared with 1H MRS limits its clinical utility to relatively large superficial tumors (≥27 cm3 at 1.5 T or ≥10 cm3 at 3 T) (13). In contrast, 1H MRS detects much smaller tumors (8–10 cm3 at 1.5 T) (22). Proton MRI detects even smaller lesions, ~4 mm3 in volume at 1.5 T. Furthermore, it is possible to generate quantitative high-resolution pixel-by-pixel maps of various MR parameters such as T2 and the apparent diffusion coefficient (ADC), which can be used to assess regional therapeutic response within a tumor. No other non-invasive imaging method can match the spatial resolution and soft-tissue contrast of MRI. Also the longitudinal 1H MRI methods we are investigating should be applicable to all patients with NHL and not just to those with large superficial tumors and should serve as indicators of therapeutic success as well as failure and even of regional response within the tumor.
Diffusion-weighted MRI (DWI) can be used to monitor cellular structures in biological media (23). DWI differentiates benign from malignant lesions in brain (24–26), liver (27), breast (28,29), and prostate (30). As response-induced cell swelling and apoptosis produce detectable changes in the ADC, DWI has been a valuable method for monitoring treatment response (25,31,32). However, its utility for monitoring the therapeutic response of NHL has not been well evaluated.
The transverse relaxation (T2) time of water protons is sensitive to molecular dynamics and chemical and physical environments of water protons in biological systems (33). Changes in tissue architecture such as density and spatial distribution of cells and water molecules induce changes in dipolar spin–spin interactions and magnetic homogeneity within the tissue, which are two key factors determining the transverse relaxation rate of water protons in tissue. Thus, T2 relaxation is a useful MR contrast mechanism for investigating tissue microstructure and physiology. Precise measurement of T2 changes by T2-weighted MRI (T2WI) has detected tumor progression and therapeutic response (34). However, the utility of this method for detecting the response of NHL tumors to chemotherapy requires further assessment.
Longitudinal clinical studies of the response of human NHL tumors to therapy are limited by the lack of proper markers of therapeutic response. Mouse xenograft models of human NHL facilitate development of MRS and MRI techniques for serial assessment of therapeutic response. These methods hold great promise for tailor-fitting of therapeutic protocols to the needs of individual patients, for evaluating new therapeutic agents, and for identification of therapeutic biomarkers.
The combination of DWI and T2WI provides a valuable approach for detecting regional response within NHL tumors. DWI and T2WI provide complementary information on cellular structure and chemical and physical environment. In this study, we have evaluated the utility of both of these methods for detecting the response of xenografts of human diffuse large B-cell lymphoma (WSU-DLCL2), the most common form of NHL, to chemotherapy with a combination of cyclophosphamide, hydroxydoxorubicin, Oncovin, prednisone, and bryostatin 1 (CHOPB) (35). These studies will serve as a guide for application of these methods to human patients.
Whereas combination chemotherapy with CHOP is the standard treatment for large B-cell lymphomas, the WSU-DLCL2 tumor exhibits only a low level of response to this regimen. The addition of the cytokine bryostatin 1 to the regimen substantially increases the response, presumably by suppressing expression of multidrug resistance or by increased expression of bax (35–37). Thus, different degrees of drug response can be studied in the same tumor model through the inclusion or exclusion of bryostatin 1 in the regimen (i.e. CHOPB and CHOP, respectively). Therefore, we have been using MRS to compare the response of WSU-DLCL2 tumors to CHOPB (38) and CHOP (39).
MATERIALS AND METHODS
Cell line and tumor implantation
The Institutional Animal Care and Use Committee of the University of Pennsylvania approved all the procedures for animal studies. The human WSU-DLCL2 cell line was established at Wayne State University and kindly supplied by Drs Ramzi Mohammad and Ayad Al-Katib (35). WSU-DLCL2 cells were cultured in RPMI 1640 medium with 10% heat-inactivated fetal bovine serum (Hyclone, Logan, UT, USA), 1% penicillin/streptomycin (Invitrogen, Carlsbad, CA, USA) and 1% Hepes (Mediatech, Inc., Herndon, VA, USA). The cells were passaged two or three times a week and maintained under humidified 5% CO2 at 37°C. WSU-DLCL2 tumors were subcutaneously implanted in the upper thighs of 6–8-week-old female severe combined immunodeficient mice (NCI, Bethesda, MD, USA) by inoculating 1.0×10⁷ WSU-DLCL2 cells in 0.1 mL Hanks’ balanced salt solution (Invitrogen/ Gibco). Palpable tumors developed within a month. Tumor volume was measured twice a week with calipers and calculated as (π/6) ×a×b×c, where a, b, and c are three orthogonal dimensions. MRI studies and chemotherapy were initiated when the tumor volume reached ~500 mm3. Animals were euthanized at the conclusion of the MR experiments or to avoid distress when the tumor burden reached 1500 mm3.
Tumor treatment
Five tumor-bearing mice were treated once a week with CHOPB over a period of 4 weeks. Each cycle of CHOPB consisted of: cyclophosphamide (Baxter Healthcare Corporation, Deerfield, IL, USA), intravenous injection at a dose of 40 mg/kg in a 20 mg/ml solution on day 1; hydroxydoxorubicin (Bed Venue Laboratories, Inc., Bedford, OH, USA), intravenous injection at 3.3 mg/kg in a 2 mg/mL solution (day 1); Oncovin (SICOR Pharmaceuticals, Inc., Irvine, CA, USA), intravenous injection at 0.5 mg/kg in a 1 mg/mL solution (day 1); prednisone (Mathew J. Ryan Veterinary Hospital Pharmacy, Philadelphia, PA, USA), per os gavage at a dose of 0.2 mg/kg in a 0.1 mg/mL saline solution (days 1–5); and bryostatin 1 (Biomol International LP, Plymouth Meeting, PA, USA), intraperitoneal injection at a dose of 75 mg/kg, in a 38 µg/mL saline solution (day 1). The three intravenous drugs were mixed together and administered in a single tail vein injection. Control tumor-bearing animals (n = 5) were sham-treated with saline.
MRI studies
All MRI experiments were performed before drug treatment and after completion of each of four cycles (one cycle per week) of chemotherapy. Five control mice and five treated mice underwent MRI experiments at each time point. During all MRI experiments, the mice were anesthetized with 1.0–1.5% isoflurane in 1 L/min oxygen administered through a nose cone. An MR-compatible small-animal monitoring and gating system (SA Instruments, Inc., Stony Brook, NY, USA) was used to record the animal’s electrocardiogram and body temperature, which was maintained at 36.8°C by blowing warm air through the magnet bore.
MRI studies were performed on a 4.7 T/50 cm horizontal bore magnet equipped with 12 cm, 25 G/cm gradients and interfaced to a Varian Inova console (Varian, Palo Alto, CA, USA). A home-built quadrature birdcage volume probe (inner diameter 30 mm) was used for radiofrequency transmission and detection. DWI experiments were performed with a multi-slice spin-echo sequence using 12 bipolar gradients applied in three orthogonal directions to generate diffusion tensor weighting in a single shot (40). This technique applies four bipolar diffusion-weighting gradients in each direction such that the contributions of susceptibility gradients to diffusion attenuation were minimized. Each bipolar gradient employed all three of the physical gradients simultaneously, thus utilizing the full dynamic range of the gradient system. A series of DW MR images were acquired for each slice at four b-values. The b-values of single bipolar gradients were in the range 0–112 s/mm2, resulting in the combined b-values of 0, 149, 596, and 1342 s/mm2. Other sequence parameters included a TR and TE of 2 s and 60 ms, respectively, a matrix size of 256×128, and two acquisitions per image. Maps of ADC were computed by fitting DWI images on a pixel-by-pixel basis to Mb=M0 exp(−b×ADC), where Mb and M0 are the MR signal intensities with and without diffusive attenuation, respectively, and b is the diffusion weighting factor. A multi-slice spin-echo imaging sequence was used for T2WI with four TE values ranging from 15 to 75 ms, TR of 2 s, and matrix size of 256×128. T2 maps were computed by a pixel-by-pixel fit to Mt=M0 exp (−TE=T2), where Mt is the signal intensity acquired at a given TE, and M0 is the equilibrium signal intensity. A threshold value of 0.01 was used to mask the data during the fittings. Graphs of T2 and ADC were generated, and the full width at half maximum (FWHM) of the graphs was determined. Mean values of both T2 and ADC were calculated over multiple slices of all control and treated tumors.
MRI data processing was performed using the Varian Image Browser program and a program of image reconstruction written in Matlab (The MathWorks, Inc., Natick, MA, USA).
Histological study
In order to elucidate morphological characteristics, measure the proliferative index and determine the extent of apoptosis, histological analyses were carried out on four control tumors and four CHOPB-treated tumors after completion of all MRI experiments. After the animals were sacrificed by cervical dislocation, the tumors were immediately dissected, and 10 mm cryosections were prepared. The sections were either fixed with 10% buffered formalin or stored at −80°C in a refrigerator for subsequent histological studies. Hematoxylin and eosin (H&E) staining were performed on formalin-fixed, paraffin embedded tissue sections to assess the morphology of the tumor tissues. Cryosections were stained with immunofluorescent reagents for quantification of cell proliferation. A rabbit monoclonal antibody to human Ki67 (Biomeda Corp., Foster City, CA, USA) and a fluorescein isothiocyanate (FITC)-conjugated anti-rabbit IgG (Santa Cruz Biotechnology, Inc., Santa Cruz, CA, USA) were used as primary antibody and secondary antibody, respectively. Apoptosis induced by CHOPB treatment was detected by terminal deoxynucleotidyl transferase-mediated dUTP nick end labeling (TUNEL) assay of tumor cryosections. The TUNEL assay was performed according to the manufacturer’s protocol using fluorescence labeling of DNA strand breaks with the In Situ Cell Death Detection Kit, Fluorescein (Roche Applied Science, Indianapolis, IN, USA). The incorporated fluorescein from the TUNEL assay distinguishes apoptotic cells by fluorescence microscopy.
Total tumor cells, proliferative cells, and apoptotic cells were counted in H&E-stained, immunohistochemically labeled and TUNEL-assayed tissues, respectively. At least three high-power fields were examined on each cryosection. The densities of tumor cells, proliferative cells, and apoptotic cells of treated tumors and control tumors were calculated.
Statistical analysis
Data from control tumors and CHOPB-treated tumors were compared by Student’s t-test analysis. P ≤ 0.05 was considered significant. Data are presented as mean ± SE.
RESULTS
Tumor growth delay
Figure 1 displays changes in mean tumor volume (n=5) over a period starting 5 days before initiation of CHOPB chemotherapy and continuing until the completion of four cycles of treatment. For each cycle, there were three measurements, one before the cycle, one near the middle of the cycle, and one after completion of the cycle, with a single measurement between two consecutive cycles. The mean tumor volume of CHOPB-treated animals had increased from ~600 mm3 to 1000 mm3 by the middle of the first cycle, then decreased by ~30% to the pretreatment volume; tumor volume then monotonically decreased slightly over the remainder of the 4-week treatment period. Controls exhibited a monotonic increase in tumor volume over the whole course of therapy. Differences between volumes of controls and treated tumors were significant after the first cycle of CHOPB (i.e. one week after initiation of therapy).
Figure 1.
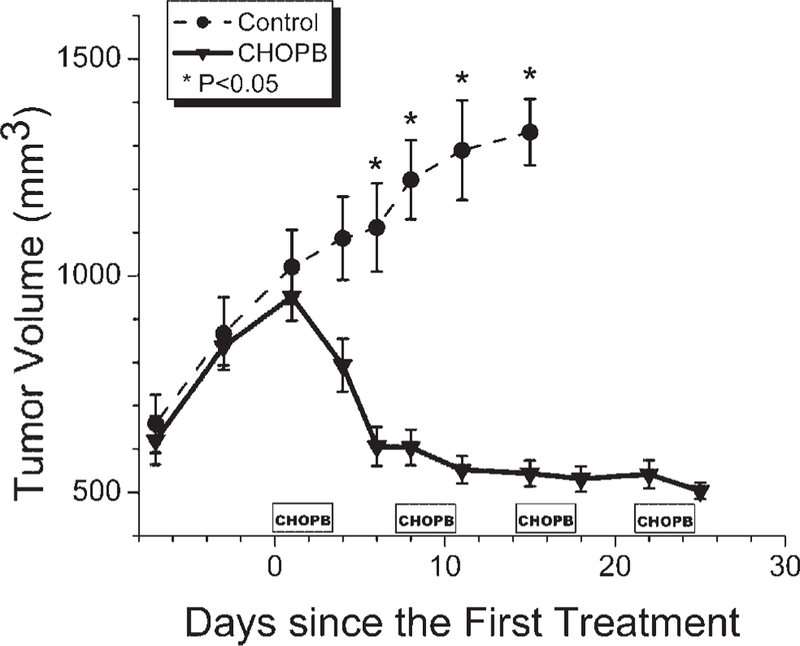
Time dependence of the volume of the control tumors and CHOPB-treated tumors. *P < 0.05 for differences in volume of treated and control tumors at the same time after treatment.
DWI and T2WI
Figure 2a displays the ADC maps of a control tumor (upper row) and a treated tumor (lower row) before the first cycle of CHOPB and the same tumors after two cycles of CHOPB (right column). White arrows indicate tumor boundaries. After two cycles of CHOPB, a distinct region of higher ADC (characteristic of therapeutic response) is apparent in the portion of the ADC map of the treated tumor indicated by the red arrow; no such region of increased ADC is evident in the map of the control tumor at the same time point. Figure 2b shows the T2 maps of a control tumor (upper row) and a treated tumor (lower row) before the first cycle of CHOPB (left column) and after two cycles of CHOPB (right column). These are the same tumors as shown in Fig. 2a. The region of therapeutic response (red arrow in the lower right hand panel of Fig. 2b) exhibits a distinct decrease in T2 (blue pixels). This is the same region of the treated tumor that showed an increase in ADC in the upper panel. Adjacent to the region of decreased T2 is a region exhibiting a pronounced increase in T2 (bright red) compared to sham treated controls and unaffected regions of the treated tumor. Only three of the five treated tumors exhibited regional response. Other tumors also exhibited heterogeneous response but not limited to distinct regions of the tumor.
Figure 2.

(a) ADC and (b) T2 maps of a control tumor (upper row) and a CHOPB-treated tumor (lower row) before treatment (left column) and after two cycles of CHOPB (right column). The tumor boundary is indicated with white arrows. Red arrows point to the responsive region where higher ADC and lower T2 were measured.
Figure 3 shows graphs of ADC (a) and T2 (b) of the control and treated tumor, the ADC and T2 maps of which are presented in Fig. 2. The graphs were averaged over all slices of these tumors. The pretreatment graphs of the control and treated tumors (designated as Control 0 and CHOPB 0 in Fig. 3a,b) have similar widths; however, the post-treatment graphs (after two cycles of CHOPB, designated as Control 2 and CHOPB 2, respectively) are significantly broadened for both control and treated tumors (i.e. both tumors become more heterogeneous with time), with slightly greater broadening for the treated tumor. Also the ADC graph for the treated tumor is displaced to the right (higher ADC), whereas the T2 graph of the treated tumor is shifted to the left (lower T2). The FWHM of the ADC graphs of the treated tumor and control tumor after two cycles of treatment are 5.4×10⁻⁴ mm2/s and 4.8×10⁻⁴ mm2/s, respectively. The FWHM of the T2 graphs of the treated tumor after two cycles of CHOPB is greater than that of the control tumor at the same time point (21.8 ms for the treated tumor vs 18.7 ms for the control tumor). Since the volumes of the control tumors are approximately two times larger than those of the corresponding treated tumors, the gradients of ADC and T2 within the treated tumor are much steeper than those of the control tumor. Thus, the T2 and ADC maps indicate more heterogeneity in the treated tumors than in the control tumors after two cycles of CHOPB, which reflects heterogeneous regional response within the tumors.
Figure 3.
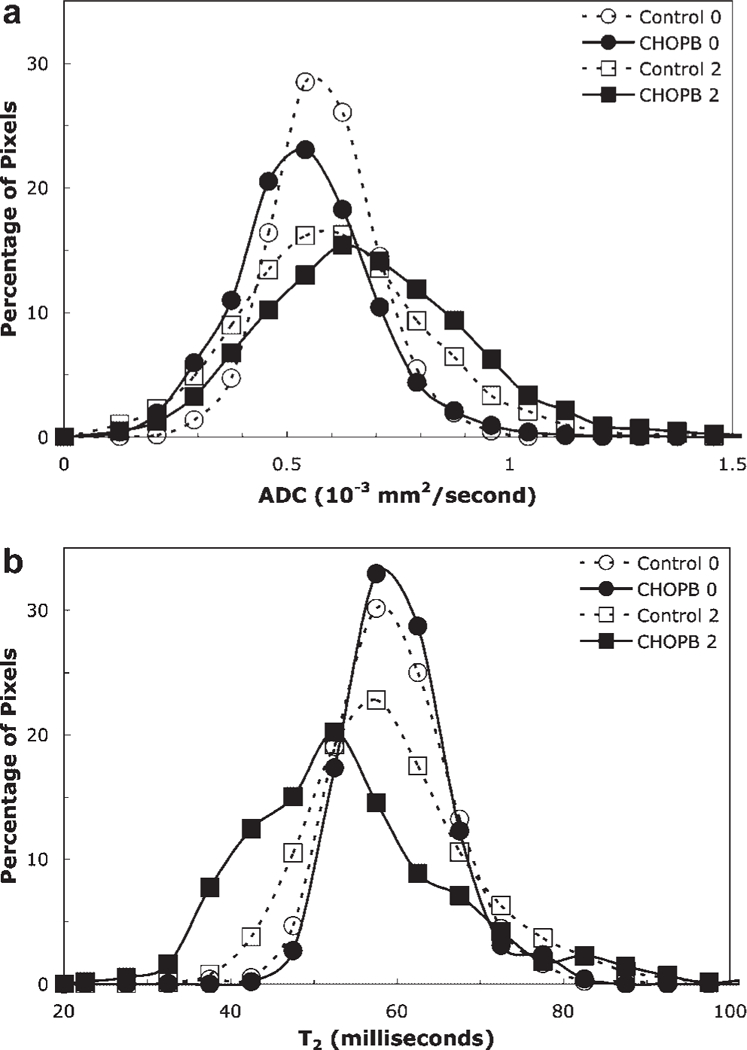
The histograms of (a) ADC maps and (b) T2 maps (as shown in Figure 2) of the control tumor before sham treatment (broken line, open circle) and after two cycles of sham treatment (broken line, open square), and of the CHOPB treated tumor before CHOPB treatment (solid line, filled circle) and after two cycles of CHOPB (solid line, filled square).
Figure 4a shows the time dependence of the mean ADC of control and treated tumors (averaged over the entire volume of the five tumors at each time point, but avoiding boundary voxels to exclude muscle contamination). The mean ADC exhibits a significant (P < 0.03) increase from (6.3±0.2)×10−4 mm2/s to (7.0±0.2) 10−4 mm2/s in the treated tumors after one cycle of CHOPB, but no significant change is observed in the control tumors during this time interval. Control tumors could not be studied further as the tumor volumes were greater than 1500 mm3 after 2 weeks of initial MR measurements, necessitating sacrifice of these animals in accordance with Institutional Animal Care and Use Committee guidelines. A significant difference in mean ADC is also observed between control and CHOPB-treated tumors after the first cycle of CHOPB treatment.
Figure 4.
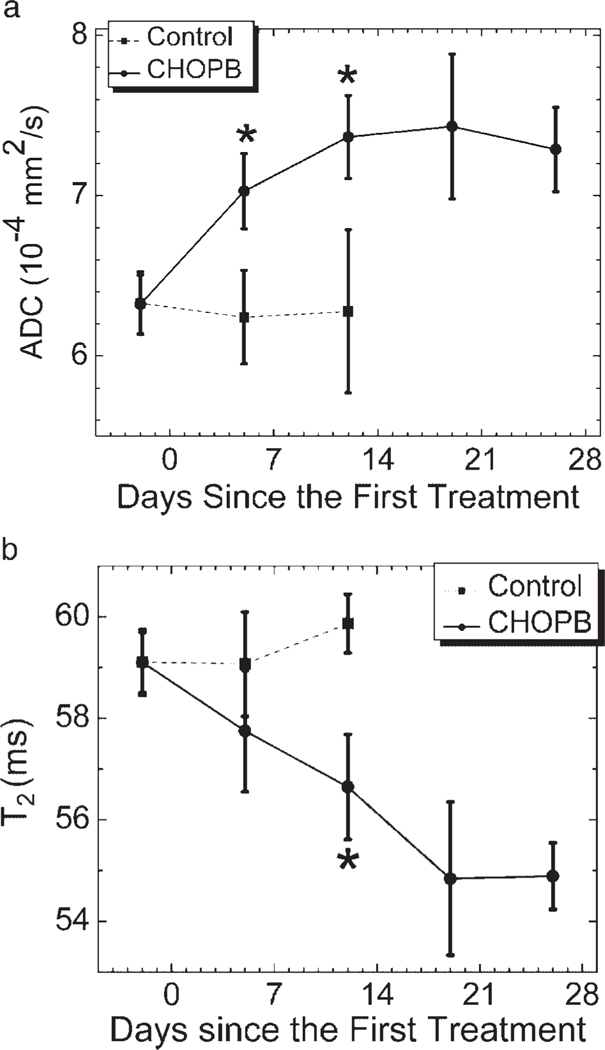
Time courses of (a) mean ADC and (b) mean T2 of control tumors and CHOPB-treated tumors. *P < 0.03 for treated vs control at the same time after therapy.
Figure 4b depicts the time course of the mean T2 of control and treated tumors. After two cycles of CHOPB, the mean T2 of the treated tumors had decreased significantly (P < 0.03) relative to its pretreatment value from 59.1±0.6 ms to 56.6±1.04 ms. In contrast, the mean T2 of control tumors shows no significant change (59.1±0.7 ms before treatment and 59.9 0.6 ms after two cycles of sham treatment). As indicated in Fig. 4b, a significant difference in mean T2 between treated and control tumors is observed only after two cycles of CHOPB treatment. This may reflect the offsetting effect of post-treatment increases and decreases in T2 in the same tumors (Fig. 2b).
Both ADC and T2 exhibited no further significant change from the second cycle of CHOPB to the fourth cycle of CHOPB, as indicated in Fig. 4. This suggests a growth arrest of the treated tumors corresponding to stable disease according to clinical response criteria, which is also observed in the tumor volume data in Fig. 1.
Histological examination
Figure 5 presents the H&E-stained slides of a control (a) and treated (b) tumor after four cycles of CHOPB. The cell densities of the control and treated tumors are (58±1.5)×103 and (31.2±12)×103 cells/mm2, respectively (P < 0.03). Several mitotic cells are present in control tumors (indicated by arrowheads) but are rarely observed in the treated tumor. The treated tumor displays more heterogeneity in cell density than the control tumor, which reflects the heterogeneity in DWI and T2WI of the treated tumors (Fig. 3). Tumor cell proliferation was assessed by immunohistochemical staining with Ki67 as shown in Fig. 5c,d. The blue spots represent nuclei of tumor cells counterstained with 4’,6-diamidino-2-phenylindole (DAPI); green spots designate overlay of the proliferative marker with a blue spot (i.e. proliferating nuclei). The densities of proliferative tumor cells in the control and treated tumors are (4.0±0.1)×103 and (1.5±0.4)×103 cells/mm2, respectively (P < 0.03), indicating a significant decrease in proliferation following treatment. The TUNEL-based histological images of cryosections of a control tumor and a CHOPB-treated tumor are presented in Fig. 5e,f in which DAPI-stained nuclei (blue) are overlaid on the FITC-stained apoptotic DNA fragmentation indicator (producing green coloration). A significantly higher density of apoptosis is observed in the treated tumors than in the control tumors [(6.9±2.3)×103 cells/mm2 vs (1.5±0.5)×103 cells/ mm2, respectively; P < 0.03].
Figure 5.
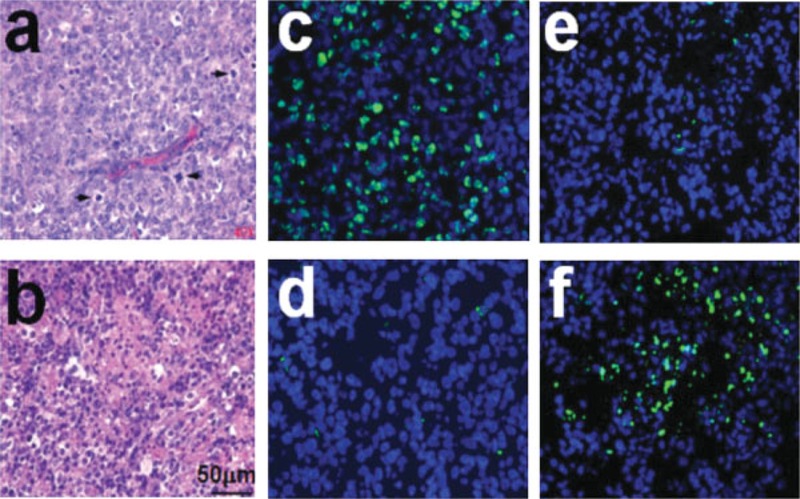
(a,b) H&E-stained micrographs of (a) a control tumor and (b) a CHOPB-treated tumor after four cycles of CHOPB. Arrows indicate mitotic cells. (c,d) Images of Ki67 immunochemical staining of cryosections of (c) a control tumor and (d) a CHOPB-treated tumor after four cycles of CHOPB. (e,f) Images of TUNEL assay of the cryosections of (e) a control tumor and (f) a CHOPB-treated tumor after four cycles of CHOPB. The blue spots in (c) and (d) represent DAPI-stained tumor cells; a green spot indicates an FITC-labeled proliferative tumor cell if it overlays a blue spot. In the TUNEL-treated cryosections (e and f), the blue spots represent DAPI-stained tumor cells; a green spot indicates an FITC-labeled apoptotic cell if it overlays a blue spot.
DISCUSSION
We have detected a significant increase in mean ADC and decrease in mean T2 of CHOPB-treated tumors (Fig. 4) that accompanied therapeutic response reflected in a ~40% decrease in tumor volume (Fig. 1). Differences in ADC primarily reflect differences in molecular translational movement of water molecules, which is limited by intermolecular interactions or by physical barriers such as cell membranes, whereas changes in T2 usually reflect changes in nuclear dipole–dipole interactions that depend primarily on rotational correlation times or electron–nuclear dipolar interactions associated with paramagnetic metals (e.g. release of iron or increase in paramagnetic deoxyhemoglobin). Usually, an increase in ADC is associated with an increase in T2 and has often been attributed to an increase in the extracellular volume fraction resulting from cell lysis (26). ADC and T2 reflect distributions of parameters over many different intracellular and extracellular compartments. Thus, any change in compartmentation of water may produce changes in these parameters in either direction. Yablonskiy et al. (39) have developed a statistical model to describe the multi-exponential behavior of the diffusion-attenuated MR signal from water in different cellular compartments (41). A bi-exponential model may be also required to better fit the T2-weighted MR signal of tumors (42). While the mechanism producing the therapy-associated increase in ADC and anomalous overall decrease in T2 (with some regions exhibiting the reverse effect) remains to be elucidated, the critical observation remains that these parameters provide sensitive indices for early detection and localization of therapeutic response in the tumor.
Low ADC in biological systems is believed to reflect reduced mean-squared displacement of water molecules due to high cell density and proliferation as well as cell swelling in the tissue (30). Malignant tumors generally possess higher cell proliferation than benign and normal tissues (43). Enhanced cell density and proliferation of malignant lesions restrain the motion of water molecules in a reduced extracellular space and, as a result, decrease the ADC during untreated tumor growth (28,30,44). On this basis, DWI may aid in differentiating malignant from benign or normal tissues and facilitate detection of therapeutic response (43,45). The treated tumors exhibited much lower cell density and cell proliferation as indicated by the H&E staining and immunochemical staining, respectively. Tumor proliferation of the treated tumors was diminished by the treatment. Therefore, the significant increase in ADC of the treated tumors may be associated with factors related to decreased cell proliferation and cell density. Lyng et al. (44) have reported that the ADC of human melanoma xenografts increased with decreased tumor cell density or increased necrotic fraction of tumors (46). The TUNEL assay detected higher levels of apoptosis in the treated tumors than in the control tumors as indicated in Fig. 5e,f. Apoptotic cells usually shrink, leading to increasing extracellular space during the cell death process (47). The consequent increase in extracellular space is likely to contribute to the increase in ADC of treated tumors.
Several studies have reported increased tumor ADC after treatment that occurred before changes in tumor volume were detected, suggesting that the changes in ADC could be an early indication of response (25,26). Our results show that the significant difference in ADC between the treated tumors and control group was detected as early as the time when significant differences in tumor volume were first measured. However, the significant changes in T2 of the treated tumors were observed after two cycles of CHOPB, a week after the significant change in ADC and tumor volume could be detected. This may be partially due to cancellation effect of positive and negative changes in T2.
Significantly elevated T2 values have been observed in malignant tumors (48,49). Although T2 values may not be diagnostic of malignancy, this parameter is useful as a measure of heterogeneity in tissue microenvironments within tumors (49). More micro-structural heterogeneity within tumors and/or a net decrease in tumor tissue water may lead to a decrease in the T2 value of tumors (50). Manton et al. (51) have reported that the overall T2 of tissue water decreased significantly in human patients with locally advanced breast tumors after two cycles of neo-adjuvant chemotherapy.
The heterogeneous response of different regions of the tumors detected by both DWI and T2WI may guide the treatment of the non-responsive regions by appropriate therapies that affect the regions of the tumor that do not respond to chemotherapy. For example, the heterogeneous response of the tumors may result from heterogeneity of tumor perfusion, with the non-responsive regions being more poorly perfused and therefore receiving lower doses of chemotherapy. This will have to be confirmed by overlaying a perfusion map [determined by dynamic contrast enhanced MRI or by imaging with a freely permeable perfusion marker such as (52)]. If this hypothesis is confirmed, one might treat the tumor with an appropriate agent to equalize perfusion throughout the tumor, e.g. mild hyperthermia (53), nicotinamide or carbogen (54). In this way, combining therapeutic response-sensitive methods such as DWI or T2WI with physiologically sensitive methods such as perfusion imaging or, in the case of radiation therapy, oxygen-sensitive probes may provide an effective method for image-guided therapy.
In conclusion, this study has assessed the utility of DWI and T2WI for detecting in vivo response to CHOPB chemotherapy of DLCL2 xenografts in severe combined immunodeficient mice. We have shown that DWI and T2WI can detect the therapeutic response of treated tumors after one or two cycles of CHOPB, respectively. In addition, DWI and T2WI delineate the spatial distribution of changes in T2 and ADC, respectively, within the tumors, thereby detecting the heterogeneity of tumor therapeutic response, which, in turn, may be used to guide multi-modal therapeutic approaches. This study shows that DWI has higher sensitivity in detecting early therapeutic response of NHL tumors than T2WI.
Acknowledgements
This study was supported by NIH grant R01-CA101700 (to J.D.G.). We thank Drs Ramzi Mohammed and Ayad Al-Katib for providing the WSU-DLCL2 cell line, and Dr Steven Schuster for instructive discussion of clinical and experimental issues related to NHL.
Contract/grant sponsor: NIH; contract/grant number: R01-CA101700.
Abbreviations used:
- ADC
apparent diffusion coefficient
- CHOPB
cyclophosphamide, hydroxydoxorubicin, Oncovin, prednisone, and bryostatin 1
- DAPI
4’,6-diamidino-2-phenylindole
- DLCL2
diffuse large B-cell lymphoma
- DWI
diffusion-weighted MRI
- FDG
[18F]fluorodeoxyglucose
- FITC
fluorescein isothiocyanate
- FWHM
full width at half maximum
- H&E
hematoxylin and eosin
- NHL
non-Hodgkin’s lymphoma
- PET
positron emission tomography
- T2WI
T2-weighted MRI
- TUNEL
terminal deoxynucleotidyl transferase-mediated dUTP nick end labeling
REFERENCES
- 1.Rogers BB. Overview of non-Hodgkin’s lymphoma. Semin Oncol Nurs 2006; 22: 67–72. [DOI] [PubMed] [Google Scholar]
- 2.American Cancer Society. Cancer Facts & Figures 2006 Atlanta, American Cancer Society: 2006. [Google Scholar]
- 3.Fisher R. Cyclophosphamide, doxorubicin, vincristine, and prednisone versus intensive chemotherapy in non-Hodgkin’s lymphoma. Cancer Chemother Pharmacol 1997; 40: S42–S46. [DOI] [PubMed] [Google Scholar]
- 4.Meignan M, Haioun C, Itti E, Rahmouni A, Reyes F. Value of [18F]fluorodeoxyglucose-positron emission tomography in managing patients with aggressive non-Hodgkin’s lymphoma. Clin Lymphoma Myeloma 2006; 6: 306–313. [DOI] [PubMed] [Google Scholar]
- 5.Schoder H, Noy A, Gonen M, Weng L, Green D, Erdi YE, Larson SM, Yeung HW. Intensity of 18fluorodeoxyglucose uptake in positron emission tomography distinguishes between indolent and aggressive non-Hodgkin’s lymphoma. J. Clin Oncol 2005; 23: 4643–4651. [DOI] [PubMed] [Google Scholar]
- 6.Glickson JD. Clinical NMR-spectroscopy of tumors: current status and future-directions. Invest Radiol 1989; 24: 1011–1016. [DOI] [PubMed] [Google Scholar]
- 7.Ng TC, Evanochko WT, Hiramoto RN, Ghanta VK, Lilly MB, Lawson AJ, Corbett TH, Durant JR, Glickson JD. P-31 NMR-spectroscopy of in vivo tumors. J. Magn Reson 1982; 49: 271–286. [Google Scholar]
- 8.Li SJ, Wehrle JP, Rajan SS, Steen RG, Glickson JD, Hilton J. Response of radiation-induced fibrosarcoma-1 in mice to cyclophosphamide monitored by in vivo P-31 nuclear magnetic resonance spectroscopy. Cancer Res 1988; 48: 4736–4742. [PubMed] [Google Scholar]
- 9.Wehrle JP, Li SJ, Rajan SS, Steen RG, Glickson JD. P-31 and H-1-NMR spectroscopy of tumors in vivo: untreated growth and response to chemotherapy. Ann N Y Acad Sci 1987; 508: 200–215. [DOI] [PubMed] [Google Scholar]
- 10.Braunschweiger PG, Kumar N, Constantinidis I, Wehrle JP, Glick-son JD, Johnson CS, Furmanski P. Potentiation of interleukin 1-Alpha mediated antitumor effects by ketoconazole. Cancer Res 1990; 50: 4709–4717. [PubMed] [Google Scholar]
- 11.Shungu DC, Bhujwalla ZM, Wehrle JP, Glickson JD. H-1-NMR spectroscopy of subcutaneous tumors in mice: preliminary studies of effects of growth, chemotherapy and blood-flow reduction. NMR Biomed 1992; 5: 296–302. [DOI] [PubMed] [Google Scholar]
- 12.Bhujwalla ZM, Glickson JD. Detection of tumor response to radiation therapy by in vivo proton MR spectroscopy. Int J Radiat Oncol Biol Phys 1996; 36: 635–639. [DOI] [PubMed] [Google Scholar]
- 13.Griffiths JR, Tate AR, Howe FA. Stubbs M as part of The Multi-Institutional Group on MRS Application to Cancer. Magnetic resonance spectroscopy of cancer: practicalities of multi-centre trials and early results in non-Hodgkin’s lymphoma. Eur J Cancer 2002; 38: 2085–2093. [DOI] [PubMed] [Google Scholar]
- 14.Zakian KL, Koutcher JA. Magnetic resonance spectroscopy and clinical cancer prognosis. Acad Radiol 2004; 11: 365–367. [DOI] [PubMed] [Google Scholar]
- 15.Sibtaina NA, Howe FA, Saunders DE. The clinical value of proton magnetic resonance spectroscopy in adult brain tumours. Clin Radiol 2007; 62: 109–119. [DOI] [PubMed] [Google Scholar]
- 16.He Q, Shungu DC, van Zijl PC, Bhujwalla ZM, Glickson JD. Single-scan in vivo lactate editing with complete lipid and water suppression by selective multiple-quantum-coherence transfer (Sel-MQC) with application to tumors. J. Magn Reson B 1995; 106: 203–211. [DOI] [PubMed] [Google Scholar]
- 17.Evanochko WT, Sakai TT, Ng TC, Krishna NR, Kim HD, Zeidler RB, Ghanta VK, Brockman RW, Schiffer LM, Braunschweiger PG, Glickson JD. NMR-study of in vivo Rif-1 tumors: analysis of perchloric-acid extracts and identification of H-1-resonances, P-31-resonances and C-13-resonances. Biochim Biophys Acta 1984; 805: 104–116. [DOI] [PubMed] [Google Scholar]
- 18.Evelhoch JL, Sapareto SA, Nussbaum GH, Ackerman JJH. Correlations between P-31 NMR-spectroscopy and O-15 perfusion measurements in the Rif-1 murine tumor in vivo. Radiat Res 1986; 106: 122–131. [PubMed] [Google Scholar]
- 19.Negendank WG, Padavicshaller KA, Li CW, Murphy-Boesch J, Stoyanova R, Krigel RL, Schilder RJ, Smith MR, Brown TR. Metabolic characterization of human non-Hodgkins-lymphomas in-vivo with the use of proton-decoupled phosphorus magnetic resonance spectroscopy. Cancer Res 1995; 55: 3286–3294. [PubMed] [Google Scholar]
- 20.McPhail LD, Chung Y-L, Madhu B, Clark S, Griffiths JR, Kelland LR, Robinson SP. Tumor dose response to the vascular disrupting agent, 5,6-dimethylxanthenone-4-acetic acid, using in vivo magnetic resonance spectroscopy. Clin Cancer Res 2005; 11: 3705–3713. [DOI] [PubMed] [Google Scholar]
- 21.Arias-Mendoza F, Smith MR, Brown TR. Predicting treatment response in non-Hodgkin’s lymphoma from the pretreatment tumor content of phosphoethanolamine plus phosphocholine. Acad Radiol 2004; 11: 368–376. [DOI] [PubMed] [Google Scholar]
- 22.Bourne RM, Stanwell P, Stretch JR, Scolyer RA, Thompson JF, Mountford CE, Lean CL. In vivo and ex vivo proton MR spectroscopy of primary and secondary melanoma. Eur J Radiol 2005; 53: 506–513. [DOI] [PubMed] [Google Scholar]
- 23.Le Bihan D Molecular diffusion, tissue microdynamics and microstructure. NMR Biomed 1995; 8: 375–386. [DOI] [PubMed] [Google Scholar]
- 24.Barboriak DP. Imaging of brain tumors with diffusion-weighted and diffusion tensor MR imaging. Magn Reson Imaging Clin North America 2003; 11: 379–401. [DOI] [PubMed] [Google Scholar]
- 25.Chenevert TLMP, Ross BD. Monitoring early response of experimental brain tumors to therapy using diffusion magnetic resonance imaging. Clin Cancer Res 1997; 3: 1457–1466. [PubMed] [Google Scholar]
- 26.Poptani H, Puumalainen A, Grohn O, Loimas S, Kainulainen R, Yla-Herttuala S, Kauppinen R. Monitoring thymidine kinase and ganciclovir-induced changes in rat malignant glioma in vivo by nuclear magnetic resonance imaging. Cancer Gene Therapy 1998; 5: 101–119. [PubMed] [Google Scholar]
- 27.Naganawa S, Sato C, Nakamura T, Kumada H, Ishigaki T, Miura S, Maruyama K, Takizawa O. Diffusion-weighted images of the liver: comparison of tumor detection before and after contrast enhancement with superparamagnetic iron oxide. J. Magn Reson Imaging 2005; 21: 836–840. [DOI] [PubMed] [Google Scholar]
- 28.Woodhams R, Matsunaga K, Kan S, Hata H, Ozaki M, Iwabuchi K, Kuranami M, Watanabe M, Hayakawa K. ADC mapping of benign and malignant breast tumors. Magn Reson Med Sci 2005; 4: 35–42. [DOI] [PubMed] [Google Scholar]
- 29.Kuroki Y, Nasu K, Kuroki S, Murakami K, Hayashi T, Sekiguchi R, Nawano S. Diffusion-weighted imaging of breast cancer with the sensitivity encoding technique: analysis of the apparent diffusion coefficient value. Magn Reson Med Sci 2004; 3: 79–85. [DOI] [PubMed] [Google Scholar]
- 30.Pickles MD, Gibbs P, Sreenivas M, Turnbull LW. Diffusion-weighted imaging of normal and malignant prostate tissue at 3.0T. J. Magn Reson Imaging 2006; 23: 130–134. [DOI] [PubMed] [Google Scholar]
- 31.Minematsu K, Li L, Fisher M, Sotak CH, Davis MA, Fiandaca MS. Diffusion-weighted magnetic resonance imaging: rapid and quantitative detection of focal brain ischemia. Neurology 1992; 42: 235–240. [DOI] [PubMed] [Google Scholar]
- 32.Charles-Edwards EM, deSouza NM. Diffusion-weighted magnetic resonance imaging and its application to cancer. Cancer Imaging 2006; 6: 135–143. [DOI] [PMC free article] [PubMed] [Google Scholar]
- 33.Stanisz GJ, Odrobina EE, Pun J, Escaravage M, Graham SJ, Bronskill MJ, Henkelman RM. T1, T2 relaxation and magnetization transfer in tissue at 3T. Magn Reson Med 2005; 54: 507–512. [DOI] [PubMed] [Google Scholar]
- 34.Gambarota G, Veltien A, van Laarhoven H, Philippens M, Jonker A, Mook OR, Frederiks WM, Heerschap A. Measurements of T1 and T2 relaxation times of colon cancer metastases in rat liver at 7 T. MAGMA 2004; 17: 281–287. [DOI] [PubMed] [Google Scholar]
- 35.Mohammad RM, Wall NR, Dutcher JA, Al-Katib AM. The addition of Bryostatin 1 to cyclophosphamide, doxorubicin, vincristine, and prednisone (CHOP) chemotherapy improves response in a CHOP-resistant Human diffuse large cell lymphoma xenograft model. Clin Cancer Res 2000; 6: 4950–4956. [PubMed] [Google Scholar]
- 36.Al-Katib AM, Smith MR, Kamanda WS, Pettit GR, Hamdan M, Mohamed AN, Chelladurai B, Mohammad RM. Bryostatin 1 down-regulates mdr1 and potentiates vincristine cytotoxicity in diffuse large cell lymphoma xenografts. Clin Cancer Res 1998; 4: 1305–1314. [PubMed] [Google Scholar]
- 37.Mohammad RM, Mohamed AN, KuKuruga M, Smith MR, Al-Katib A. A human B-cell lymphoma line with a de novo multidrug resistance phenotype. Cancer 1992; 69: 1468–1474. [DOI] [PubMed] [Google Scholar]
- 38.Huang MQ, Nelson DS, Pickup S, Qiao H, Delikatny EJ, Poptani H, Glickson JD. In vivo monitoring response to chemotherapy of human diffuse large B-Cell lymphoma xenografts in SCID mice by H-1 and P-31 MRS. Academic Radiology December 2007; 14(12): 1531–1539. [DOI] [PMC free article] [PubMed] [Google Scholar]
- 39.Lee SC, Huang MQ, Nelson DS, Pickup S, Wehrli S, Adegbola O, Poptani H, Delikatny EJ, Glickson JD. In vivo MRS markers of response to CHOP chemotherapy in the WSU-DLCL2 human diffuse large B-cell lymphoma xenograft. NMR Biomed April 3: 2008; in press. [DOI] [PubMed]
- 40.Mori S, van Zijl PCM. Diffusion weighting by the trace of the diffusion tensor within a single scan. Magn Reson Med 1995; 33: 41–52. [DOI] [PubMed] [Google Scholar]
- 41.Yablonskiy DA, Bretthorst GL, Ackerman JJ. Statistical model for diffusion attenuated MR signal. Magnetic Resonance in Medicine 2003; 50(4): 664–669. [DOI] [PMC free article] [PubMed] [Google Scholar]
- 42.Ababneh Z, Beloeil H, Berde CB, Gambarota G, Maier SE, Mulkern RV. Biexponential parameterization of diffusion and T2 relaxation decay curves in a rat muscle edema model: decay curve components and water compartments. Magn Reson Med 2005; 54(3): 524–531. [DOI] [PubMed] [Google Scholar]
- 43.Rubesova E, Grell A-S, Maertelaer VD, Metens T, Chao S-L, Lemort M. Quantitative diffusion imaging in breast cancer: A clinical prospective study. J. Magn Reson Imaging 2006; 24: 319–324. [DOI] [PubMed] [Google Scholar]
- 44.Field AS, Alexander AL. Diffusion tensor imaging in cerebral tumor diagnosis and therapy. Topics in Magn Reson Imaging 2004; 15(5): 315–324. [DOI] [PubMed] [Google Scholar]
- 45.Lee KC, Moffat BA, Schott AF, Layman R, Ellingworth S, Juliar R, Khan AP, Helvie M, Meyer CR, Chenevert TL, Rehemtulla A, Ross BD. Prospective early response imaging biomarker for neoadjuvant breast cancer chemotherapy. Clin Cancer Res 2007; 13: 443–450. [DOI] [PubMed] [Google Scholar]
- 46.Lyng H, Haraldseth O, Rofstad EK. Measurement of cell density and necrotic fraction in human melanoma xenografts by diffusion weighted magnetic resonance imaging. Magn Reson Med 2000; 43: 828–836. [DOI] [PubMed] [Google Scholar]
- 47.Valonen PK, Lehtimäki KK, Väisänen TH, Kettunen MI, Grö hn OHJ, Ylä-Herttuala S, Kauppinen RA. Water diffusion in a rat glioma during ganciclovir-thymidine kinase gene therapy-induced programmed cell death in vivo: Correlation with cell density. J Magn Reson Imaging 2004; 19: 389–396. [DOI] [PubMed] [Google Scholar]
- 48.Gauvain KM, Garbow JR, Song S-K, Hirbe AC, Weilbaecher K. MRI detection of early bone metastases in B16 mouse melanoma models. Clin Exp Metastasis 2005; 22(5): 403–411. [DOI] [PMC free article] [PubMed] [Google Scholar]
- 49.McKenna WG, Lenkinski RE, Hendrix RA, Vogele KE, Bloch P. The use of magnetic resonance imaging and spectroscopy in the assessment of patients with head and neck and other superficial human malignancies. Cancer 1989; 64: 2069–2075. [DOI] [PubMed] [Google Scholar]
- 50.Zhao F, Kuroiwa T, Miyasaka N, Nagaoka T, Nakane M, Tamura A, Mizusawa H. Ultrastructural and MRI study of the substantia nigra evolving exofocal post-ischemic neuronal death in the rat. Neuropathology 2002; 22(3): 91–105. [DOI] [PubMed] [Google Scholar]
- 51.Manton DJ, Chaturvedi A, Hubbard A, Lind MJ, Lowry M, Maraveyas A, Pickles MD, Tozer DJ, Turnbull LW. Neoadjuvant chemotherapy in breast cancer: early response prediction with quantitative MR imaging and spectroscopy. Br J Cancer 2006; 94: 427–435. [DOI] [PMC free article] [PubMed] [Google Scholar]
- 52.Charagundla SR, Duvvuri U, Noyszewski EA, Dandora R, Stolpen AH, Leigh JS, Reddy R. 17O-decoupled (1)H spectroscopy and imaging with a surface coil: STEAM decoupling. J. Magn Reson 2000; 143(1): 39–44. [DOI] [PubMed] [Google Scholar]
- 53.Issels RD, Schlemmer M, Lindner LH. The role of hyperthermia in combined treatment in the management of soft tissue sarcoma. Curr Oncol Rep 2006; 8(4): 305–309. [DOI] [PubMed] [Google Scholar]
- 54.Fenton BM, Lord EM, Paoni SF. Enhancement of tumor perfusion and oxygenation by carbogen and nicotinamide during single-and multifraction irradiation. Radiat Res 2000; 153: 75–83. [DOI] [PubMed] [Google Scholar]