Summary
In photosynthesis models following the Farquhar formulation, the maximum carboxylation rate V cmax is the key parameter. Remote‐sensing indicators, such as reflectance ρ and Chl fluorescence (ChlF), have been proven as valuable estimators of photosynthetic capacity and can be used as a constraint to V cmax estimation.
We present a methodology to retrieve V cmax from leaf ρ and ChlF by coupling a radiative transfer model, fluspect, to a model for photosynthesis. We test its performance against a unique dataset, with combined leaf spectral, gas exchange and pulse‐amplitude‐modulated measurements.
Our results show that the method can estimate the magnitude of V cmax estimated from the far‐red peak of ChlF and green ρ or transmittance τ, with values of root‐mean‐square error below 10 μmol CO 2 m−2 s−1.
At the leaf level, the method could be used for detection of plant stress and tested against more extensive datasets. With a similar scheme devised for the higher spatial scales, such models could provide a comprehensive method to estimate the actual photosynthetic capacity of vegetation.
Keywords: fluspect, leaf Chl fluorescence, photosynthesis, reflectance, Soil–Canopy Observation of Photosynthesis and Energy balance (SCOPE), Vcmax
Introduction
Monitoring photosynthesis through remote‐sensed signals leads to a better understanding of vegetation canopies and their interaction with the environment. At least two optical indicators have been shown to respond to photosynthetic processes dynamically: Chl fluorescence (ChlF) and photochemical reflectance index (PRI). Both ChlF and PRI are intrinsically linked to photosynthesis, and have both been established as good estimators of leaf light use efficiency (LUE) and photosynthesis (for reviews, see Garbulsky et al., 2011; Ač et al., 2015). Developing methods for the estimation of photosynthesis from the two optical indicators is particularly relevant for the fast‐developing field of precision agriculture (Tremblay et al., 2011; Wieneke et al., 2016), and for the European Space Agency's dedicated Fluorescence Explorer (FLEX) satellite mission (Drusch et al., 2017).
In order to develop such methods, it is key to understand how the enzyme kinetics of photosynthesis are reflected in the dynamic changes of plant optical properties. The solar energy, absorbed by the leaf, undergoes one of three possible pathways: it can be used in photochemistry, emitted as ChlF, or dissipated as heat. This conversion of energy can be detected as a dynamic optical signature in the visible and near‐infrared part of the leaf spectrum.
The light is captured by the light‐harvesting antennae, and the energy is transferred to the photosynthetic reaction centres. From the captured light, c. 2% of light is directly emitted as ChlF. The spectrum of ChlF has a typical double peak, and ranges from c. 650 to 850 nm. The rest of the captured energy follows a complex process of photochemistry, eventually resulting in the fixation of CO2.
However, in natural conditions, plants are often exposed to various stresses that lower their capacity to utilize the available light. Excess energy must then be effectively dissipated via one of the many photoprotective mechanisms of higher plants in order to prevent damage to the photosynthetic apparatus. For example, high light exposure causes rapid saturation of the photosynthetic reaction centres, and the fastest response of the photosynthetic membrane to excess light is to dissipate the surplus of energy as heat. This process is known as the nonphotochemical ChlF quenching (NPQ). It is closely related to the xanthophyll cycle, which involves an interconversion of three xanthophylls: violaxanthin via antheraxanthin into zeaxanthin, followed by a complex series of thylakoid conformational and pH changes, concluding with heat dissipation (Demmig‐Adams & Adams, 1996; Ruban, 2016). These photoprotective mechanisms can be observed as dynamic changes in the green part of the visible spectrum, commonly expressed as the PRI (Gamon et al., 1992).
In order to interpret the remotely sensed data, models are needed. Simple indices using only one or two spectral bands, such as PRI, may be insufficient due to the contributions of various leaf pigments and canopy structure to the few selected spectral bands (Gitelson et al., 2017). Radiative transfer (RT) models can describe the light propagation within leaves and canopies based on biochemical and physical properties, enabling us to better decouple the contributions of individual parameters. Complementary to RT models, models for photosynthesis can explain the underlying biochemical processes. Coupling the two types of models would provide a unique insight into the connection between optical and biochemical properties of vegetation.
State‐of‐the‐art models, such as the Soil–Canopy Observation of Photosynthesis and Energy balance (SCOPE) model (Van der Tol et al., 2009), are able to quantify both the variability of photosynthesis and spectral changes at different temporal and spatial scales by employing the biochemical and RT properties of vegetation.
At the leaf level, SCOPE employs two models: a biochemical model, able to explain the relationship between ChlF, photosynthesis and NPQ under different environmental conditions (Van der Tol et al., 2014); and an RT model, fluspect (Vilfan et al., 2016). Both of the models are well tested, computationally affordable, and can function separately, providing independent outputs.
The biochemical model follows Farquhar's 1980s photosynthesis formulation (Farquhar et al., 1980), in which the maximum carboxylation rate V cmax of leaves is a key parameter. V cmax determines the maximum photosynthesis rate of a plant under optimal conditions, and it has a great influence on the modelled photosynthesis.
fluspect simulates leaf reflectance ρ, transmittance τ, and ChlF spectra as a function of leaf pigment content and structure. Recently, fluspect has been extended to simulate the dynamics of green ρ as a function of the xanthophyll de‐epoxidation, an RT analogy to the PRI (Vilfan et al., 2018).
In this study, we couple the two leaf models via ChlF and photochemical ρ parameters, and effectively link spectral to biochemical properties. Attempts to create such links have been made before; however, in most cases, PRI and ChlF as proxies of photosynthesis were studied separately (for a review, see Grace et al., 2007), with a few exceptions (Cheng et al., 2013; Atherton et al., 2016). The link of ρ dynamics to photochemistry is generally addressed with the use of the PRI, and relations of spectral information to photosynthetic parameters have mostly been defined via regression models (Cheng et al., 2013; Serbin et al., 2015; Zhang et al., 2016; Dechant et al., 2017; Liu et al., 2017). With the introduction of dynamic xanthophyll ρ into fluspect, we could avoid the use of PRI and approach changes in both ρ and ChlF in an RT‐based manner. We developed a scheme that links leaf V cmax to ρ, τ and ChlF. Such a model has not been published before.
The coupled model enabled us to devise a method for the retrieval of the V cmax from hyperspectral measurements of leaf ChlF and ρ or τ. In this study, we describe the coupled model and the retrieval method. We test its performance against a unique dataset, with combined leaf spectral, gas exchange and pulse‐amplitude‐modulated (PAM) measurements. We evaluate the sensitivity of the method to ChlF and ρ, and we discuss whether combined they provide an even better constraint to the retrieval of leaf photosynthetic parameters.
Materials and Methods
Laboratory experiment
The experiment was conducted in the laboratories of Forschungszentrum Jülich in February and March 2014. Sugar beet (Beta vulgaris L.) and barley (Hordeum vulgare L.) plants were grown in pots under controlled conditions in a glasshouse in Forschungszentrum Jülich between December 2013 and March 2014. Owing to the limited winter light conditions, the natural light was complemented with artificial light from growth lamps for 15 h d−1. The plants used in this experiment were grown under a light intensity of c. 1000 μmol m−2 s−1 (measured with a quantum sensor, LI‐190SL; Li‐Cor Inc., Lincoln, NE, USA). When the plants were fully grown, some of the pots grown under full light were exposed to water deficits. For a full description of growth conditions, see Vilfan et al. (2016). Measurements were collected on the same leaves in two separate experimental settings.
The first set‐up, ‘Chamber dataset’, is presented in Fig. 1. It consisted of a portable gas‐exchange system (LI‐6400; Li‐Cor Inc.) connected to a (1) clear top MiniPAM Adapter (6400‐10; Li‐Cor Inc.) housing the pulse‐amplitude‐modulated fluorescence system (Mini‐PAM‐II; Heinz Walz GmbH, Effeltrich, Germany); and (2) a spectroradiometer (FieldSpec 4; Analytical Spectral Devices, Boulder, CO, USA; 350–2500 nm, 3 nm visible and near‐infrared spectral resolution). The gas‐exchange chamber bottom was equipped with an airtight slot, fitting an optical fibre of the spectroradiometer. The top could not be adjusted to house the optical fibre due to technical limitations. The chamber was illuminated externally with a cold halogen lamp (KL 2500 LCD; Schott Benelux BV, Culemborg, Netherlands). The lamp was positioned to illuminate the chamber under an angle of c. 15°, ensuring that the whole leaf surface within the chamber was illuminated and not shaded by the PAM optical fibre. A short‐pass filter can be slotted into the opening of the lamp, which cuts off the incoming light spectrum above c. 700 nm. This allowed for measurements of forward ChlF signal (‘forward’ referring to the emission being in same direction as the excitation radiation, which means in our set‐up the ChlF emanating from the abaxial side of the leaf turned away from the light source above the leaf) from c. 700 to 850 nm. With this set‐up, almost simultaneous measurements of passive and active ChlF, τ, and gas‐exchange measurements were taken under controlled conditions.
Figure 1.
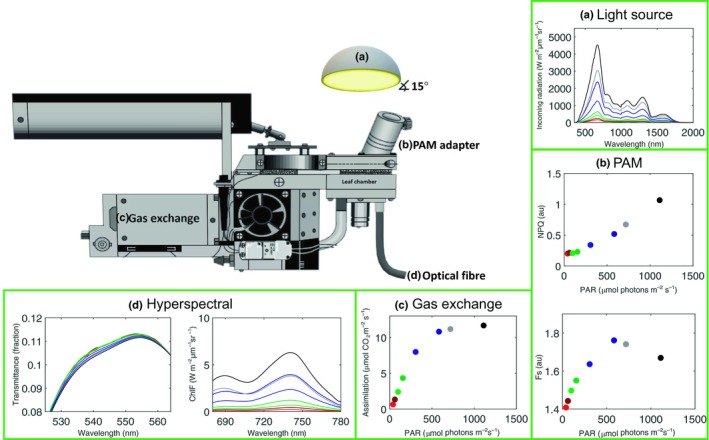
A schematic representation of the ‘chamber dataset’ measurement set‐up for a representative case of light‐response curves of a barley leaf. Samples were illuminated with a cold blue light source (a). The following measurements were taken: (b) pulse amplitude modulation (PAM) fluorometry (nonphotochemical quenching (NPQ), steady state fluorescence F s, and photochemically active radiation (PAR) are shown); (c) gas exchange (assimilation rate); and (d) spectral measurements (Chl fluorescence and transmittance). A red cut‐off filter was slotted between the light source and the sample (not shown). Gas‐exchange image used and modified by permission of Li‐Cor Biosciences.
Measurements were taken on attached leaves of intact plants using one or two healthy and fully developed leaves per pot. The leaf was positioned in the chamber with its adaxial side facing the light source. The gas‐exchange system was set to a constant leaf temperature of 25°C, constant air humidity, and a CO2 concentration of 400 ppm. We measured both light and CO2 curves for each leaf. Per each leaf, the light curve was measured first, directly followed by the measurement of the CO2 curve, under illumination of 1000 μmol m−2 s−1. The measured leaf surface and the position of the set‐up were kept constant. Light intensities and CO2 concentrations were adjusted manually in the following sequences of approximately:
0, 50, 100, 150, 250, 350, 500, 700, 1000, 1300 μmol m−2 s−1,
400, 50, 100, 150, 250, 350, 500, 700, 900, 1200, 700, 400 ppm CO2.
Each measurement consisted of the following sequence of recordings: gas exchange, followed by the transmitted radiance recorded with the spectroradiometer, the filtered transmitted radiance recorded with the spectroradiometer after slotting the filter into the opening of the lamp, and the active PAM measurement at the top of the leaf after removing the filter. The procedure was repeated for each change of either illumination or CO2 conditions. Before each recording, we waited for the gas‐exchange conditions to stabilize, 5 min on average, and up to 20 min for a change in the illumination conditions.
A standard reflectance panel (Spectralon; Labsphere, North Sutton, NH, USA) was used separately to estimate the incident and the filtered incident radiation of the lamp and the exact transmittance of the filter for each light intensity. The panel was positioned at the same distance from the light source as the leaf.
Each radiance measurement was the average of five individual measurements over the region of 350–2500 nm, using a 136 ms integration time. Transmittance and forward ChlF spectra were calculated using the standard formulas as described in Vilfan et al. (2016). It should be noted that the measurements of filtered radiance below 700 nm (and consequentially the red peak of ChlF) are unreliable due to the cut‐off filter's characteristics. Moreover, the relative positioning of the reflectance panel, as well as the shape and characteristics of the gas‐exchange chamber, might have contributed to additional scattering and inaccuracies in the calculated ChlF spectra. Furthermore, many hyperspectral measurements of barley had to be excluded from the study because the leaves were too small to cover the surface of the entire leaf chamber, contaminating the measurements with additional illumination.
LUE was calculated from gas‐exchange data as:
| (Eqn 1) |
where A (μmol CO2 m−2 s−1) is the assimilation rate and iPAR the incoming photosynthetically active radiation (PAR; μmol m−2 s−1) (Peñuelas et al., 1995; Barton & North, 2001; Gitelson et al., 2015).
From τ, we calculated the PRI as (R 531 − R 570)/(R 531 + R 570). For a better comparison of the spectral measurements of different leaves, we normalized both the PRI and ChlF at the far‐red peak (F 740) to their respective unstressed reference values (PRI′ and ). By subtracting PRI′ from all values of PRI and ) from F 740, we obtained ΔPRI and ΔF 740, respectively. For the light responses, PRI′ and ) were obtained from the spectrum measured at the lowest illumination (50 μmol m−2 s−1), and for CO2 curves from the spectrum measured at 1200 ppm CO2.
For PAM measurements, standard procedures were followed (instruction manual for MINI‐PAM‐II; Maxwell & Johnson, 2000). During each measurement, a short, intense pulse of light was given, from which the quantum yield of photosystem II (PS‐II) ΦPSII and electron transport rate (ETR) were calculated. ETR is automatically calculated by the accompanying software of the instrument, assuming an absorption coefficient of 0.84. ΦPSII reflects the proportion of light absorbed by PS‐II that is used for photochemistry and was calculated as:
| (Eqn 2) |
where F s is the steady state ChlF and is light‐adapted maximum ChlF yield.
In the early morning, before the start of the measurement setup, PAM measurements were taken on dark‐adapted leaves. This allowed for the calculation of minimal and maximal dark‐adapted ChlF, F o and F m, respectively, and subsequently the NPQ:
| (Eqn 3) |
where F m represents the maximal dark‐adapted ChlF yield. Because the information of PAM experiments is contained in the ratios, we normalized the signals to F o. Since ETR, ΦPSII and NPQ are also outputs of the photosynthesis model, these measurements provided important additional insights into the model.
The second set‐up, the ‘FluoWat dataset’, is described in detail in Vilfan et al. (2016). Measurements of bidirectional leaf ρ, τ, and ChlF were collected with the FluoWat leaf‐clip, coupled to the same spectroradiometer that was used in the first set‐up. The leaf clip has two openings for the fibre optics and one light entrance, fitting both a light source at a 45° angle and a short‐pass filter (< 650 nm, TechSpec; Edmund Optics GmbH, Mainz, Germany). For more details on the FluoWat leaf clip design, see Van Wittenberghe et al. (2013). The samples were illuminated with the same cold light lamp as in the first set‐up. We used measurements taken under three different light intensities, with iPAR of c. 200, 500 and 700–800 μmol m−2 s−1.
Leaf models in SCOPE
fluspect
fluspect is an RT model for the leaf, based on the model prospect (Jacquemoud & Baret, 1990), where the absorption is a function of the concentrations and specific absorption coefficients (SACs) of pigments and water. fluspect computes ρ and τ spectra from 400 to 2500 nm, as well as ChlF spectra from 640 to 850 nm. It is implemented in matlab and published under GNU General Public License at https://github.com/christiaanvandertol. Input parameters, together with their definitions and standard values, are provided in Table 1. For a published full description of the model (fluspect‐B), see Vilfan et al. (2016).
Table 1.
List of parameters for the SCOPE leaf models
| Parameter | Interpretation | Range | Standard value | Unit | Origin | |
|---|---|---|---|---|---|---|
| Leaf optical: fluspect | ||||||
| C ab | Chlorophyll a + b content | 0–100 | 40 | μg cm−2 | prospect‐D | |
| C car | Total carotenoid content | 0–30 | 10 | μg cm−2 | prospect‐D | |
| C ant | Anthocyanin content | 0–10 | 0 | μg cm−2 | prospect‐D | |
| C w | Water content | 0–0.4 | 0.009 | cm | prospect | |
| C dm | Dry matter content | 0–0.5 | 0.012 | g cm−2 | prospect | |
| N | Leaf mesophyll structure parameter | 1–4 | 1.4 | — | prospect | |
| C s | Senescence material (brown pigments) | 0–0.6 | 0 | arbitrary units | prospect | |
| η | Fluorescence quantum efficiency | 0–0.2 | 0.01 | — | fluspect | |
| C x | Photochemical reflectance parameter | 0–1.5 | 0 | — | fluspect | |
| Leaf physiology: biochemical | ||||||
| V cmax | Maximum carboxylation capacity | 0–250 | 70 | μmol CO2 m−2 s−1 | ||
| m | Ball–Berry stomatal conductance param. | 2–20 | 8 | — | ||
| Rdparam | Parameter for dark respiration | 0.001–0.03 | 0.015 | — | ||
|
|
Fitting parameter for K n (Eqn 4) | 2–6 | 2.48 | — | ||
| β | Fitting parameter for K n (Eqn 4) | 0–10 | 0.114 | — | ||
| γ | Fitting parameter for K n (Eqn 4) | 0–10 | 2.83 | — | ||
In this study, we use the latest version of fluspect, called fluspect‐CX (Vilfan et al., 2018), which is able to simulate changes in green ρ from c. 500 to 570 nm, as a function of the xanthophyll de‐epoxidation parameter C x, an RT analogy to the PRI. Moreover, in fluspect‐CX we adopted the SAC for anthocyanins as well as recalibrated SACs for chlorophylls and carotenoids from prospect‐D (Féret et al., 2017).
Changes in ChlF spectra can be simulated by varying η I and η II: the fluorescence quantum efficiency parameters for PS‐I and PS‐II, respectively. In analogy to SACs, fluspect uses two spectra for the probability density function φ to describe the spectral distribution of emitted ChlF: φ I and φ II, one for each of the PS‐I and PS‐II. The two functions were adopted from Franck et al. (2002) and can be linearly mixed. However, owing to systematic discrepancies between measured and simulated ChlF spectra, φ has recently been recalibrated into a single spectrum for φ, with a single fluorescence quantum efficiency parameter η (C. Van der Tol et al., unpublished), used in this study.
fluspect can be inverted and its parameters estimated from measured spectra. However, fluspect cannot explain the underlying processes of photosynthesis related to the dynamic parameters, such as C x and η. They can, however, be estimated indirectly with the biochemical model that describes the relationship between ChlF, photosynthesis, and NPQ.
The biochemical model
The biochemical model used in SCOPE simulates the photosynthetic rate and fluorescence quantities as measured with PAM, as a function of absorbed light, leaf temperature, relative humidity and the concentrations of CO2 and oxygen (O2). It follows Farquhar's formulation (Farquhar et al., 1980), where the assimilation of CO2 depends on electron transport and carboxylation, and the actual rate of assimilation is determined by the most limiting of these processes. Maximum carboxylation rate per leaf area under light‐saturated conditions V cmax is the key parameter in this model. Input parameters of the biochemical model are provided in Table 1. Only parameters relevant for this study are shown.
We used the empirical relationship between photochemical and fluorescence yield for unstressed conditions described in Van der Tol et al. (2014), a nonlinear relationship between the relative light saturation of photosynthesis and nonradiative energy dissipation in plants of different species calibrated to active ChlF measurements. To calculate the probability of the different fates of the excitation energy, it uses rate coefficients K: K p and K n for the photochemical ChlF quenching (PQ) and NPQ, respectively, and K d and K f for heat dissipation and fluorescence, respectively.
Two outputs are particularly relevant for this study: the fluorescence emission efficiency ε, expressed as the ratio of the steady state F s to the dark‐adapted fluorescence yield F o; and K n, which is considered to be equivalent to NPQ, and is calculated as follows:
| (Eqn 4) |
where , γ and β are fitting parameters, and x is a measure for the light saturation of photosynthesis, calculated as:
| (Eqn 5) |
and represent the photochemical yield and the photochemical yield of dark‐adapted state, respectively.
Dark‐adapted fluorescence yield is then computed as:
| (Eqn 6) |
and the steady state fluorescence as:
| (Eqn 7) |
Here, it should be noted that F s, and consequently ε, are related to K n through the calculation of :
| (Eqn 8) |
Coupling the leaf models
fluspect and the biochemical model have parameters related to photosynthesis in common, and this makes it possible to retrieve photosynthesis from the measured spectra of ChlF and τ. The two dynamic input parameters of fluspect, η (the emission efficiency of fluorescence) and C x (the absorption SAC for the xanthophyll cycle dynamics) are related to the outputs ε (F s/F o) and K n (the rate coefficient for NPQ) of the biochemical model, and the simplest possible relation is a linear one.
To couple C x to K n, we adopt the relation of Vilfan et al. (2018):
| (Eqn 9) |
Similarly, η and ε are coupled as:
| (Eqn 10) |
where ς is a scaling factor, calculated as a ratio of a typical value of η to a typical value of ε, with a value of 0.007, which represents the quantum efficiency of fluorescence in a dark‐adapted leaf. This scaling is necessary because ɛ = F s/F o is a relative value, whereas η is an absolute emission efficiency.
Retrieving maximum carboxylation capacity
V cmax was retrieved in three ways, notably using gas exchange (method 1), PAM data (method 2), and hyperspectral measurements (method 3). Each method was applied to both the CO2 and the light response curves, resulting in six sets of values for V cmax. Method 1 (gas exchange) is the traditional way of retrieving V cmax; therefore, we used the values retrieved with this method to validate the other two methods. Fig. 2 provides an overview of these methods, Table 1 default parameters of the biochemical model, and Table 2 presents the retrieved parameters, their boundaries and constraints.
Figure 2.
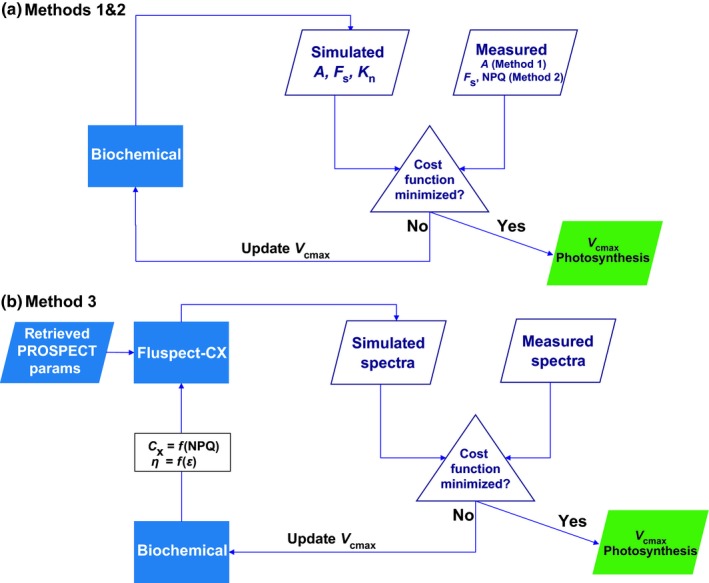
The schematics for three methods of V cmax retrieval. (a) In methods 1 and 2, the biochemical model is inverted by constraining the inversion with either the assimilation rate A curves (method 1) or with nonphotochemical quenching (NPQ) and steady‐state fluorescence F s curves (method 2). (b) In method 3, the combined model is inverted. First, the prospect parameters (see Table 1) are retrieved once per leaf. Next, the biochemical model is initialized with standard input values. Parameters for photochemical reflectance C x and fluorescence quantum efficiency η are prescribed as functions of NPQ and fluorescence emission efficiency ε, following Eqns 9 and 10, respectively. C x and η, together with the estimated prospect parameters, are provided as inputs of fluspect. The difference between the fluspect simulation and measured spectra is minimized by a cost function, resulting in the optimization of the chosen parameters.
Table 2.
List of retrieved parameters, their initial values, lower boundaries (LB), upper boundaries (UB) and constraints per each investigated method
| Method | Retrieved parameter | Unit | Initial value | LB | UB | Constraint |
|---|---|---|---|---|---|---|
| 1 | V cmax | μmol CO2 m−2 s−1 | 70 | 0 | 250 | Assimilation rate curves |
| 2 | V cmax | μmol CO2 m−2 s−1 | 70 | 0 | 250 | |
|
|
— | 2.48 | 2 | 6 | F s and NPQ curves | |
| β | — | 0.114 | 0 | 100 | ||
| γ | — | 2.83 | 0 | 100 | ||
| 3 | V cmax | μmol CO2 m−2 s−1 | 70 | 0 | 250 | ChlF and R or T spectra |
|
|
— | 2.48 | 2 | 6 | ||
| ς | — | 0.007 | 0 | 0.2 |
ChlF, Chl fluorescence; F s, steady state fluorescence; R, reflectance; T, transmittance; NPQ, nonphotochemical quenching. For a full description of parameters, see Table 1.
For method 1, we retrieved V cmax by inverting the biochemical model only, by minimizing the squared difference between measured and simulated assimilation rates A, following Kosugi & Matsuo (2006), Walker et al. (2014), and Zheng et al. (2017). Measured values of PAR, leaf temperature, CO2 and water vapour were used to force the model.
In method 2, we minimized the quadratic difference between modelled and (PAM) measured F s and NPQ (Fig. 2a). In order to achieve an accurate fit of measured vs modelled F s and NPQ, we fitted not only V cmax but also the three empirical parameters of Van der Tol et al. (2014) for NPQ, notably , γ and β (Eqn 4). With this method we could test the potential of using steady‐state ChlF and NPQ data to retrieve photosynthesis from the biochemical model, in the absence of the informative measurements with the saturating flashes F m and ).
In method 3, we used only the spectroscopy measurements to retrieve V cmax, which was our ultimate aim (Fig. 2b). This method enabled us to test whether V cmax in the combined radiative transfer and biochemical model can be sufficiently constrained by passive ChlF and τ data. A narrow band of ChlF at the far‐red peak (730–750 nm) and of green τ (525–545 nm) were selected as the constraint for the model inversion. We retrieved V cmax and the additional parameters and ς (Table 2) by minimizing the squared difference between the simulated and measured spectra (Eqn 11) for the whole‐light‐ or CO2‐response curve at once. In this retrieval, the other parameters of fluspect, notably the pigments and leaf structure parameter N, were kept to leaf‐specific values. These values were retrieved once per leaf before the retrieval of V cmax, and ς, and were assumed not to change during the light‐ and CO2‐response curves (Table 1). In this way, we attributed the dynamic changes to the τ spectrum to the xanthophyll cycle, and thus to C x and K n (Eqns 9, 10).
In all three methods, a trust‐region algorithm was applied in matlab using the built‐in function lsqnonlin to minimize a cost function:
| (Eqn 11) |
where M is the measured data and S the corresponding simulation (for the three methods: gas exchange, PAM data, and hyperspectral data). For method 3, M and S were matrices of multiple spectra: one spectrum for each of the 10 points on the CO2‐response curve or the eight points on the light‐response curve. These spectra included τ and forward ChlF. Because method 3 only uses spectra as input (and no gas‐exchange or PAM data), it was also applied to the additional FluoWat leaf clip dataset. The advantage of the FluoWat leaf clip data is that it provided not only the forward measurements (transmittance τ and ChlF at the shaded side), but also the backward measurements (reflectance ρ and ChlF at the illuminated side). However, due to some nonisotropic scattering and specular reflectance present in the ρ of some samples, we had to normalize the spectra of each light curve by subtracting the ρ at 565 nm. At this wavelength, the xanthophyll cycle ceases to have an effect on the spectra simulated by the fluspect model.
We fitted ρ and backward ChlF, τ and forward ChlF, and both ρ and τ and forward and backward ChlF together to test the dependence of the performance on the side of the leaf that is measured.
Evaluating the model inversion
For method 1, we compared the V cmax retrieved from the light‐response curve with those retrieved with the CO2‐response curves. These retrievals were then used to validate the other methods. We evaluated the goodness‐of‐fit of V cmax, A, and other variables by calculating the root‐mean‐squared error (RMSE) and Pearson's correlation coefficient R 2. The number of data points is slightly different among the three methods due to unrealistic values caused by occasional human error in the measurements, such as light pollution, vibrations during measurements, or incorrect measurement light and pulse settings of the PAM system.
The retrieval accuracy was evaluated for the chamber dataset with the relative RMSE. We further investigated the sensitivity of τ and ChlF spectra to the relevant parameters, the sensitivity of the retrievals to the starting values of the trust‐region algorithm, and the ill‐posedness of the retrieval. We calculated the Jacobian matrices J for τ and ChlF of the model for one representative sample. To obtain comparable values of the sensitivities and to normalize J, we multiplied J by the span of each parameter (see Table 2).
Error propagation in the retrieved parameters due to the measurement noise was estimated as:
| (Eqn 12) |
where the standard deviations of the retrieved parameters σ p are found as the square roots of the diagonal elements of this matrix. σ r is the SD of the measurements due to the measurement noise. For a full derivation of Eqn 12, refer to Vilfan et al. (2018).
Results
Optical and physiological measurements
In Fig. 3 we display different physiological and optical responses of leaves to variations in CO2 concentrations and illumination. Assimilation increases with both increasing CO2 and illumination intensity, until a plateau is reached. The initial slope of the assimilation curve represents the maximum LUE of the leaf, whereas the plateau signifies the light‐saturated rate of photosynthesis (Björkman, 1981).
Figure 3.
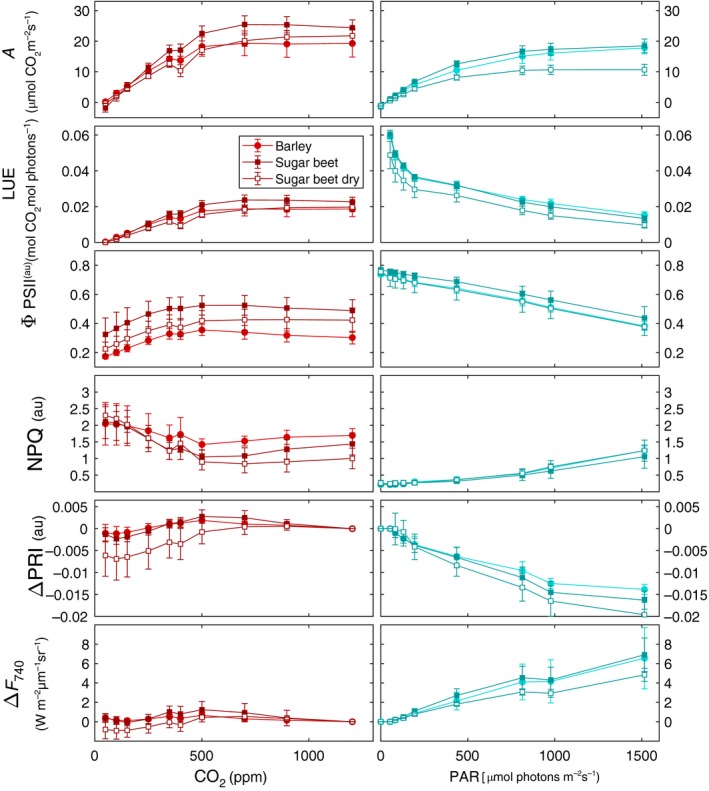
Response to changing CO 2 concentrations and light intensity (photosynthetically active radiation, PAR) in barley (circles) and sugar beet (squares) leaves for (top to bottom): photosynthetic CO 2 assimilation (A); light use efficiency (LUE) of CO 2 assimilation; quantum efficiency of photosystem II (ΦPSII); nonphotochemical quenching (NPQ); photochemical reflectance index (PRI) normalized to the most nonstressed state (∆PRI); and Chl fluorescence at 740 nm normalized to the most nonstressed state (∆F 740). The error bars represent ± SD from the mean. = 20 and n light = 17.
For the case of CO2 curves, the indicators of photosynthetic capacity (A, LUE and ΦPSII) continuously increase until the external concentration of c. 700 ppm CO2, when the maximum assimilation and efficiency are reached. NPQ and PRI respond similarly, with the highest response at the lowest CO2 concentrations. The ChlF response, however, is negligible. For the case of light‐response curves, assimilation and ChlF increase with increasing light, whereas LUE, ΔPRI and ΦPSII decrease.
When comparing measured spectral responses of ΔPRI and ΔF 740 to physiological variables (Fig. 4), it is immediately evident that the two types of leaf response curves do not generate the same optical response. For the light curves, dynamics of both ΔPRI and (F 740 are directly driven by the increasing light intensity. Their relations with A, ΦPSII, NPQ and LUE above the peak value are almost linear, as well as their relations among each other. By contrast, the CO2 curves produce a seemingly less predictable response, with higher variations in measured data, and less obvious relations between the spectral and other variables.
Figure 4.
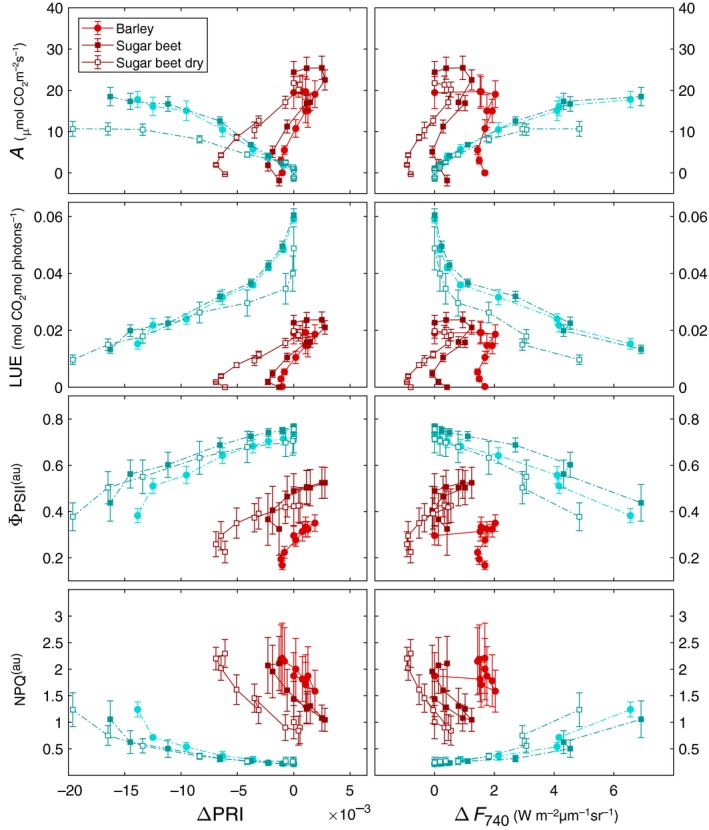
Relation of photosynthetic CO 2 assimilation A; light use efficiency (LUE) of CO 2 assimilation; quantum efficiency of photosystem II (ΦPSII) and nonphotochemical quenching (NPQ) to photochemical reflectance index (PRI) normalized to the most nonstressed state (∆PRI); and Chl fluorescence at 740 nm normalized to the most nonstressed state (∆F 740) under changing CO 2 concentrations (red, solid line) and light intensity (photosynthetically active radiation; blue, dotted line) in barley (circles) and sugar beet (squares) leaves. The error bars represent ± SD from the mean. = 20 and n light = 17.
Differences between the two species are generally small (Figs 3, 4): sugar beet (Beta vulgaris) seems to have better capacity for using elevated CO2 concentrations above 400 ppm, but light responses of the two species were similar. The difference between control and reduced soil moisture content was small; for this reason we do not differentiate between species and treatments in the following results of V cmax retrieval.
Retrievals of V cmax
V cmax and assimilation values estimated with the three methods are presented in Fig. 5, with supporting statistical information.
Figure 5.
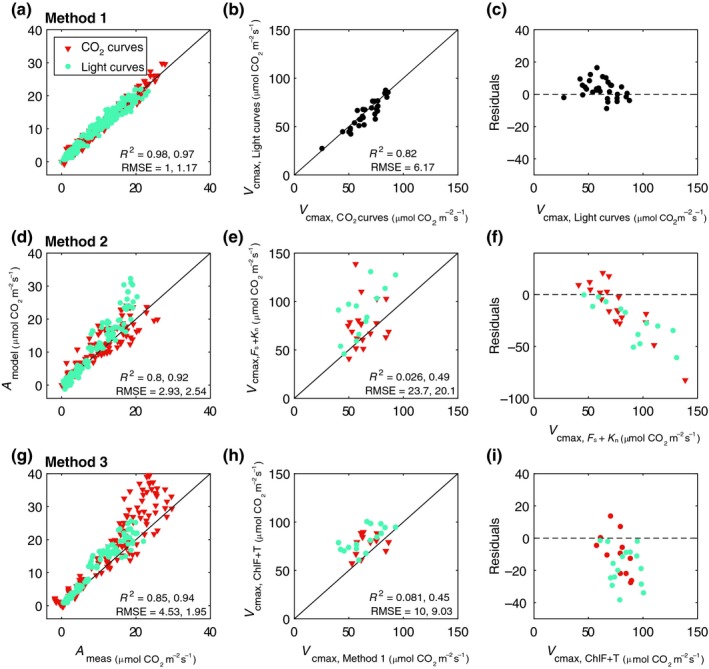
Maximum carboxylation capacity V cmax and assimilation rate A, estimated with three different methods (a,b,d,e,g,h), together with residuals of predictions (measured minus estimated V cmax, c,f,i). In method 1 (a–c), we compare V cmax retrieved from CO 2‐response curves with the ones retrieved from light‐response curves. In methods 2 (d–f) and 3 (g–i) we compare the V cmax retrieved from either pulse amplitude modulation measurements of steady‐state fluorescence F s and nonphotochemical quenching K n or hyperspectral measurements of Chl fluorescence and transmittance τ, respectively, with the values estimated with method 1. Number of samples (leaves) for CO 2‐ and light‐response curves per method is n m1 = 34/34, n m2 = 19/13, and n m3 = 12/16. Pearson's correlation coefficient R 2 and RMSE are shown per measurements type, CO 2 (red triangles) and light curves (blue circles).
In Fig. 5(b) we compare V cmax retrieved from CO2‐ and light‐response curves of the same leaves with method 1. The data display a high level of correlation (R 2 = 0.82 and RMSE ≈ 6), with very accurate predictions of A (Fig. 5a; R 2 = 0.98 and RMSE ≈ 1).
The two other methods (Fig. 5e,h) capture the span of V cmax for both types of response curves, with accurate predictions of A (Fig. 5d,g, with R 2 > 0.80 and RMSE < 4.6). Retrievals of V cmax from PAM measurements provide the highest error (RMSE ≈ 20–23 μmol m−2 s−1). Where hyperspectral data are used to constrain the model (Fig. 5h), for both CO2 and light spectral responses, only the magnitude of V cmax can be estimated (RMSE < 10), not the variation among leaves. Predictions of A are accurate, with R 2 > 0.85 and RMSE < 4.6.
The residuals (retrieved values minus the values retrieved from light curves with method 1) for the three methods are also shown (Fig. 5c,f,i). The smallest range of differences occurs with method 1, with unreliable estimations from method 2. Methods 2 and 3 show a consistent overestimation of V cmax, especially at high V cmax values.
Retrievals from the light‐response curve have a better goodness‐of‐fit (R 2 = 0.45) than retrievals from CO2‐response curves (R 2 = 0.081). We evaluated other state variables besides V cmax and A; Fig. 6 shows that whereas ETR, ΦPSII, and K n are estimated rather well, simulated F s is poorly correlated to PAM‐measured F s. This holds for both the CO2‐ and light‐response curves, although the latter have a better goodness‐of‐fit.
Figure 6.
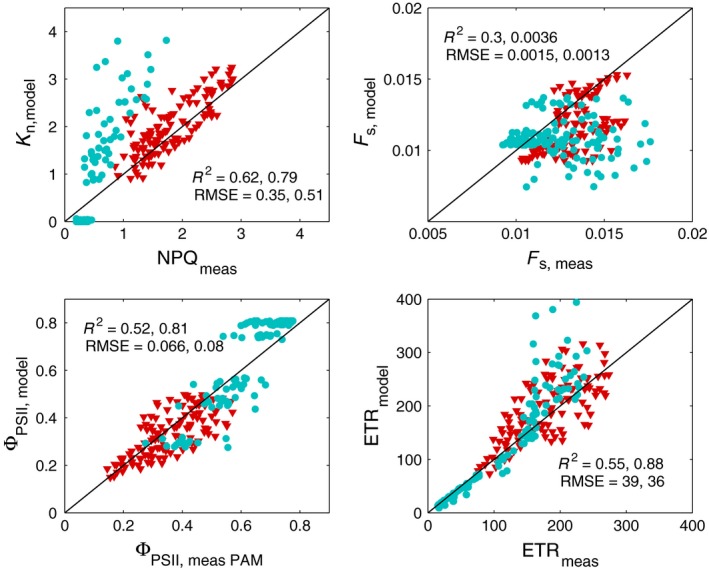
Modelled vs measured nonphotochemical quenching (K n or NPQ), steady‐state fluorescence F s, quantum efficiency of photosystem II (ΦPSII), and electron transport rate (ETR) for method 3. Pearson's correlation coefficient R 2 and RMSE are shown per measurements type, CO 2 (red triangles) and light curves (blue circles). = 12 and n light = 16.
The accuracy of spectral fit after optimization between measured and simulated τ or ChlF is presented in Fig. 7. The spectral fit of τ and forward ChlF at the selected wavelengths is similarly good, with error close to 0% on average, with a maximal deviation of 4% for τ and 17% for ChlF. The measurement error of the spectra used for V cmax retrieval had a negligible effect on the estimated V cmax (3%, not shown). Most of the uncertainty in V cmax is due to the sensitivity of V cmax to the spectra and the model representation. This is illustrated in Fig. 8, showing the RMSE used as the cost functions for the first and third methods as a function of V cmax for one representative leaf. Both the RMSE of fluorescence and transmittance have a single minimum, indicating their sensitivity to V cmax. The RMSE of fluorescence has a sharp and deep minimum, which confirms the sensitivity of fluorescence to V cmax, but the location of the minimum differs between the CO2‐ and light‐response curves, which is indicative of a model representation error. The RMSE of transmittance shows a less sharp minimum, but the location of the minimum agrees between the CO2 and light curves, and with the value retrieved from the assimilation data with method 1. This indicates that the model cannot fully reproduce the measured spectrum, but the transmittance nevertheless responds to V cmax and the model is able to identify the correct value of V cmax.
Figure 7.
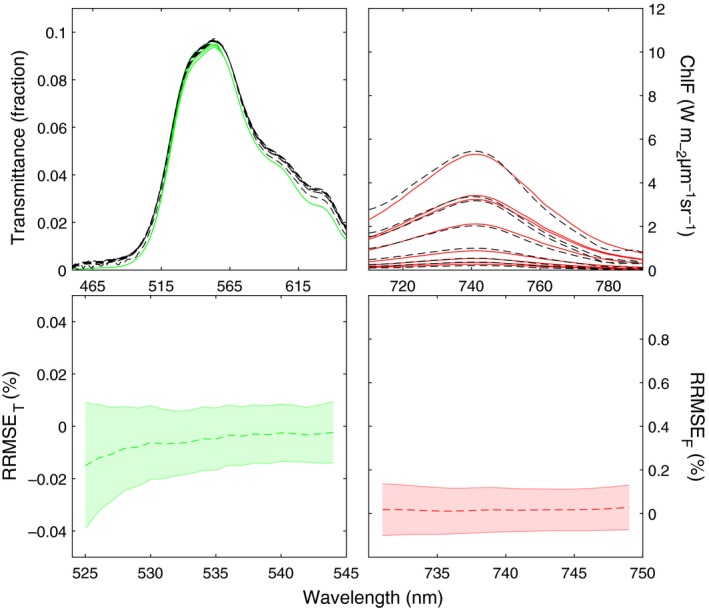
Comparison of measurements (broken line, black) and retrieval accuracy (solid line, red) after fitting with method 3 in the selected bands of transmittance (left panels) and forward Chl fluorescence (ChlF, right panels) spectra. RRMSE is the relative root‐mean‐square error of retrieval accuracy, and the shaded area represents the SD of the mean (broken line).
Figure 8.
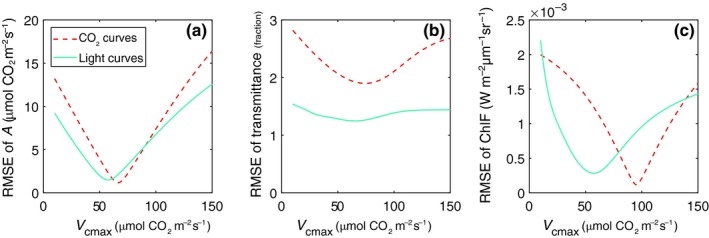
RMSE used as the cost functions for methods 1 and 3 as a function of maximum carboxylation capacity V cmax for one representative leaf, plotted as the input range of V cmax against the corresponding RMSE of (a) either assimilation rate (method 1) or (b) transmittance (method 3) and (c) fluorescence (method 3). The valleys of the curves represent the minima of the V cmax optimization.
We further investigate the separate contributions of the fitting parameters used in method 3 (V cmax, and ς) to the spectra simulated by the combined model in Fig. 9. τ is influenced most by V cmax, less by , and ‐obviously‐ ς (the scaling of ChlF) has no effect on τ while ChlF is influenced mostly by ς, less by , and the effect of V cmax is still relatively small despite the clear sensitivity shown in Fig. 8.
Figure 9.
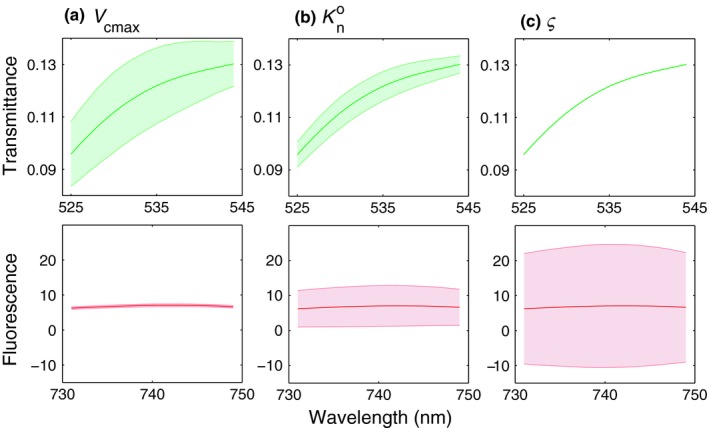
Sensitivity of transmittance (upper panels) and Chl fluorescence (ChlF, lower panels) spectra to the three fitting parameters used in method 3: (a) maximum carboxylation capacity V cmax; (b) (fitting parameter for nonphotochemical quenching K n; Eqn 4); and (c) the scaling factor ς that links the ChlF efficiencies of the two leaf models in Eqn 10. The shaded area denotes the span of values.
Retrieving V cmax from FluoWat data
For the FluoWat data (Fig. 10), we obtained similar results as for the chamber dataset: the correct range of V cmax values is retrieved (RMSE c. 13 μmol m−2 s−1), but with low goodness‐of‐fit. The residuals have the same span as obtained for the chamber dataset (Fig. 5h), albeit reversed: there is an increase in underestimation with increasing V cmax values. There are no substantial differences in results when transmittance or reflectance of the leaf are used for the retrieval. It should be emphasized that we used the V cmax values obtained earlier in the chamber for validation, because the FluoWat leaf clip does not allow for gas‐exchange measurements.
Figure 10.
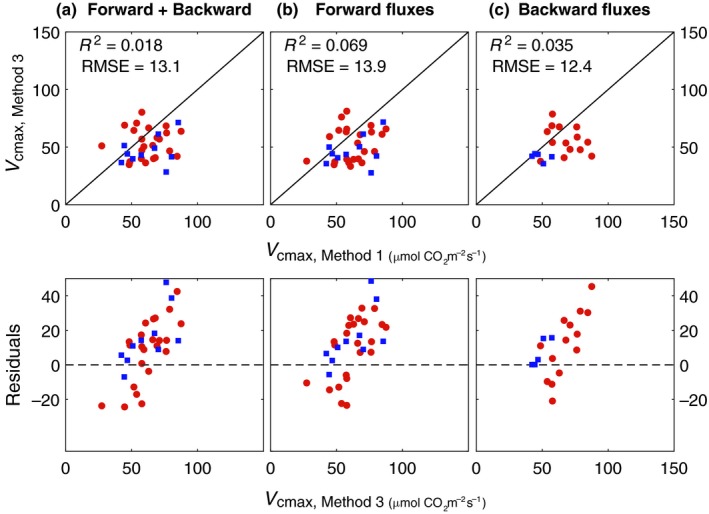
Values of maximum carboxylation capacity V cmax, retrieved for the FluoWat dataset with method 3, vs control values for barley (red circles) and sugar beet (blue squares) leaves, with the residuals (measured minus estimated V cmax) shown in the bottom panels. V cmax, (fitting parameter for K n; Eqn 4), and the scaling factor ς (links the Chl fluorescence (ChlF) efficiencies of the two leaf models in Eqn 10) were optimized to best reproduce measured (a) reflectance and backward ChlF, (b) transmittance and forward ChlF, or (c) all four simultaneously. Pearson's correlation coefficient (R 2) and RMSE are shown for all data combined. Note, that the control values of V cmax (V cmax,Method 1) were obtained by applying method 1 to the Chamber dataset. Number of samples for barley and sugar beet per retrieval is n a = 23/10, n b = 23/10, and n c = 14/5.
Discussion
Both the transmittance and the fluorescence spectra (method 3) contain sufficient information to constrain V cmax, as demonstrated by the clear minima in their RMSE with respect to varying V cmax (Fig. 8). The results show that, for our dataset, with limiting span of V cmax, the magnitude but not the variability of V cmax among leaves can be estimated from the coupled model, by using the combined information of hyperspectral ChlF and green ρ or τ. The RMSE for the estimated V cmax is nevertheless below 14 μmol CO2 m−2 s−1, which complies with the error determined by similar studies of leaf level responses (Serbin et al., 2012; Dechant et al., 2017) and by a study on airborne data by Serbin et al. (2015). Both Serbin et al. (2012) and Dechant et al. (2017) used a much wider range of V cmax (0–200 μmol CO2 m−2 s−1). Considering the limited span of V cmax in our measurements (50–100 μmol CO2 m−2 s−1), the low and comparable values of RMSE are encouraging. Leaf datasets with a known wider span of maximum photosynthetic capacity would provide a valuable further validation of the model.
The response of ChlF to changing CO2 is small, but nevertheless meaningful (see dashed line in Fig. 8c). This response is limited due to the fact that in a CO2‐response curve, a reduction of PQ is compensated by an increase in NPQ and vice versa, with limited net effect on ChlF. The responses of NPQ and ΔPRI are unambiguous, but tuning V cmax cannot bring the RMSE of transmittance close to zero (Fig. 8b): the effect of NPQ on transmittance is small compared with the accuracy by which we can reproduce the overall transmittance spectrum.
Potential errors in the V cmax retrieval with method 3 include measurement errors, the performance of the optimization method, and the biochemical and radiative transfer model representation. We investigated the potential effects of measurement errors and accuracy of spectral fit on the retrievals of V cmax, but these effects were minimal: up to 3% of the retrieved V cmax values. Crucial is the model representation.
Despite controlled experimental conditions, the values of V cmax estimated from the assimilation rates (method 1) differ up to 25% between light and CO2 responses (Fig. 5c). A study by Miao et al. (2009) has similarly shown that significant differences exist between different methods of V cmax retrieval from A curves. This could be attributed to limitations of the Collatz model (Collatz et al., 1991) used by Van der Tol et al. (2014), which does not use the maximum electron transport capacity J max of the original Farquhar model as an additional parameter. The parameterization of photorespiration may also contribute to this difference; photorespiration was not suppressed in our experiment, which was carried out under ambient O2.
Differences in the optimized values from transmittance and fluorescence (Fig. 8b,c) may originate from the prescribed relations of η and C x to ε and K n, which were reconciled by using a single cost function for both transmittance and fluorescence, and allowing variations in these relationships.
We established the link between the radiative transfer model fluspect and the photosynthesis model via parameter η (the absolute ChlF quantum yield) to ε = F s/F o, and C x to K n via a calibrated coefficient (Vilfan et al., 2018). This introduces uncertainty, because PAM F s cannot be reproduced well by the model. The poor correlation of PAM F s to simulated F s can at least partly be explained by the compensation of the effects of PQ and NPQ, resulting in a relatively small range of F s, which is then prone to uncertainties. This was also noted in the development of the extended biochemical model (Van der Tol et al., 2014, Fig. 9).
In Van der Tol et al. (2014), two different parametrizations are given for K n for different datasets. Obviously, , a parameter for the xanthophyll pool size, may vary. In a first attempt to fit τ and ChlF of the light‐response curves, we found that retrieving only V cmax while keeping at the default value of Van der Tol et al. (2014) did not provide a satisfactory fit (not shown here). It was necessary, therefore, to include in the retrieval. Inclusion of ς was necessary in order to translate F s in arbitrary units to absolute values of ChlF yield.
Indeed, the sensitivity analysis (Figs 8, 9) reveals that τ simulated with the combined model depends primarily on V cmax, whereas the magnitude of ChlF is most affected by the hitherto unconstrained ς, and has a similar effect on both indicators. These results indicate that both τ and ChlF contribute to the V cmax estimations.
Potential ill‐posedness could be reduced by introducing prior information on V cmax; for example, based on vegetation indices or pigment concentrations, of which Chl concentration is a most valid candidate (Houborg et al., 2015; Gitelson et al., 2016). A more mechanistic modelling could potentially reduce the uncertainty in other parameters, such as and ς. For example, the description of energy partitioning to NPQ used in this study could be replaced with MD12, whereas models developed by Zaks et al. (2013) and Matuszyńska et al. (2016) may help constrain ς using fluorescence kinetics.
The residuals of two datasets (chamber vs leaf clip) used with method 3 (Figs 5i, 9) have the same span, which is encouraging, as it shows that similar results can be achieved with different types of spectral measurements (i.e. reflectance or transmittance). In general, predictions of A are at least 10% more accurate for estimations from light‐response curves compared with CO2 responses; and similarly, light‐response curves provide a higher accuracy of V cmax retrieval.
Our study showed that a quantification of photosynthesis from transmittance or reflectance and ChlF during light‐ and CO2‐response curves is possible and very promising.
Author contributions
NV is the main author of this paper; she collected the datasets, coupled the models, and performed the analysis. CvdT and WV assisted with model development, sensitivity analysis, and manuscript development.
Acknowledgements
The research presented in this paper was funded by the Netherlands Organization for Scientific Research in the frame of the Earth and Life Sciences (ALW) division, project ALW‐GO/13‐32. Additional funding for model development was provided by the European Space Agency (ESA), FLEX/Sentinel‐3 Tandem Mission Photosynthesis Study (ESA/ESTEC contract no. 4000106396/12/NL/AF) and FLEX/Sentinel‐3 Tandem Mission Bridge Study ESA/ESTEC contract no. 4000112341/14/NL/FF/gp). CvdT received a grant from the Deutsche Forschungsgemeinschaft in the frame of the Transregional Collaborative Research Center (TR32) ‘Patterns in Soil–Vegetation–Atmosphere Systems: Monitoring, Modelling and Data Assimilation’ for this work. We thank Uwe Rascher, Onno Muller, and Hella Ahrends for collaboration and their organizational efforts, Shizue Matsubara and Marijke van der Tol for their help with the measurements, and Edelgard Schölgens for laboratory analyses.
References
- Ač A, Malenovský Z, Olejníčková J, Gallé A, Rascher U, Mohammed G. 2015. Meta‐analysis assessing potential of steady‐state chlorophyll fluorescence for remote sensing detection of plant water, temperature and nitrogen stress. Remote Sensing of Environment 168: 420–436. [Google Scholar]
- Atherton J, Nichol CJ, Porcar‐Castell A. 2016. Using spectral chlorophyll fluorescence and the photochemical reflectance index to predict physiological dynamics. Remote Sensing of Environment 176: 17–30. [Google Scholar]
- Barton CVM, North PRJ. 2001. Remote sensing of canopy light use efficiency using the photochemical reflectance index: model and sensitivity analysis. Remote Sensing of Environment 78: 264–273. [Google Scholar]
- Björkman O. 1981. Responses to different quantum flux densities In: Lange OL, Nobel PS, Osmond CB, Ziegler H, eds. Physiological plant ecology I. Berlin, Germany: Springer, 57–107. [Google Scholar]
- Cheng YB, Middleton EM, Zhang Q, Huemmrich KF, Campbell PKE, Corp LA, Cook BD, Kustas WP, Daughtry CS. 2013. Integrating solar induced fluorescence and the photochemical reflectance index for estimating gross primary production in a cornfield. Remote Sensing 5: 6857–6879. [Google Scholar]
- Collatz GJ, Ball JT, Grivet C, Berry JA. 1991. Physiological and environmental regulation of stomatal conductance, photosynthesis and transpiration: a model that includes a laminar boundary layer. Agricultural and Forest Meteorology 54: 107–136. [Google Scholar]
- Dechant B, Cuntz M, Vohland M, Schulz E, Doktor D. 2017. Estimation of photosynthesis traits from leaf reflectance spectra: correlation to nitrogen content as the dominant mechanism. Remote Sensing of Environment 196: 279–292. [Google Scholar]
- Demmig‐Adams B, Adams WW III. 1996. The role of xanthophyll cycle carotenoids in the protection of photosynthesis. Trends in Plant Science 1: 21–26. [Google Scholar]
- Drusch M, Moreno J, Del Bello U, Franco R, Goulas Y, Huth A, Kraft S, Middleton EM, Miglietta F, Mohammed G et al 2017. The FLuorescence EXplorer mission concept — ESA's Earth Explorer 8. IEEE Transactions on Geoscience and Remote Sensing 55: 1273–1284. [Google Scholar]
- Farquhar GD, von Caemmerer S, Berry JA. 1980. A biochemical model of photosynthetic CO2 assimilation in leaves of C3 species. Planta 149: 78–90. [DOI] [PubMed] [Google Scholar]
- Féret J‐B, Gitelson AA, Noble SD, Jacquemoud S. 2017. prospect‐D: towards modeling leaf optical properties through a complete lifecycle. Remote Sensing of Environment 193: 204–215. [Google Scholar]
- Franck F, Juneau P, Popovic R. 2002. Resolution of the photosystem I and photosystem II contributions to chlorophyll fluorescence of intact leaves at room temperature. Biochimica et Biophysica Acta (BBA) – Bioenergetics 1556: 239–246. [DOI] [PubMed] [Google Scholar]
- Gamon JA, Peñuelas J, Field CB. 1992. A narrow‐waveband spectral index that tracks diurnal changes in photosynthetic efficiency. Remote Sensing of Environment 41: 35–44. [Google Scholar]
- Garbulsky MF, Peñuelas J, Gamon J, Inoue Y, Filella I. 2011. The photochemical reflectance index (PRI) and the remote sensing of leaf, canopy and ecosystem radiation use efficiencies. A review and meta‐analysis. Remote Sensing of Environment 115: 281–297. [Google Scholar]
- Gitelson AA, Gamon JA, Solovchenko A. 2017. Multiple drivers of seasonal change in PRI: implications for photosynthesis 1. Leaf level. Remote Sensing of Environment 191: 110–116. [Google Scholar]
- Gitelson AA, Peng Y, Arkebauer TJ, Suyker AE. 2015. Productivity, absorbed photosynthetically active radiation, and light use efficiency in crops: implications for remote sensing of crop primary production. Journal of Plant Physiology 177: 100–109. [DOI] [PubMed] [Google Scholar]
- Gitelson AA, Peng Y, Viña A, Arkebauer T, Schepers JS. 2016. Efficiency of chlorophyll in gross primary productivity: a proof of concept and application in crops. Journal of Plant Physiology 201: 101–110. [DOI] [PubMed] [Google Scholar]
- Grace J, Nichol C, Disney M, Lewis P, Quaife T, Bowyer P. 2007. Can we measure terrestrial photosynthesis from space directly, using spectral reflectance and fluorescence? Global Change Biology 13: 1484–1497. [Google Scholar]
- Houborg R, McCabe MF, Cescatti A, Gitelson AA. 2015. Leaf chlorophyll constraint on model simulated gross primary productivity in agricultural systems. International Journal of Applied Earth Observation and Geoinformation 43: 160–176. [Google Scholar]
- Jacquemoud S, Baret F. 1990. prospect: a model of leaf optical properties spectra. Remote Sensing of Environment 34: 75–91. [Google Scholar]
- Kosugi Y, Matsuo N. 2006. Seasonal fluctuations and temperature dependence of leaf gas exchange parameters of co‐occurring evergreen and deciduous trees in a temperate broad‐leaved forest. Tree Phsysiology 26: 1173–1184. [DOI] [PubMed] [Google Scholar]
- Liu L, Guan L, Liu X. 2017. Directly estimating diurnal changes in GPP for C3 and C4 crops using far‐red sun‐induced chlorophyll fluorescence. Agricultural and Forest Meteorology 232: 1–9. [Google Scholar]
- Matuszyńska A, Heidari S, Jahns P, Ebenhöh O. 2016. A mathematical model of non‐photochemical quenching to study short‐term light memory in plants. Biochimica et Biophysica Acta – Bioenergetics 1857: 1860–1869. [DOI] [PubMed] [Google Scholar]
- Maxwell K, Johnson GN. 2000. Chlorophyll fluorescence—a practical guide. Journal of Experimental Botany 51: 659–668. [DOI] [PubMed] [Google Scholar]
- Miao Z, Xu M, Lathrop RG, Wang Y. 2009. Comparison of the A–C c curve fitting methods in determining maximum ribulose 1,5‐bisphosphate carboxylase/oxygenase carboxylation rate, potential light saturated electron transport rate and leaf dark respiration. Plant, Cell & Environment 32: 109–122. [DOI] [PubMed] [Google Scholar]
- Peñuelas J, Filella I, Gamon JA. 1995. Assessment of photosynthetic radiation‐use efficiency with spectral reflectance. New Phytologist 131: 291–296. [Google Scholar]
- Ruban AV. 2016. Nonphotochemical chlorophyll fluorescence quenching: mechanism and effectiveness in protecting plants from photodamage. Plant Physiology 170: 1903–1916. [DOI] [PMC free article] [PubMed] [Google Scholar]
- Serbin SP, Dillaway DN, Kruger EL, Townsend PA. 2012. Leaf optical properties reflect variation in photosynthetic metabolism and its sensitivity to temperature. Journal of Experimental Botany 63: 489–502. [DOI] [PMC free article] [PubMed] [Google Scholar]
- Serbin SP, Singh A, Desai AR, Dubois SG, Jablonski AD, Kingdon CC, Kruger EL, Townsend PA. 2015. Remotely estimating photosynthetic capacity, and its response to temperature, in vegetation canopies using imaging spectroscopy. Remote Sensing of Environment 167: 78–87. [Google Scholar]
- Tremblay N, Wang Z, Cerovic ZG. 2011. Sensing crop nitrogen status with fluorescence indicators. A review. Agronomy for Sustainable Development 32: 451–464. [Google Scholar]
- Van der Tol C, Berry JA, Campbell PKE, Rascher U. 2014. Models of fluorescence and photosynthesis for interpreting measurements of solar‐induced chlorophyll fluorescence. Journal of Geophysical Research. G, Biogeosciences 119: 2312–2327. [DOI] [PMC free article] [PubMed] [Google Scholar]
- Van der Tol C, Verhoef W, Timmermans J, Verhoef A, Su Z. 2009. An integrated model of soil‐canopy spectral radiances, photosynthesis, fluorescence, temperature and energy balance. Biogeosciences 6: 3109–3129. [Google Scholar]
- Van Wittenberghe S, Alonso L, Verrelst J, Hermans I, Delegido J, Veroustraete F, Valcke R, Moreno J, Samson R. 2013. Upward and downward solar‐induced chlorophyll fluorescence yield indices of four tree species as indicators of traffic pollution in Valencia. Environmental Pollution 173: 29–37. [DOI] [PubMed] [Google Scholar]
- Vilfan N, Van der Tol C, Muller O, Rascher U, Verhoef W. 2016. fluspect‐B: a model for leaf fluorescence, reflectance and transmittance spectra. Remote Sensing of Environment 186: 596–615. [Google Scholar]
- Vilfan N, Van der Tol C, Yang P, Wyber R, Malenovský Z, Robinson SA, Verhoef W. 2018. Extending fluspect to simulate xanthophyll driven leaf reflectance dynamics. Remote Sensing of Environment 211: 345–356. [Google Scholar]
- Walker AP, Beckerman AP, Gu L, Kattge J, Cernusak LA, Domingues TF, Scales JC, Wohlfahrt G, Wullschleger SD, Woodward FI. 2014. The relationship of leaf photosynthetic traits – V cmax and J max – to leaf nitrogen, leaf phosphorus, and specific leaf area: a meta‐analysis and modeling study. Ecology and Evolution 4: 3218–3235. [DOI] [PMC free article] [PubMed] [Google Scholar]
- Wieneke S, Ahrends H, Damm A, Pinto F, Stadler A, Rossini M, Rascher U. 2016. Airborne based spectroscopy of red and far‐red sun‐induced chlorophyll fluorescence: implications for improved estimates of gross primary productivity. Remote Sensing of Environment 184: 654–667. [Google Scholar]
- Zaks J, Amarnath K, Sylak‐Glassman EJ, Fleming GR. 2013. Models and measurements of energy‐dependent quenching. Photosynthesis Research 116: 389–409. [DOI] [PMC free article] [PubMed] [Google Scholar]
- Zhang Y, Guanter L, Berry JA, Van der Tol C, Yang X, Tang J, Zhang F. 2016. Model‐based analysis of the relationship between sun‐induced chlorophyll fluorescence and gross primary production for remote sensing applications. Remote Sensing of Environment 187: 145–155. [Google Scholar]
- Zheng T, Chen J, He L, Arain MA, Thomas SC, Murphy JG, Geddes JA, Black TA. 2017. Inverting the maximum carboxylation rate (V cmax) from the sunlit leaf photosynthesis rate derived from measured light response curves at tower flux sites. Agricultural and Forest Meteorology 236: 48–66. [Google Scholar]


