Abstract
Purpose
The aim of this study is to generate a metabolic database for biomedical studies of biopsy specimens by high‐resolution magic angle spinning (HRMAS) nuclear MR (NMR).
Methods
Seventy‐six metabolites, classically found in human biopsy samples, were prepared in aqueous solution at a known concentration and analyzed by HRMAS NMR. The spectra were recorded under the same conditions as the ones used for the analysis of biopsy specimens routinely performed in our hospital.
Results
For each metabolite, a complete set of NMR spectra (1D 1H, 1D 1H‐CPMG, 2D J‐Resolved, 2D TOCSY, and 2D 1H‐13C HSQC) was recorded at 500 MHz and 277 K. All spectra were manually assigned using the information contained in the different spectra and existing databases. Experiments to measure the T1 and the T2 of the different protons present in the 76 metabolites were also recorded.
Conclusion
This new HRMAS metabolic database is a useful tool for all scientists working on human biopsy specimens, particularly in the field of oncology. It will make the identification of metabolites in biopsy specimens faster and more reliable. Additionally, the knowledge of the T1 and T2 values will allow to obtain a more accurate quantification of the metabolites present in biopsy specimens.
Keywords: biopsies, database, HRMAS NMR, metabolomics
1. INTRODUCTION
Metabolomics is a technique that has developed considerably over the past few years. It provides a link between the genotype and metabolic phenotype and allows a better understanding of cellular metabolism by revealing the metabolite concentration impacted by down‐ or upregulation of a specific gene transcript in pathological conditions.1 Metabolomics is particularly useful to characterize the biology of the tumor, monitor treatments, and predict toxicity.2 Nuclear MR (NMR) metabolomics of tissues has been used to study several cancers3 and has the potential to enable personalized treatment.
High‐resolution magic angle spinning (HRMAS) NMR spectroscopy is particularly adapted to study small samples of unprocessed tissue specimens for medical indications such as tumor analysis4 and transplantation.5 The preparation of biopsy samples is straightforward and fast,6 obviating the need for lengthy chemical extraction procedures. HRMAS NMR spectroscopy can identify and quantify several metabolites from 1D 1H NMR spectra with excellent resolution and signal‐to‐noise ratio. In clinical routine, this technique could eventually be used to characterize biopsies and find predictive and prognostic factors during surgery. In our hospital, samples are transported rapidly by a pneumatic tube from the operating room to the room where the NMR spectrometer is located. Acquisition of HRMAS data takes only around 20 minutes.4, 6, 7, 8
HRMAS NMR has the potential to provide important medical benefits; however, metabolite identification and quantification needs to be fast and reliable. Identification is usually based on the literature and existing databases that have been developed mainly for urine, plasma and CSF9 (HMDB: http://www.hmdb.ca/). 10, 11 A specific HRMAS database for the study of human biological tissues is still lacking and needs to be developed. Moreover, quantification is essential for network analysis and discovery of new biomarkers. The aim of this study is to generate a metabolic HRMAS database for the 76 most common metabolites found in human tissues.
2. METHODS
2.1. Preparation of metabolite solutions
2.1.1. Pure metabolite standards
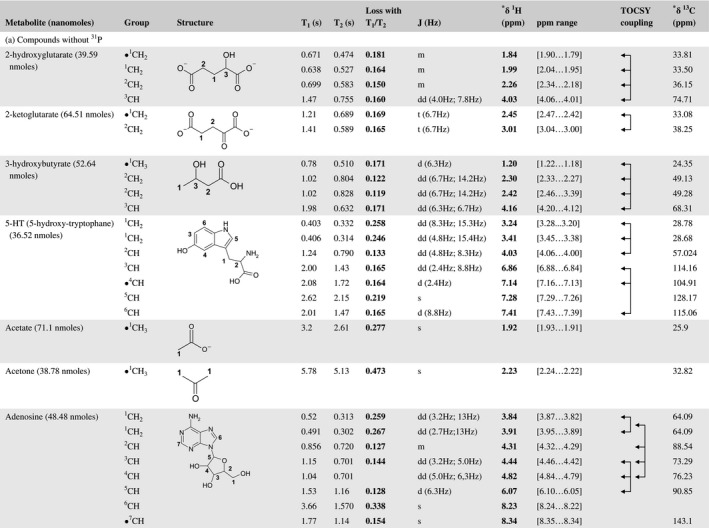
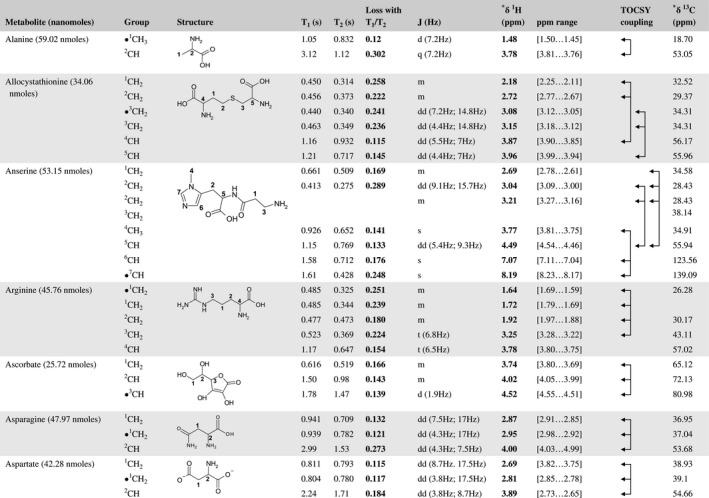
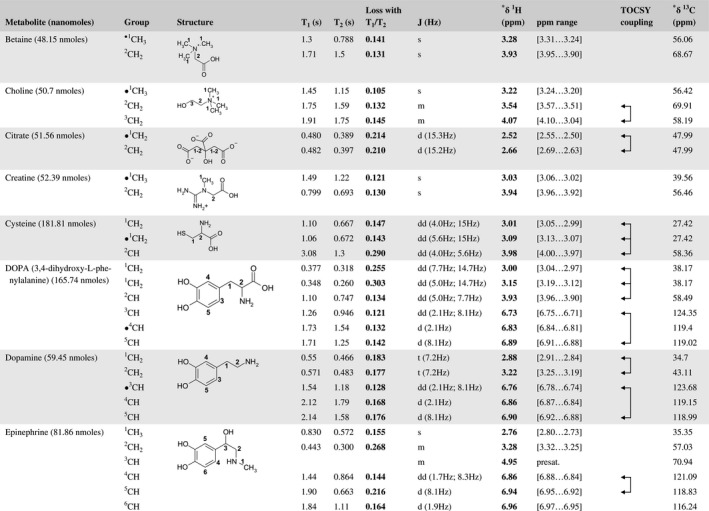
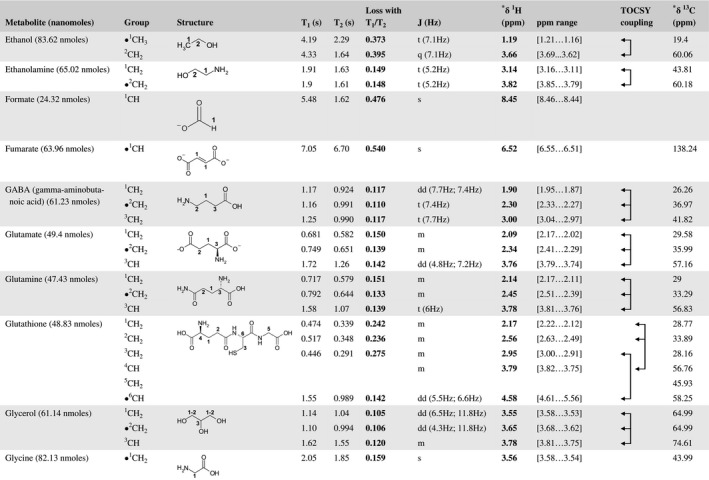
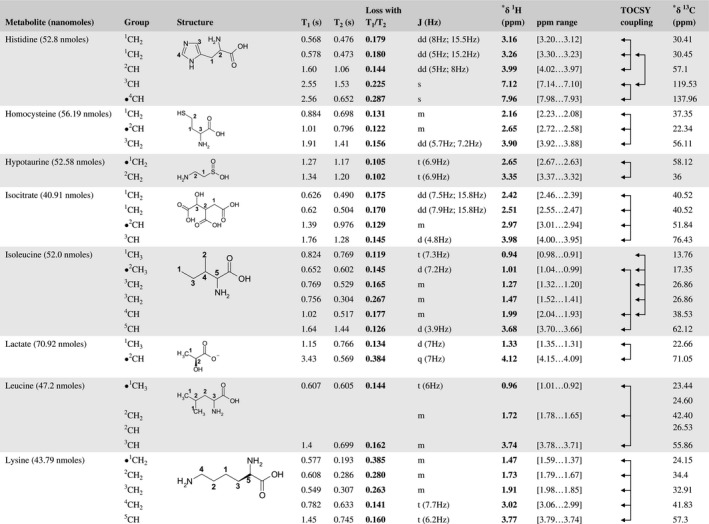
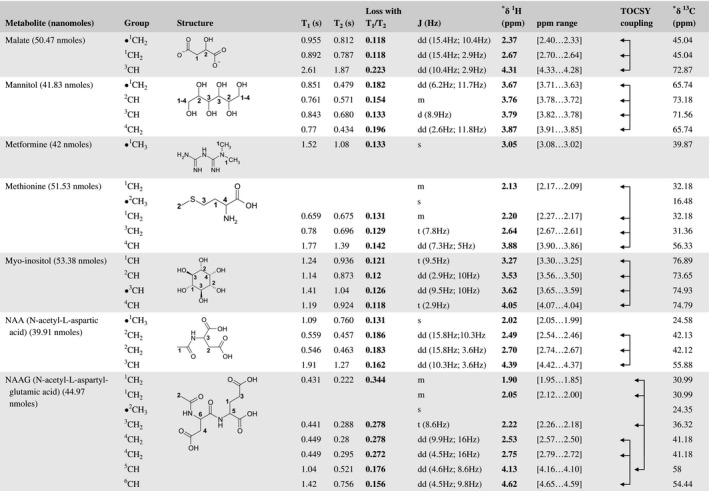
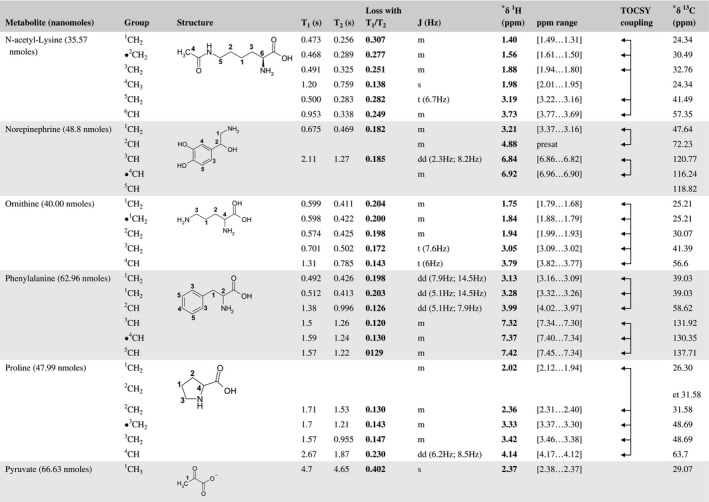
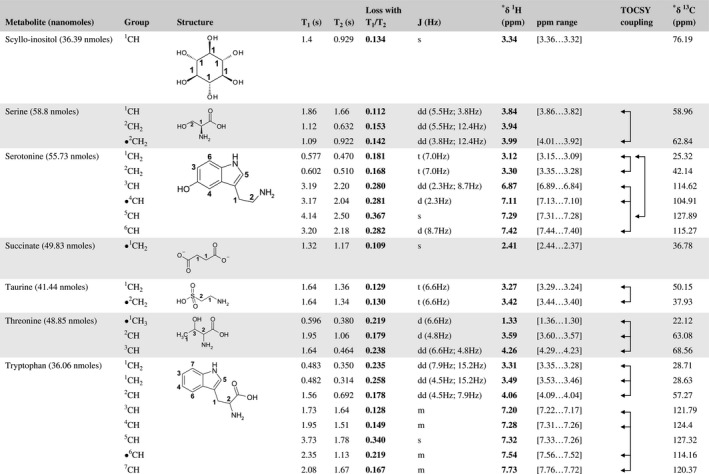
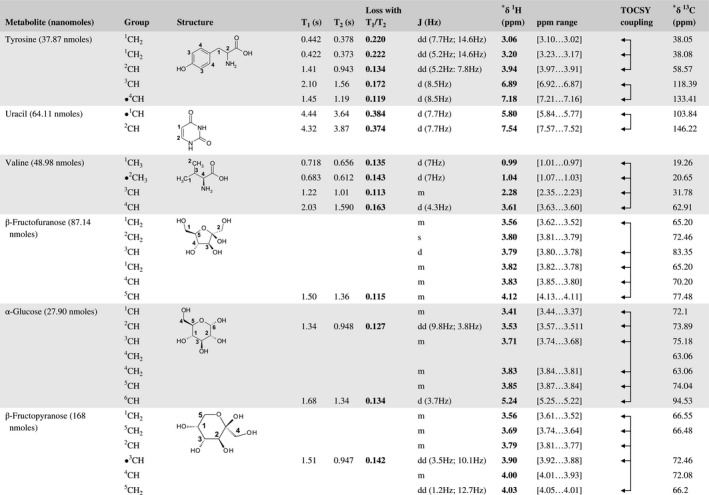
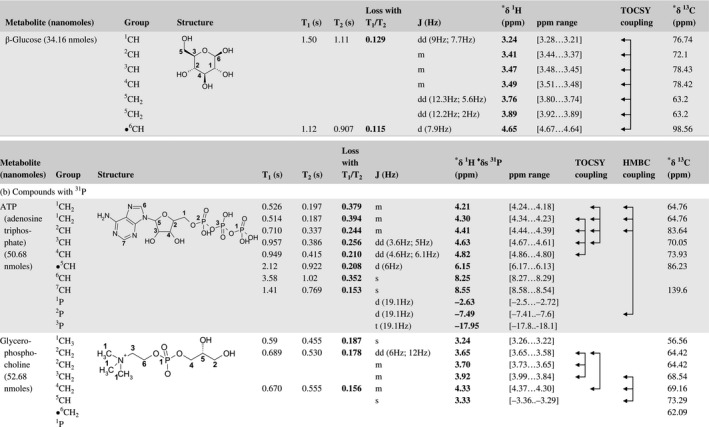
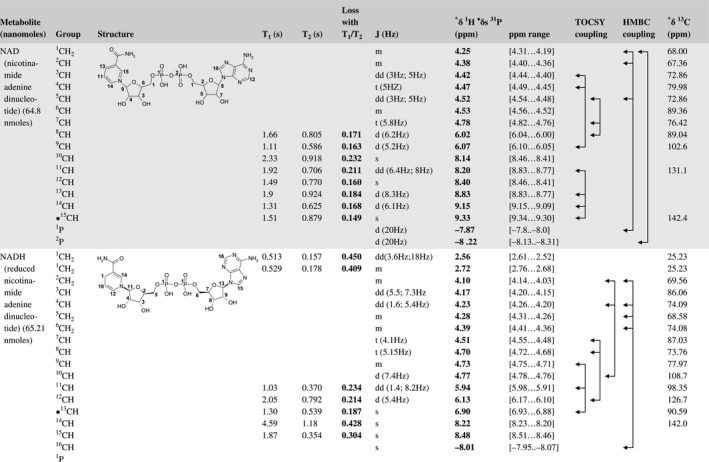
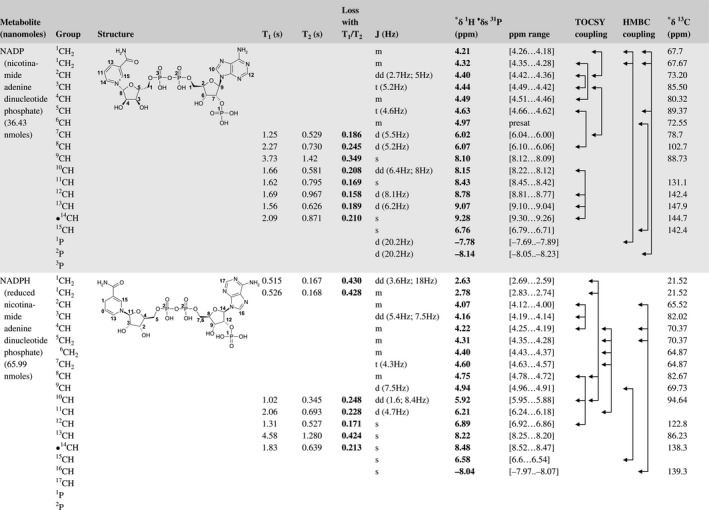
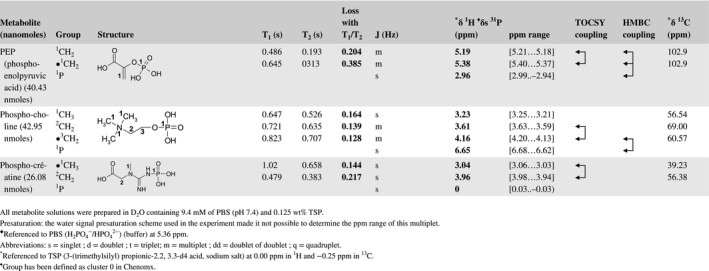
A total of 76 metabolite solutions were prepared to build the metabolic database. For each metabolite, a solution containing approximately 3 mM of the pure metabolite was prepared in D2O containing 9.4 mM of phosphate‐buffered saline (PBS) buffer (pH 7.4) and 0.125% trisodium phosphate (TSP). Twenty‐four microliters of this solution were placed in a 25‐µL disposable insert in KeLF. The number of nmoles actually present in the inserts of each standard solution was determined exactly using the Eretic12 method (Table 1).
Table 1 Content of the metabolic database
2.1.2. Standard metabolites mixture for the validation of concentration measurements
Four solutions containing 4 metabolites were prepared in the same D2O/PBS buffer at different concentrations to validate concentration measurements, taking into account T1 and T2 effects.
The content of the 4 solutions is listed below:
Mixture 1: acetate, ascorbate, choline, and hypotaurine (19.68, 19.44, 19.92, and 20.4 nmoles, respectively);
Mixture 2: acetate, ascorbate, choline, and hypotaurine (32.16, 31.92, 32.64, and 33.36 nmoles, respectively);
Mixture 3: acetate ascorbate, choline and hypotaurine (41.04, 40.8, 41.52, and 42.48 nmoles, respectively); and
Mixture 4: acetate, ascorbate, choline, and hypotaurine (53.52, 53.28, 54.24, and 53.04 nmoles, respectively).
2.1.3. Biopsies preparation
The protocol is the one classically used in our laboratory to prepare biopsy specimens: All tissue samples were collected during surgery immediately after removal of the tumor. Specimens were either frozen in liquid nitrogen in an appropriate Dewar in the operating room or transferred from the block to the spectrometer room by a pneumatic system. Samples were then prepared at a temperature of –20°C. Amount of tissue used ranged from 15 to 20 mg. Each tissue sample was placed in a 25 μL disposable insert using a biopsy punch. A volume of 10 µL of deuterium oxide was then added to each biopsy insert. After a centrifugation step, deuterium oxide was added again to fill the insert. Finally, inserts were stored at –80°C. until the HRMAS analysis was performed. The insert was then placed in a 4‐mm ZrO2 rotor and inserted into the NMR spectrometer. All assays were performed at 4°C. After the analysis, inserts were stored back at –80°C.
2.2. HRMAS NMR spectroscopic analysis
All experiments were conducted on a Bruker Avance III 500 MHz NMR spectrometer (Bruker BioSpin, Billerica, MA) installed at Strasbourg University Hospitals (www.mnms-platform.com). The spectrometer is equipped with a triple‐resonance (1H, 13C, and 31P) HRMAS probe. The temperature was set to 277 K for all acquisitions. Spinning speed was set to 3502 Hz in order to keep the rotation sidebands out of the spectrum window and to minimize sample degradation. For each standard metabolite solution, a complete set of NMR experiments was recorded under exactly the same experimental conditions as the ones used in our laboratory when analyzing human tissues.6, 8 A 1‐dimensional 1H CPMG spectrum was first recorded and followed by a 1‐pulse5, 6 experiment in order to check the stability of the metabolites. For all metabolites, the following 2D experiments were then recorded: J‐Resolved,13 TOCSY,14, 15 and 1H‐13C HSQC.16 For metabolites containing phosphorus, additional experiments were also recorded: 1D 31P with 1H decoupling and 2D 1H‐31P HMBC experiment (see Supporting Information).
2.2.1. Relaxation times measurements were performed after the two 1D sequences
Transverse relaxation times were measured using a pseudo 2D 1H Carr‐Purcell‐Meiboom‐Gill (CPMG) pulse sequence with presaturation. This experiment consists in the acquisition of several 1D spectra with an increasing length of CPMG times. The experiment was performed with the following parameters: spectral width 14.0 ppm, number of points 32 k, relaxation delay 2 seconds, acquisition time 2.33 seconds, and 64 scans. Total acquisition time was of 1 hour 26 minutes.
Longitudinal relaxation times were measured using a pseudo 2D 1H inversion recovery pulse sequence with water suppression, which consists in the acquisition of several 1D spectra with an increasing relaxation delay after the 180° pulse was used. A CPMG module of 93 ms was added just before the acquisition time in order to reduce broad spectral features, which arise from lipids and macromolecules. The experiment was performed with the following parameters: spectral width 14.0 ppm, number of points 32 k, relaxation delay 8 seconds, acquisition time 2.33 seconds, and 64 scans. Total acquisition time was 2 hours and 6 minutes.
2.3. HRMAS NMR data processing
All spectra of the metabolic database were processed using Topspin 3.5 (Bruker BioSpin) and calibrated with respect to the TSP signal at 0.00 ppm in 1H and at −0.25 ppm in 13C. Phosphorus spectra were referenced to the 31P signal of the PBS (H2PO4 −/HPO4 2−) buffer at 5.36 ppm.
2.3.1. Processing and analysis of 2D relaxation data
For both T1 and T2 analysis, the free induction decays were first multiplied with a cosine squared weighting function before Fourier transformation. Data were then carefully phased and baseline corrected. The resulting data were analyzed using the Dynamics Center 2.2.4 package, which is a module of Topspin 3.5 and which is able to perform advanced mono‐ and biexponential curve fitting. This software fits relaxation data using a combination of Simplex and Levenberg‐Marquardt algorithms.
2.4. Quantitative aspects
2.4.1. Correction factors to take into account T1 and T2 effects for a more accurate quantification in CPMG experiments
The signal measured after a CPMG sequence when taking into account T1 and T2 relaxation is given by (Equation 1):
| (1) |
where is the true intensity of the signal.
The signal loss is therefore given by (Equation 2):
| (2) |
where ta is the acquisition time plus the recycle time and tb is the length of the CPMG element. Under our experimental conditions: ta = 4.33 seconds and tb = 93.71 ms.
The correction factor that should be used to correct for the relaxation effects is therefore (Equation 3):
| (3) |
2.5. Human brain tumor specimens
Six human brain specimens (normal cerebral cortex [n = 2], oligodendroglioma [n = 2], and glioblastoma [n = 2]) were prepared following our standard protocol in order to evaluate the performances of our database for metabolite assignment. Additionally, the T1 and T2 relaxation times of 17 brain metabolites (20 chemical groups) were determined in these samples. These relaxation times were measured to confirm the applicability of our database to biological samples.
3. RESULTS
For each of the 76 metabolites contained in the database, the full set of experiments described in Methods was acquired. The 1D and 2D spectra were manually assigned using the information contained in the different spectra as well as the Human Metabolome Database9 and simulated NMR spectra.17 The complete list of 1H/13C chemical shifts and 1H‐1H J‐couplings for the 76 metabolites is presented in Table 1. It also lists the T1 and T2 values of the different protons of the molecules in the metabolic database. An example of the T1/T2 measurement for the different signals of ascorbate is shown in Figure 1. As expected for small molecules in solution, the values of the T1 and T2 are very similar. However, some protons like the Lactate_CH exhibit a distinct behavior, with T2 being much shorter than T1. These relaxation parameters are particularly important because they allow to estimate the amount of magnetization lost because of relaxation and to compute a correction factor. The comparison of the T1/T2 values obtained for the metabolites in solution and in biopsy samples is presented in Table 2. For all metabolites, both T1 and T2 values in biopsy specimens are slightly shorter than in solution. On average, the T1 values obtained in biopsy samples are 17.3% shorter whereas the T2 values are 27.2% shorter. The average loss of magnetization attributed to T1/T2 relaxation effects during a CPMG experiment is computed to be 16% in solution and 17% in biopsy specimens. This result is quite remarkable and provides, for the first time, an estimate of the correction factor that should be used to obtain a more accurate quantification. The fact that the correction factors are so similar, despite slight variations in T1 and T2, can be explained using Equation 2. A shorter T1 will decrease signal loss, whereas a shorter T2 will increase it. The simultaneous decrease of T1 and T2 in biopsy specimens explains that similar signal losses are observed. These values are applicable, provided our own experimental conditions are followed (i.e., CPMG block of 93 ms and recovery delay of 4.33 seconds). However, the T1 and T2 values presented in Table 1 allow to estimate the loss in signal for any of these 2 experimental parameters. As a validation sample, we have used 4 mixtures at different concentrations of 4 metabolites. The results presented in Figure 2 show that a high precision in the concentrations can be obtained, provided the corrections attributed to relaxation effects are taken into account.
Figure 1.
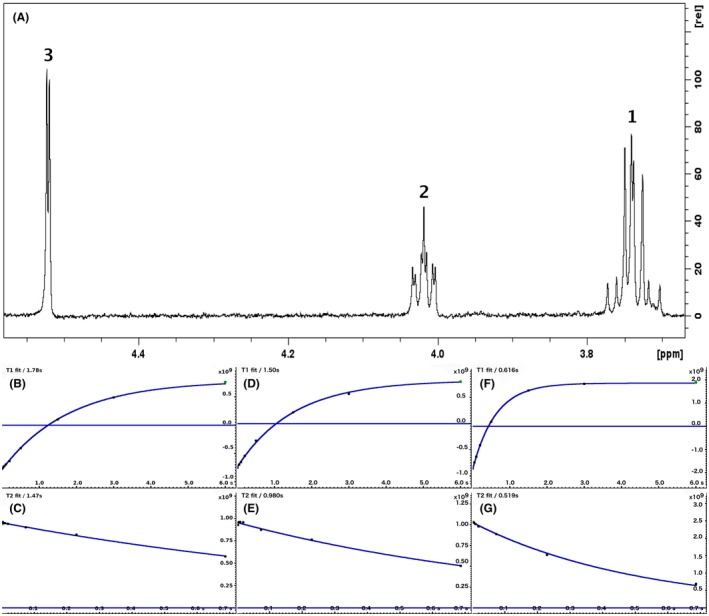
A 500‐MHz 1D 1H CPMG HRMAS spectrum of ascorbate along with graphs showing the measurement of T1 and T2 for the 3 different chemical groups (peak 3 at 4.52 ppm: b and c; peak 2 at 4.02 ppm: d and e; peak 1 at 3.74 ppm: f and g)
Table 2.
T1 and T2 relaxation times measured for 17 metabolites and 20 chemical groups on 6 different biopsies: normal cerebral cortex (n = 2), oligodendroglioma (n = 2), glioblastoma (n = 2)
| Biopsy T1 (s) | Solution T1 (s) | Biopsy T2 (s) | Solution T2 (s) | Biopsy CPMG signal loss | Solution CPMG signal loss | |
|---|---|---|---|---|---|---|
| Acetate_1.92ppm | 2.49 ± 0.15 | 3.20 | 1.42 ± 0.05 | 2.61 | 0.23 ± 0.02 | 0.28 |
| Alanine_1.48ppm | 0.92 ± 0.02 | 1.05 | 0.70 ± 0.04 | 0.83 | 0.13 ± 0.01 | 0.12 |
| Ascorbate_4.52ppm | 1.17 ± 0.03 | 1.78 | 0.63 ± 0.07 | 1.47 | 0.16 ± 0.01 | 0.14 |
| Choline_3.22ppm | 1.27 ± 0.08 | 1.45 | 1.09 ± 0.06 | 1.15 | 0.11 ± 0.01 | 0.11 |
| Creatine_3.94ppm | 0.71 ± 0.03 | 0.80 | 0.57 ± 0.06 | 0.69 | 0.15 ± 0.01 | 0.13 |
| Creatine_3.03ppm | 1.34 ± 0.05 | 1.49 | 0.89 ± 0.06 | 1.22 | 0.14 ± 0.01 | 0.12 |
| GABA_1.90ppm | 0.83 ± 0.06 | 1.17 | 0.40 ± 0.06 | 0.92 | 0.21 ± 0.02 | 0.12 |
| Glutamate_2.09ppm | 0.68 ± 0.02 | 0.68 | 0.39 ± 0.02 | 0.58 | 0.21 ± 0.01 | 0.15 |
| Glutamine_2.14ppm | 0.62 ± 0.01 | 0.72 | 0.45 ± 0.02 | 0.58 | 0.19 ± 0.01 | 0.15 |
| Glutamine_2.45ppm | 0.72 ± 0.02 | 0.79 | 0.55 ± 0.03 | 0.64 | 0.16 ± 0.01 | 0.14 |
| Glycerophosphocholine_3.24ppm | 0.57 ± 0.03 | 0.59 | 0.50 ± 0.02 | 0.46 | 0.18 ± 0.01 | 0.19 |
| Glycine_3.56ppm | 1.49 ± 0.05 | 2.05 | 0.89 ± 0.12 | 1.85 | 0.15 ± 0.01 | 0.16 |
| Lactate_1.33ppm | 0.99 ± 0.05 | 1.15 | 0.65 ± 0.06 | 0.77 | 0.15 ± 0.01 | 0.13 |
| Lactate_4.12ppm | 1.68 ± 0.14 | 3.43 | 0.53 ± 0.05 | 0.57 | 0.23 ± 0.01 | 0.39 |
| Myo‐Inositol_4.05ppm | 0.83 ± 0.02 | 1.19 | 0.45 ± 0.02 | 0.92 | 0.19 ± 0.01 | 0.12 |
| NAA_2.02ppm | 1.02 ± 0.06 | 1.09 | 0.60 ± 0.05 | 0.76 | 0.16 ± 0.01 | 0.13 |
| Phosphocholine_3.23ppm | 0.62 ± 0.02 | 0.65 | 0.50 ± 0.02 | 0.53 | 0.17 ± 0.01 | 0.16 |
| Taurine_3.42ppm | 1.33 ± 0.09 | 1.64 | 0.81 ± 0.07 | 1.34 | 0.14 ± 0.01 | 0.13 |
| Valine_1.04ppm | 0.67 ± 0.06 | 0.68 | 0.52 ± 0.01 | 0.61 | 0.17 ± 0.00 | 0.14 |
| Scyllo‐Inositol_3.34ppm | 0.87 ± 0.02 | 1.40 | 0.53 ± 0.03 | 0.93 | 0.17 ± 0.01 | 0.14 |
The value of T1 and T2 for the pure metabolite is also reported. The last 2 columns show the signal loss expected during a CPMG experiment for the 17 metabolites in a biopsy and in a pure solution, taking into account both T1 and T2 effects.
Figure 2.
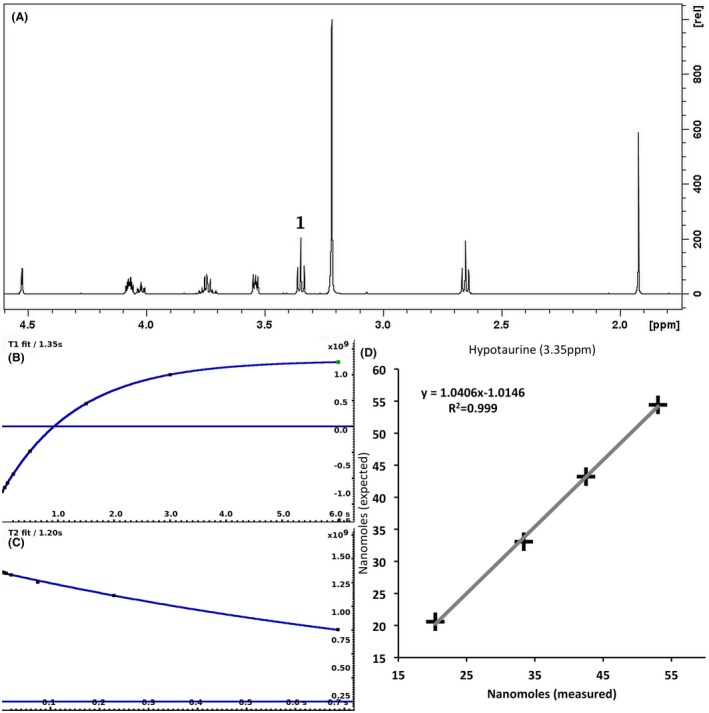
A 500‐MHz 1D 1H CPMG HRMAS spectrum of a mixture containing 4 metabolites (acetate, ascorbate, choline, and hypotaurine) (A) described in Methods. The measurement of T1 (B) and T2 (C) of hypotaurine at 3.35 ppm is shown. The graph (D) shows the correlation between the number of nanomoles measured and expected in the 4 different solutions for hypotaurine. The nanomoles measured values have been corrected for T1 and T2 effects
4. DISCUSSION
HRMAS NMR metabolomics is a promising technique to evaluate the metabolic status of the tissue of a patient. Depending on the tissue and the disease studied, different metabolic pathways and different metabolites may be affected.6, 7, 8 For instance, alterations in the following pathways have been studied by HRMAS: glycolysis, tricarboxylic acid cycle, glutamate/glutamine cycle, 1‐carbon metabolism, membrane metabolism, and amino acid synthesis.
HRMAS NMR metabolomics has been shown to be potentially beneficial in personalized treatment in the following fields of medicine18, 19, 20:
Evaluation of the quality of grafts in liver or lung transplants.5, 21, 22
Detection of oncometabolites for identification of DNA mutations: 2‐hydroxyglutarate in glioma for isocitrate dehydrogenase mutation,23 succinate in pheochromocytomas to distinguish succinate dehydrogenase (SDHx)‐ and non‐SDHx‐related tumors.24
Detection of biomarkers to evaluate tumor aggressiveness. Past studies have shown which metabolic pathways are involved in tumor growth.3, 25 In oligodendrogliomas, the degree of tumor hypoxia obtained at an early state of disease was better correlated with the patient prognosis than the morphological criteria.4 Distinct metabolic signatures were found for lung adenocarcinoma (related to phospholipid metabolism and protein catabolism) and squamous‐cell carcinoma (glycolytic and glutaminolytic profiles).26 In pancreatic adenocarcinoma, the assessment of ethanolamine concentration can be clinically relevant as a single metabolic biomarker to predict long‐term survival.6
Evaluation of tumor exeresis during surgery: The intraoperative metabolic analysis of biopsy specimens can help better characterize tumor margins. This novel application has been presented as a proof of concept in colon cancer.27
The simplified metabolite pathways used in our laboratory is presented in Supporting Information Figure S1. The analysis of the variations in concentration of the different metabolites is usually performed by multivariate or network analysis.28 This approach allows to study the up‐ and downregulation of different pathways in order to find potential biomarkers. In this context, rapid and robust identification as well as reliable quantification are critical.
When performing a study by HRMAS NMR on a large cohort of samples, the detailed metabolite assignment is usually performed only on a few samples. For these samples, the combination of 1D and 2D NMR spectra is particularly powerful, and the database presented in this article makes this assignment relatively straightforward. A unique feature of our metabolic database is that it contains all the spectra used classically to study biopsy specimens: 1H 1D, 1H 1D CMPG, 2D J‐Resolved, 2D TOCSY, and 2D HSQC. Several softwares, like Metabominer29 and AssureNMR (Bruker BioSpin) can provide a semiautomated identification using J‐Resolved, TOCSY, and 1H‐13C HSQC spectra.29 Once the different peaks have been assigned in these samples, the assignment can simply be reported in the 1D spectrum of the remaining samples. Because the conditions for sample preparation and data acquisition follow a strict protocol, there is little variation in peaks position attributed to pH or temperature. Our database was applied to analyze multiple biopsy specimens obtained from tissue banks or from routine surgery. It is clearly a powerful tool that helps provide an accurate and fast metabolic profile. To illustrate this point, Figure 3A shows a typical example of the use of the database when assigning the 1D 1H CPMG spectrum of a biopsy sample. The CPMG is the experiment that is used systematically to characterize biopsy specimens. In this example, the assignment of Allocystationine is highlighted. In case of severe overlap, the assignment can also be confirmed by superimposing the different 2D spectra of the biopsy sample with the corresponding spectra of the database. Figure 3B illustrates this approach by showing the assignment of Allocystationine in the de 2D J‐Resolved spectrum of a human biopsy. This approach allows to assign the different signals contained in a biopsy sample with a very high degree of confidence.
Figure 3.
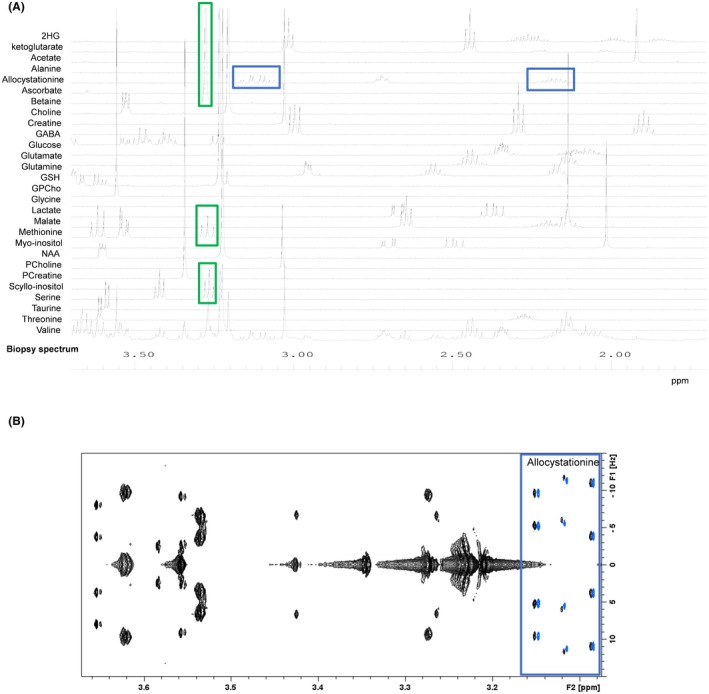
(A) A 500‐MHz 1D 1H CPMG HRMAS spectrum of a human brain tumor sample (right temporal glioblastoma) and several spectra of the database superimposed on top. The resonances of allocystathionine are highlighted with blue squares. The green squares show the spectral region at 3.3 ppm, where there is a strong signal overlap that will require additional 2D experiments. (B) A 500‐MHz 2D J‐resolved HRMAS spectrum of a human brain tumor sample (right temporal glioblastoma) superimposed with the allocystathionine spectrum (the spectrum has been slightly shifted to the right in order to visualize the good agreement between the peaks)
For biomedical applications, it is essential to obtain quantitative information on metabolites present in tissues, that is, in the cells, extracellular space, and microenvironment. This information is usually presented as the number of nmoles of metabolites per mg of biopsy material. The reliability of the analysis will depend on the quality of the tissue sample controlled in histopathology (with a preference for the HRMAS sample itself or the mirror sample). The T1 and T2 data presented in this article allow to improve the quantification of metabolites in biopsies by computing, for each chemical group of a given metabolite, a correction factor that takes into account relaxation losses during the CPMG experiment. Under our experimental CPMG conditions, this loss of signal ranges from 11% to 23%. Similar relaxation times measurements have been performed in vivo at 17.2T in the rat brain to improve quantification of metabolites.30 A very important feature of our HRMAS database is that it contains spectra recorded on a known quantity of metabolites. This implies that the CPMG spectrum of the database can be used to directly estimate the amounts of metabolites contained in the CPMG spectrum of a biopsy sample. The scaling factor used to match the peaks in the biopsy spectrum can be used to calculate the concentration of that specific metabolite. Techniques of quantification of metabolites in biopsy specimens are becoming very performant; however, they still need to be improved, notably in terms of speed and automation. In our laboratory, these quantification routines are currently being implemented in the Chenomx and AssureNMR software. This database has the potential to become a reference to identify metabolite peaks in tissues outside our laboratory, provided data are collected under the exact experimental conditions. It should be useful at both 500 and 600 MHz, which are the 2 magnetic fields most commonly used in this type of study.
5. CONCLUSION
HRMAS NMR metabolomics is becoming an important technique in clinical research and could potentially improve personalized medicine. The database presented in this study considerably simplifies the assignment of signals in the spectra of biopsy specimens. The spectra of the database are all provided along with the number of nmoles used for the standard sample, which makes them useful for quantification applications. Additionally, the loss of magnetization attributed to T1 and T2 effects observed during CPMG experiments run under our experimental conditions is reported for metabolites in solution (average loss 16%) and in biopsy specimens (average loss 17%).
Supporting information
FIGURE S1 Simplified metabolite pathways used in our laboratory
ACKNOWLEDGMENT
We thank Dr Clément Heude for his help in analyzing the T1 and T2 data of biopsy specimens.
Ruhland E, Bund C, Outilaft H, Piotto M, Namer I‐J. A metabolic database for biomedical studies of biopsy specimens by high‐resolution magic angle spinning nuclear MR: a qualitative and quantitative tool. Magn Reson Med. 2019;82:62–83. 10.1002/mrm.27696
REFERENCES
- 1. Griffin JL, Shockcor JP. Metabolic profiles of cancer cells. Nat Rev Cancer. 2004;4:551–561. [DOI] [PubMed] [Google Scholar]
- 2. Claudino WM, Quattrone A, Biganzoli L, Pestrin M, Bertini I, Di Leo A. Metabolomics: available results, current research projects in breast cancer, and future applications. J Clin Oncol. 2007;25:2840–2846. [DOI] [PubMed] [Google Scholar]
- 3. Bathen TF, Sitter B, Sjøbakk TE, Tessem MB, Gribbestad IS. Magnetic resonance metabolomics of intact tissue: a biotechnological tool in cancer diagnostics and treatment evaluation. Cancer Res. 2010;70:6692–6696. [DOI] [PubMed] [Google Scholar]
- 4. Erb G, Elbayed K, Piotto M, et al. Toward improved grading of malignancy in oligodendrogliomas using metabolomics. Magn Reson Med. 2008;59:959–965. [DOI] [PubMed] [Google Scholar]
- 5. Faitot F, Besch C, Battini S, et al. Impact of real‐time metabolomics in liver transplantation: graft evaluation and donor‐recipient matching. J Hepatol. 2018;68:699–706. [DOI] [PubMed] [Google Scholar]
- 6. Battini S, Faitot F, Imperiale A, et al. Metabolomics approaches in pancreatic adenocarcinoma: tumor metabolism profiling predicts clinical outcome of patients. BMC Med. 2017;15:56. [DOI] [PMC free article] [PubMed] [Google Scholar]
- 7. Battini S, Imperiale A, Taïeb D, et al. High‐resolution magic angle spinning (1)H nuclear magnetic resonance spectroscopy metabolomics of hyperfunctioning parathyroid glands. Surgery. 2016;160:384–394. [DOI] [PubMed] [Google Scholar]
- 8. Imperiale A, Battini S, Averous G, et al. In vivo detection of catecholamines by magnetic resonance spectroscopy: a potential specific biomarker for the diagnosis of pheochromocytoma. Surgery. 2016;159:1231–1233. [DOI] [PMC free article] [PubMed] [Google Scholar]
- 9. Wishart DS, Jewison T, Guo AC, et al. HMDB 3.0—The Human Metabolome Database in 2013. Nucleic Acids Res. 2013;41:D801–D807. [DOI] [PMC free article] [PubMed] [Google Scholar]
- 10. Julià‐Sapé M, Acosta D, Mier M, Arùs C, Watson D; INTERPRET consortium . A multi‐centre, web‐accessible and quality control‐checked database of in vivo MR spectra of brain tumour patients. MAGMA. 2006;19:22–33. [DOI] [PubMed] [Google Scholar]
- 11. Julià‐Sapé M, Lurgi M, Mier M, et al. Strategies for annotation and curation of translational databases: the eTUMOUR project. Database (Oxford). 2012;2012:bas035. [DOI] [PMC free article] [PubMed] [Google Scholar]
- 12. Wider G, Dreier L. Measuring protein concentrations by NMR spectroscopy. J Am Chem Soc. 2006;128:2571–2576. [DOI] [PubMed] [Google Scholar]
- 13. Aue WP, Karhan J, Ernst RR. Homonuclear broad‐band decoupling and 2‐dimensional J‐resolved NMR spectroscopy. J Chem Phys. 1976;64:4226–4227. [Google Scholar]
- 14. Braunschweiler L, Ernst R. Coherence transfer by isotropic mixing: application to proton correlation spectroscopy. J Magn Reson. 1983;53:521–528. [Google Scholar]
- 15. Kupce E, Keifer PA, Delepierre M. Adiabatic TOCSY MAS in liquids. J Magn Reson. 2001;148:115–120. [DOI] [PubMed] [Google Scholar]
- 16. Davis AL, Laue ED, Keeler J, Moskau D, Lohman J. Experiments for recording pure‐absorption heteronuclear correlation spectra using pulsed field gradients. J Magn Reson. 1991;94:637–644. [Google Scholar]
- 17. Binev Y, Marques MM, Aires‐de‐Sousa J. Prediction of 1H NMR coupling constants with associative neural networks trained for chemical shifts. J Chem Inf Model. 2007;47:2089–2097. [DOI] [PubMed] [Google Scholar]
- 18. Armitage EG, Southam AD. Monitoring cancer prognosis, diagnosis and treatment efficacy using metabolomics and lipidomics. Metabolomics. 2016;12:146. [DOI] [PMC free article] [PubMed] [Google Scholar]
- 19. Vander Heiden MG. Targeting cancer metabolism: a therapeutic window opens. Nat Rev Drug Discov. 2011;10:671–684. [DOI] [PubMed] [Google Scholar]
- 20. Everett JR. NMR‐based pharmacometabonomics: a new paradigm for personalised or precision medicine. Prog Nucl Magn Reson Spectrosc. 2017;102–103:1–14. [DOI] [PubMed] [Google Scholar]
- 21. Duarte IF, Stanley EG, Holmes E, et al. Metabolic assessment of human liver transplants from biopsy samples at the donor and recipient stages using high‐resolution magic angle spinning 1H NMR spectroscopy. Anal Chem. 2005;77:5570–5578. [DOI] [PubMed] [Google Scholar]
- 22. Benahmed MA, Santelmo N, Elbayed K, et al. The assessment of the quality of the graft in an animal model for lung transplantation using the metabolomics 1H high‐resolution magic angle spinning NMR spectroscopy. Magn Reson Med. 2012;68:1026–1038. [DOI] [PubMed] [Google Scholar]
- 23. Choi C, Ganji SK, DeBerardinis RJ, et al. 2‐hydroxyglutarate detection by magnetic resonance spectroscopy in IDH‐mutated patients with gliomas. Nat Med. 2012;18:624–629. [DOI] [PMC free article] [PubMed] [Google Scholar]
- 24. Imperiale A, Moussallieh F‐M, Roche P, et al. Metabolome profiling by HRMAS NMR spectroscopy of pheochromocytomas and paragangliomas detects SDH deficiency: clinical and pathophysiological implications. Neoplasia. 2015;17:55–65. [DOI] [PMC free article] [PubMed] [Google Scholar]
- 25. Loening NM, Chamberlin AM, Zepeda AG, Gonzalez RG, Cheng LL. Quantification of phosphocholine and glycerophosphocholine with 31P edited 1H NMR spectroscopy. NMR Biomed. 2005;18:413–420. [DOI] [PubMed] [Google Scholar]
- 26. Rocha CM, Barros AS, Goodfellow BJ, et al. NMR metabolomics of human lung tumours reveals distinct metabolic signatures for adenocarcinoma and squamous cell carcinoma. Carcinogenesis. 2015;36:68–75. [DOI] [PubMed] [Google Scholar]
- 27. Piotto M, Moussallieh FM, Neuville A, Bellocq JP, Elbayed K, Namer IJ. Towards real‐time metabolic profiling of a biopsy specimen during a surgical operation by 1H high resolution magic angle spinning nuclear magnetic resonance: a case report. J Med Case Rep. 2012;6:22. [DOI] [PMC free article] [PubMed] [Google Scholar]
- 28. Cicek AE, Bederman I, Henderson L, Drumm ML, Ozsoyoglu G. ADEMA: an algorithm to determine expected metabolite level alterations using mutual information. PLoS Comput Biol. 2013;9:e1002859. [DOI] [PMC free article] [PubMed] [Google Scholar]
- 29. Xia J, Bjorndahl TC, Tang P, Wishart DS. MetaboMiner—semi‐automated identification of metabolites from 2D NMR spectra of complex biofluids. BMC Bioinformatics. 2008;9:507. [DOI] [PMC free article] [PubMed] [Google Scholar]
- 30. Lopez‐Kolkovsky AL, Mériaux S, Boumezbeur F. Metabolite and macromolecule T1 and T2 relaxation times in the rat brain in vivo at 17.2T. Magn Reson Med. 2016;75:503–514. [DOI] [PubMed] [Google Scholar]
Associated Data
This section collects any data citations, data availability statements, or supplementary materials included in this article.
Supplementary Materials
FIGURE S1 Simplified metabolite pathways used in our laboratory


