Abstract
Peribiliary glands (PBG) are a source of stem/progenitor cells organized in a cellular network encircling large bile ducts. Severe cholangiopathy with loss of luminal biliary epithelium has been proposed to activate PBG, resulting in cell proliferation and differentiation to restore biliary epithelial integrity. However, formal evidence for this concept in human livers is lacking. We therefore developed an ex vivo model using precision‐cut slices of extrahepatic human bile ducts obtained from discarded donor livers, providing an intact anatomical organization of cell structures, to study spatiotemporal differentiation and migration of PBG cells after severe biliary injury. Postischemic bile duct slices were incubated in oxygenated culture medium for up to a week. At baseline, severe tissue injury was evident with loss of luminal epithelial lining and mural stroma necrosis. In contrast, PBG remained relatively well preserved and different reactions of PBG were noted, including PBG dilatation, cell proliferation, and maturation. Proliferation of PBG cells increased after 24 hours of oxygenated incubation, reaching a peak after 72 hours. Proliferation of PBG cells was paralleled by a reduction in PBG apoptosis and differentiation from a primitive and pluripotent (homeobox protein Nanog+/ sex‐determining region Y‐box 9+) to a mature (cystic fibrosis transmembrane conductance regulator+/secretin receptor+) and activated phenotype (increased expression of hypoxia‐inducible factor 1 alpha, glucose transporter 1, and vascular endothelial growth factor A). Migration of proliferating PBG cells in our ex vivo model was unorganized, but resulted in generation of epithelial monolayers at stromal surfaces. Conclusion: Human PBG contain biliary progenitor cells and are able to respond to bile duct epithelial loss with proliferation, differentiation, and maturation to restore epithelial integrity. The ex vivo spatiotemporal behavior of human PBG cells provides evidence for a pivotal role of PBG in biliary regeneration after severe injury.
Abbreviations
- cDNA
complementary DNA
- CFTR
cystic fibrosis transmembrane conductance regulator
- CK19
cytokeratin 19
- Glut‐1
glucose transporter 1
- HIF1‐α
hypoxia‐inducible factor 1 alpha
- KHB
Krebs‐Henseleit buffer
- EpCAM
epithelial cell adhesion molecule
- Nanog
homeobox protein Nanog
- PBG
peribiliary gland
- PCNA
proliferating cell nuclear antigen
- Sox9
sex‐determining region Y‐box 9
- VEGF‐A
vascular endothelial growth factor A
- VEGFR
vascular endothelial growth factor receptor
The peribiliary glands (PBG) of large intrahepatic and extrahepatic bile ducts appear as a three‐dimensional network of interconnected acini and ducts draining into the biliary lumen. PBG have been shown to contain cell types with pluripotent properties, typical of stem/progenitor cells.1 Recent advances have unraveled the phenotypical heterogeneity of PBG along the extrahepatic and large intrahepatic bile ducts, and PBG have been proposed as a key element in the pathophysiology of liver, pancreas, and bile duct.2, 3 In this concept, PBG are activated upon injury and driven by molecular pathways to restore the compromised integrity of the luminal biliary epithelium in various cholangiopathies.
Up to now, the activation of PBG has been observed in patients with hepatolithiasis, primary sclerosing cholangitis, and posttransplant cholangiopathies.3, 4, 5, 6 Our understanding of PBG and their behavior in pathological conditions is based on findings in cross‐sectional studies, animal studies, and cell cultures. These models have not provided definite proof of the functional and morphological recovery of the biliary epithelial lining by a coordinated response of PBG cells after severe injury of the large bile ducts in humans. Further studies to investigate the molecular interactions of PBG in the context of pathological conditions are hampered by a lack of experimental models in which the proliferation, migration, and maturation of human PBG cells can be studied.
The aim of the current study was to develop an ex vivo human model to recapitulate the cellular organization of the PBG niche within the human bile duct, thus allowing the spatiotemporal study of PBG proliferation, maturation, and migration in regeneration processes after injuries. Specifically, we used this model to explore the role of PBG cells in the postischemic recovery of bile ducts, as may occur after liver transplantation.
Materials and Methods
Donor Livers
Bile duct tissue was obtained from 16 adult human donor livers that were declined for transplantation within the Eurotransplant area. All livers were procured as part of a multiorgan donation procedure using a standard technique of in situ cooling and flush‐out with ice‐cold University of Wisconsin preservation fluid. During procurement, the cystic duct was ligated and bile ducts gently flushed retrograde with preservation fluid. Livers were transported to our center using static cold storage.
The use of donor livers for research was approved by the medical ethical committee of the University Medical Center Groningen and the “Nederlandse Transplantatie Stichting,” the competent authority for organ donation in the Netherlands. In all cases, informed consent was obtained from donor families to use the livers for research purposes. None of the donor organs used in this study were obtained from executed prisoners or other institutionalized persons.
Preparation of Bile Duct Segments
Upon arrival of a donor liver at our center, the large intrahepatic and extrahepatic bile ducts were dissected and removed while maintaining constant cooling of the tissue. Surrounding (adipose) tissue was carefully removed while avoiding manipulation of the bile duct wall. Bile duct dissection occurred from the distal end of the common bile duct until proximal of the biliary bifurcation to the right and left hepatic ducts. Main parts of the right and left hepatic ducts were included (Fig. 1). Subsequently, the dissected bile ducts were cut in segments of approximately 15 mm to be fixed in 3% low‐melting agarose (wt/vol) solution (Sigma‐Aldrich, Steinheim, Germany) in 0.9% NaCl at 37°C in cylindrical cores. The cores were positioned in an embedding unit filled with crushed ice. Due to the cooling, the agarose solidified and a solid‐like structure was created, suited for slicing. Simultaneously, Krebs‐Henseleit buffer (KHB) solution was prepared and kept at 0‐4°C on melting ice.7 The KHB solution was oxygenated with 95% O2 /5% CO2 for 30 minutes and adjusted to a pH of 7.4.
Figure 1.
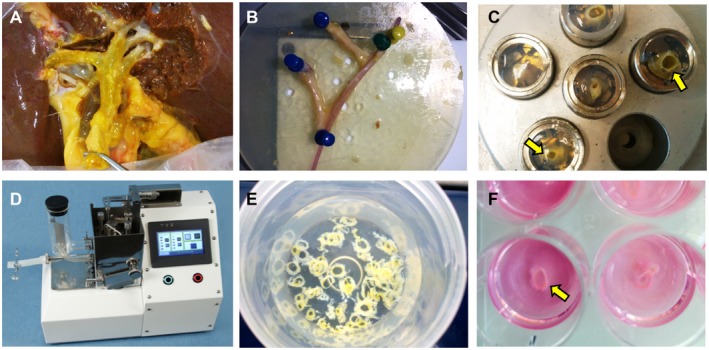
Photographic details of the precision‐cut bile duct slicing procedure in chronological order. (A) A discarded liver positioned in the cold embedding unit for dissection of the large bile ducts. (B) An isolated bile duct segment including the hepatic bifurcation after dissection. A small probe is passed through the main bile duct lumen. (C) Bile duct segments embedded in cores filled with low‐melting agarose. Small segments of the bile duct are situated vertically in the agarose and indicated by arrows. (D) Krumdieck tissue slicer. (E) Bile duct slices collected in cold oxygenated Krebs‐Henseleit buffer solution. (F) 12‐well culture plate filled with Williams medium E, supplemented with glucose and antibiotics. Each well contains one precision‐cut bile duct slice (arrow).
Precision‐Cut Bile Duct Slicing Procedure
A Krumdieck tissue slicer (Alabama Research and Development, Munford, AL) filled with ice‐cold KHB solution was used for precision‐cut bile duct slicing.8 Blade and arm speed were adjusted to the tissue strength. The tissue slices were collected in ice‐cold oxygenated KHB solution.
Incubation of Bile Duct Slices
Biliary slices were transferred from the cold oxygenated KHB solution to prewarmed oxygenated 12‐well plates filled with 1.3 mL Williams’ medium E glutamax‐I (Gibco, Paisley, United Kingdom) containing 1.1 g/mL of D‐glucose and 2 mg/mL ciprofloxacin per well (Fig. 1). Slices at baseline were harvested directly after the slicing procedure. Plates with slices were placed in a shaking incubator (shaking at 90 cycles per minute at 37°C) under continuous supply of 80% O2 /5% CO2.9 Thereafter, every 24 hours, the medium was refreshed and slices were harvested for immunohistochemistry and for real‐time quantitative PCR for up to 144 hours. For immunohistochemistry, harvested slices were fixed in 10% buffered formalin and embedded in low‐temperature fusion paraffin (55°C‐57°C), and 3‐4‐µm sections were prepared and mounted on glass slides for histological and immunohistochemical assessment. For real‐time quantitative PCR, harvested slices were preserved in 400 mL of RNAlater solution (Sigma‐Aldrich, Steinheim, Germany), snap‐frozen, and stored at −80°C.
Histology and Immunohistochemistry
Sections were prepared for hematoxylin and eosin staining for histological assessment. For immunohistochemistry, tissue sections were deparaffinized through a graded alcohol series and rinsed in phosphate‐buffered saline (PBS; pH 7.4). Stainings for epithelial cell adhesion molecule (EpCAM) and calretinin were applied using an automated immunohistologic staining system (BenchMark ULTRA; Roche Ventana Medical Systems, Tucson, AZ) and by applying the Ultraview DAB detection kit of the same company. Regarding all other stainings: Endogenous peroxidase activity was blocked by a 30‐minute incubation in H2O2. Antigen retrieval for cytokeratin 19 (CK19) and Ki‐67 was performed with Tris/HCl pH 9.0 buffer at 80°C overnight and Tris/ethylene diamine tetraacetic acid pH 9.0 buffer in the microwave for 15 minutes, respectively. Antigen retrieval for the other stainings was done using citrate at 90°C for 30 minutes. After cooling down of the sections and PBS wash for 5 minutes, first antibodies were applied for 1 hour (Supporting Table S1). Next, for CK19 and Ki‐67, a 30‐minute incubation was applied with peroxidase‐labeled goat anti‐rabbit antibody (for CK19) or rabbit anti‐mouse antibody (for Ki‐67) in dilution 1:100. Rabbit anti‐goat for CK19 and goat anti‐rabbit for Ki‐67 were used as third antibodies (1:100 dilution). For the other stainings, samples were incubated for 20 minutes with secondary biotinylated antibody and then Streptavidin‐HRP (LSAB+ System‐HRP, code K0690; Dako). The staining reaction was developed by 3,3′‐diaminobenzidine and counterstained with hematoxylin. Images of the sections were scanned and subsequently analyzed using Aperio ImageScope software (version 11.0.2.725; Aperio Technologies, Vista, CA). Ki‐67 stainings were used to measure the proliferation index in each slide. All PBG cells were manually counted in the slices. Proliferation index was calculated as Ki‐67‐positive PBG cells relative to all PBG cells in the slide:
For immunofluorescence, nonspecific protein binding was blocked by 5% normal goat serum. Specimens were incubated with primary antibodies. Cells were washed and incubated for 1 hour with labeled isotype‐specific secondary antibodies (anti‐mouse AlexaFluor‐546, anti‐mouse AlexaFluor‐488, anti‐rabbit AlexaFluor‐488, anti‐goat AlexaFluor‐546; Invitrogen, Life Technologies Ltd, Paisley, United Kingdom) and counterstained with 4′,6‐diamidino‐2‐phenylindole for visualization of cell nuclei. To perform double immunofluorescence with two mouse primary antibodies, we followed a three‐step protocol as previously described10: Sections were incubated with anti‐vascular endothelial growth factor receptor (VEGFR) 2; then, an anti‐mouse secondary fluorescent antibody (AlexaFluor‐488) was applied; finally, the antibody for cluster of differentiation 31 was prelabeled with a fluorophore using the APEX‐594 labeling kit (Invitrogen, catalog #A10474) and was applied to the section. All antibodies were diluted (1:50) and incubated at room temperature for 1 hour. For all immunoreactions, negative controls (the primary antibody was replaced with preimmune serum) were also included. Sections were examined in a coded fashion by Leica Microsystems DM 4500 B Light and Fluorescence Microscopy (Weltzlar, Germany), equipped with a Jenoptik Prog Res C10 Plus Videocam (Jena, Germany). Immunofluorescence stainings were also analyzed by confocal microscopy (Leica TCS‐SP2). Slides were further processed with an Image Analysis System (Delta Sistemi, Rome, Italy). Expression of cleaved caspase‐3 and vascular endothelial growth factor A (VEGF‐A) was independently evaluated by two researchers (E.G. and G.C.) in a blinded fashion using a semiquantitative scoring system.11 Briefly, when 0%‐5% of the bile ducts were positive, we assigned a negative score; a ± score was assigned when 6%‐10% of the bile ducts were positive; a + score was assigned when 11%‐30% of the bile ducts were positive; a ++ score was assigned when 31%‐50% of the bile ducts were positive; and a +++ score was assigned when more than 50% of the bile ducts were positive. Quantification of sex‐determining region Y‐box 9 (Sox9) and proliferating cell nuclear antigen (PCNA) expression was performed calculating the percentage positive PBG cells. Similarly, Sox9+ or Sox9‐ PBG cells coexpressing PCNA/cleaved caspase‐3 were calculated as percentage positive PCNA/cleaved caspase‐3 cells with respect to all Sox9+ or all Sox9‐ cells. All histological analyses were supervised by an experienced hepato‐pathologist (A.S.H.G.).
Real‐Time Quantitative PCR
Biliary mRNA expression of relevant genes was determined by real‐time quantitative PCR. RNA was isolated from bile duct slices that were snap‐frozen and stored at ‐80°C. Total RNA was extracted using RNAaesy mini kit (Qiagen, Venlo, the Netherlands) according to the manufacturer’s instructions. An additional step for purification of nucleic acid extraction in the protocol was performed using phenol‐chloroform‐isomylalcohol (Sigma‐Aldrich, Steinheim, Germany; code 77617) and chloroform‐isomylalcohol (Sigma‐Aldrich, Steinheim, Germany; code 25666) after homogenization of the tissue. RNA concentrations were measured on a NanoDrop ND‐1000 full‐spectrum (220‐750 nm) spectrophotometer (Thermo Scientific, Wilmington, MA). Single‐stranded complementary DNA (cDNA) was synthesized using Reverse Transcriptase System (Promega, Leiden, the Netherlands) according to the manufacturer’s instructions in a total volume of 20 μL. cDNA was diluted to a concentration of 2 ng/μL for real‐time quantitative PCR analysis. PCR reactions were performed in duplicate in 10‐μL reaction volume containing 5 μL TaqMan real‐time quantitative PCR mastermix (Eurogentic, Liege, Belgium) and 5 μL cDNA. The following predesigned TaqMan primers were used: CK19 (Hs00761767_S1), Nanog (Hs02387400_g1), and CFTR (Hs00357011_m1), obtained from Applied Biosystems. Thermal cycling and fluorescence detection were performed on a ViiATM 7 Real‐Time PCR system (Applied Biosystems). Expression levels were corrected using glyceraldehyde 3‐phosphate dehydrogenase as reference gene (ΔCt) and compared with baseline (ΔΔCt). Results are displayed as fold change (2−ΔΔCt).
Statistical Analyses
Continuous variables were expressed as mean ± SEM. Categorical variables were presented as number and percentage. Continuous variables were compared between time points with a paired t test. GraphPad Prism 7 (GraphPad Software, La Jolla, CA) was used for presenting data in graphs. All statistical analyses were performed using SPSS software version 23 for Windows (SPSS, Inc., Chicago, IL).
Results
Preparation of Precision‐Cut Bile Duct Slices
Donor characteristics of the 16 discarded donor livers used in the experiments are presented in Supporting Table S2. All livers but one were obtained from donation after circulatory death donors. The main reasons that livers were declined for transplantation were advanced age or steatosis in combination with donation after circulatory death. The average length of the dissected bile duct segment was 8 cm. Per bile duct segment, a minimum of 80 bile duct slices with a thickness of approximately 300 µm were obtained (Fig. 1).
PBG and Stromal Injury After Ischemia and Reoxygenation of Human Bile Duct Slices
The mean cold ischemic period before oxygenated incubation of precision‐cut bile duct slices was 649 ± 66 minutes. Baseline histology of bile ducts revealed severe tissue injury with complete loss of luminal biliary epithelial lining and mural stroma necrosis. In contrast, PBG cells were relatively well preserved with fewer signs of cell death at baseline (Figs. 2C, 3A). Morphology of PBG during incubation varied from a well‐preserved cellular phenotype and architecture to total destruction of cells, causing collections of empty acini with cell debris, suggesting a process of necrosis. Some PBG showed dilatation, which appeared with or without necrotic PBG collections in the same section (Fig. 2A). Strikingly, at baseline, PBG were organized in compact clusters with small PBG cells, whereas at later time points PBG acini were found to be more separated (Fig. 3A). A significantly shorter distance between PBG was calculated at baseline (18 μm ± 0.04) compared with 72 hours of incubation (73 μm ± 0.15; P = 0.001). Immunohistochemical evidence of cleaved caspase‐3 expression was found for both PBG and surrounding stromal cells, indicating the activation of apoptotic cell death (Fig. 2B). After oxygenated incubation, expression of cleaved caspase‐3 in PBG cells was significantly lower at 72 and 144 hours, compared with baseline (P = 0.036) (Fig. 2B). The percentage of vital PBG cells increased slightly after baseline and remained around 50% up to 144 hours of incubation. In contrast, the percentage of vital surface epithelial cells increased from 0% to 32% during 144 hours of incubation (Fig. 2C). Some of the PBG collections were surrounded by a concentric organization of stroma (Fig. 2A) composed of alpha‐smooth muscle actin–positive (desmin and caldesmon negative) myofibroblasts (Figs. 2D, 3B). Immunohistochemistry for von Willebrand factor showed the presence of vessels within the duct wall stroma and near PBG (Fig. 2E). Some vessels displayed signs of damage, characterized by dilatation and loss of endothelial cells. In general, the presence of stromal cells (myofibroblasts and vessels) in the bile duct slices indicated an almost intact anatomical organization of the tissue. Furthermore, the response of PBG to hypoxic conditions was studied by investigating expression of a postischemic restorative response (i.e., hypoxia‐inducible factor 1 alpha [HIF‐1α], glucose transporter 1 (Glut‐1), and VEGF‐A). PBG showed increased expression of the hypoxia markers HIF‐1α (at a nuclear level), Glut‐1, and VEGF‐A over time (Fig. 4A‐C), thus suggesting the activation of HIF‐dependent and proangiogenic pathways. When VEGFR expression was studied, PBG were positive for VEGFR‐1 and R‐2, suggesting both an autocrine effect and a paracrine stimulation of neighboring VEGFR‐2+ (CD31+) endothelial cells (Fig. 4D).
Figure 2.
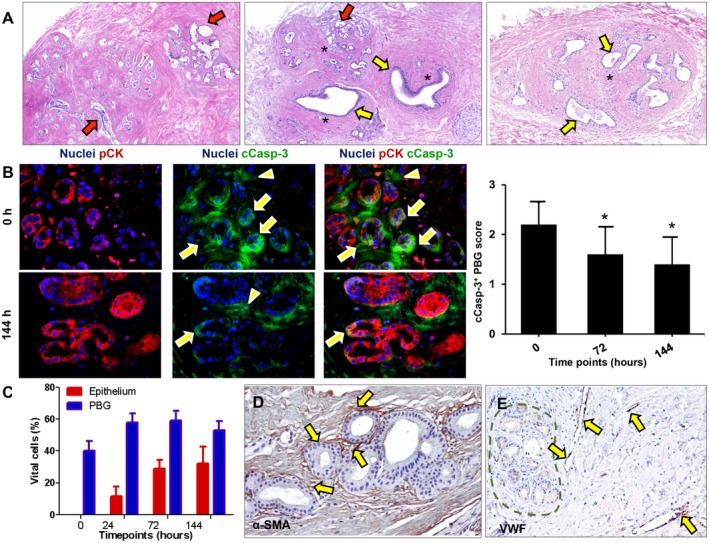
Bile ducts that were subjected to severe ischemia and subsequent reoxygenation showed cell death and PBG dilatation. (A) Hematoxylin and eosin staining showing necrotic PBG leaving cell debris in the empty acini (red arrows). In addition, PBG dilatation occurred in specific glands (yellow arrows). In some sections, both cell death and dilatation were present in proximate PBG collections (central image). Some PBG collections were captured in a concentric formation of stromal cells (asterisks). (B) Immunofluorescence for pCK and cCasp‐3 indicated significantly less apoptosis in PBG cells after 72 hours and 144 hours of incubation compared with baseline (*P < 0.05). Cleaved caspase‐3 was expressed by the PBG cells (arrows) as well as around the PBG cells in the stroma (arrowheads). Nuclei are displayed in blue. (C) Quantification of the percentage of vital cells in PBG and epithelium showing that approximately 50% of the PBG cells appeared vital during all time points, with no significant differences over time. In contrast, no luminal epithelial cells were present at baseline, yet a growth of epithelium up to 32% apparent vital cells was evident up to 144 hours of incubation. (D) Immunohistochemistry for α‐SMA illustrates presence of myofibroblasts around PBG and provides evidence for an anatomical organization of stromal cells (arrows). (E) Immunohistochemistry for VWF in endothelial cells (arrows) indicating vessels throughout the stroma in proximity of PBG (dotted line). Dilated vessels with loss of endothelial cells can be observed. (A‐C) Original magnification ×10. (D,E) Original magnification ×20. Abbreviations: α‐SMA, alpha‐smooth muscle actin; cCasp‐3, cleaved caspase‐3; h, hours; pCK, pan cytokeratin; VWF, von Willebrand factor.
Figure 3.
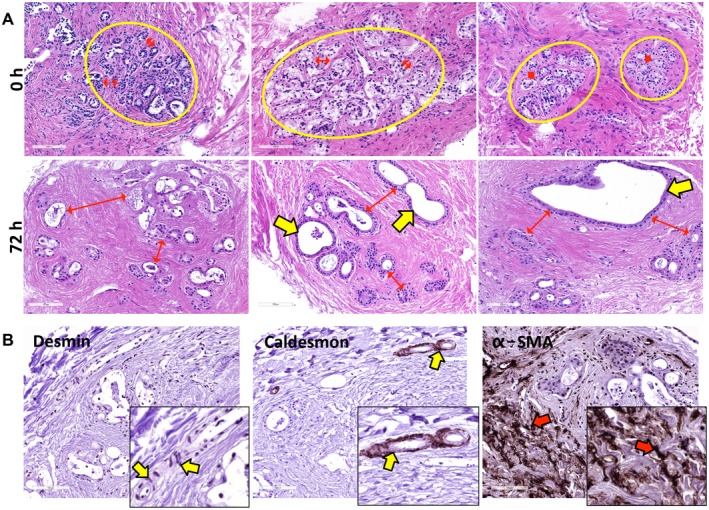
Stromal and PBG (re‐)organization during incubation. (A) At baseline, small PBG acini were organized in compact clusters (yellow circles) and were located close to each other (red arrows). After 72 hours of incubation, PBG acini showed greater distance between each other (red arrows) and evident dilatation (yellow arrows). (B) Desmin and caldesmon expression was restricted to smooth muscle cells around arteries (yellow arrows); conversely, no expression of these markers was observed in α‐SMA‐positive stromal cells (red arrows). These data confirm that the stromal reorganization around PBG clusters was characterized by α‐SMA‐positive myofibroblasts (red arrows). (B) Original magnification ×20. Abbreviations: α‐SMA, alpha‐smooth muscle actin; h, hours.
Figure 4.
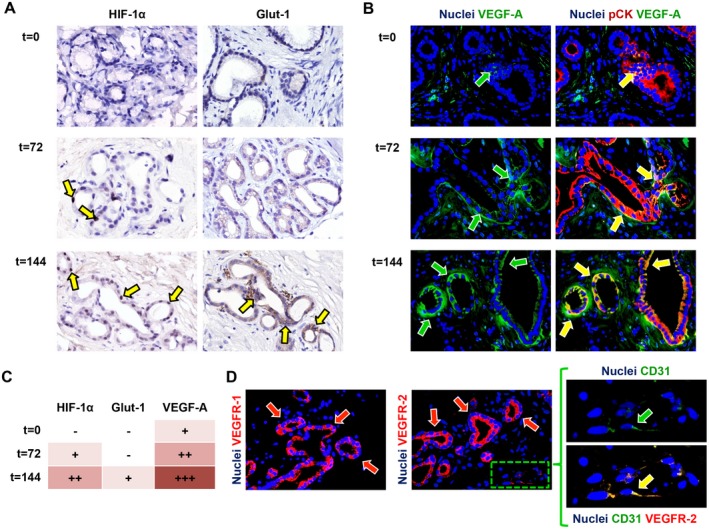
Activation of angiogenic factors during incubation. (A) Immunohistochemistry for the hypoxic response markers HIF‐1α and Glut‐1 showed up‐regulation during incubation (yellow arrows). (B) Correspondingly, VEGF‐A expression increased over time (green arrows) and was expressed by pCK‐positive PBG cells (yellow arrows). (C) Semiquantitative evaluation of angiogenic factor expression in PBG cells showed up‐regulation of HIF‐1α, Glut‐1, and VEGF‐A over time. (D) VEGF receptors VEGFR‐1 and VEGFR‐2 were expressed by PBG cells (red arrows) and CD31‐positive endothelial cells (green arrow) expressed VEGFR‐2 at their cell membrane. Area in the box is magnified on the right and separate channels are provided. (A‐C) Original magnification ×40. Abbreviations: CD31, cluster of differentiation 31; pCK, pan cytokeratin.
Proliferation of PBG Cells is Associated With Regeneration of Epithelial Monolayers
Immunohistochemistry for Ki‐67 revealed that whereas no proliferating PBG cells were present at baseline, during the culture period a substantial amount of proliferating cells within the PBG was observed. We quantified the extent of PBG proliferation by calculating the proliferation index (Fig. 5A). Proliferating cells appeared within the first 24 hours after reoxygenation, after which the proliferation index increased and peaked at 72 hours of incubation and then gradually declined. From 48 hours onward, the proliferation index was significantly higher compared with baseline (P = 0.004). In parallel, regeneration of CK19‐positive epithelium was observed after 144 hours and quantification of CK19 expression showed a pattern reminiscent of the PBG proliferation index, suggesting an increase of biliary epithelial cells due to PBG cell proliferation (Fig. 5B). In addition, epithelial monolayers in proximity of PBG collections were formed at an open space within the section after 144 hours of incubation, suggesting that proliferating PBG cells migrated to create epithelial layers at any tissue surface that was encountered (Fig. 5C). In support of this, newly formed epithelial monolayers appeared at the luminal and basolateral side of the slices at 72 hours of incubation (Fig. 6A‐E). To confirm that the newly formed monolayers at basolateral sides were epithelium and not mesothelium, we stained the slices for EpCAM and calretinin, which are specific for epithelium and mesothelium, respectively. Monolayers at all stroma surfaces were EpCAM positive and calretinin negative, confirming the regeneration of epithelium at several sides in the tissue (Fig. 6D,E). Collectively, these findings suggest that ischemia and subsequent reoxygenation induced severe damage to biliary epithelial cells, but the residual PBG cells were able to proliferate and replenish the lost cells (Fig. 5D).
Figure 5.
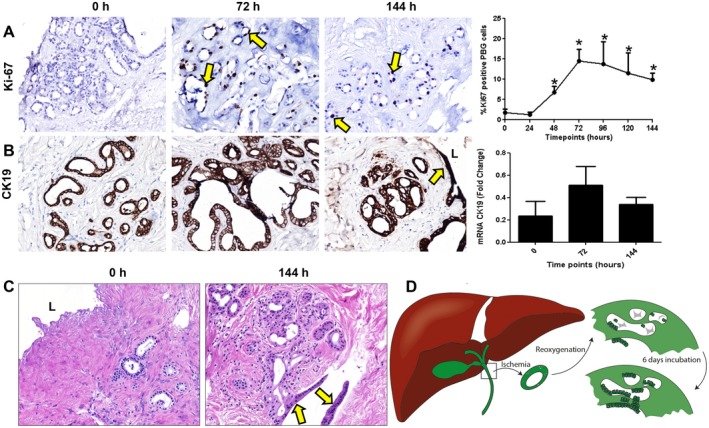
PBG proliferation and regeneration after ischemia‐induced epithelial cell loss. (A) Immunohistochemistry for Ki‐67 showed mitotic activity after 24 hours of incubation. PBG proliferation index increased significantly after 24 hours, peaked at 72 hours, and remained constant until 144 hours of incubation, compared with baseline (*P < 0.05). (B) Immunohistochemistry for biliary epithelial marker CK19 showed that PBG and biliary epithelium expressed CK19 during all time points. The pattern of the relative number of CK19 expressing cells resembled that of proliferation. (C) Hematoxylin and eosin staining displaying complete loss of epithelial layer at baseline and regeneration of an epithelial monolayer after 144 hours of incubation. This monolayer appeared at the surface of an open place within the stroma (yellow arrows). (D) Schematic overview and summary of the observed biliary damage and cellular reaction after ischemia and subsequent reoxygenation. After ischemia and reoxygenation, the biliary epithelium was generally detached and PBG were necrotic. Directly after reoxygenation, PBG showed cell debris in the acini with a few residual PBG cells. After 6 days of oxygenation, proliferation, refilled PBG, and regeneration of the epithelium were evident. (A) Original magnification ×10. (B,C) Original magnification ×20. Abbreviations: h, hours, L, lumen.
Figure 6.
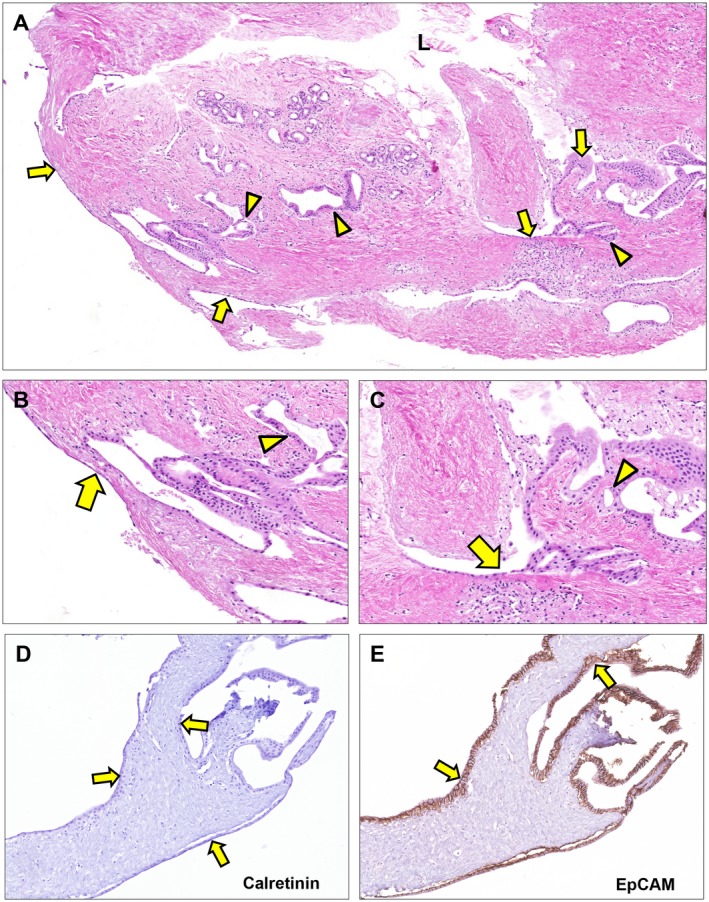
Epithelial regeneration after 72 hours of ex vivo culture. (A‐C) Hematoxylin and eosin staining. Epithelial lining appeared at the luminal surface as well as at the basolateral surface (arrows). These epithelial patches are in proximity of PBG (arrowheads) suggesting newly formed epithelium driven from PBG to restore the uncovered surface at several sides throughout the tissue slice. (D) Epithelial lining at basolateral and luminal side of the bile duct slice appeared negative for calretinin, which is specific for mesothelium (arrows). (E) All cells lining the basolateral and luminal side of the bile duct slice expressed EpCAM, confirming that the (re)generated monolayers consisted of epithelial cells (arrows). (A) Original magnification ×5. (B,C) Original magnification ×20. (D,E) Original magnification ×15. Abbreviation: L, lumen.
Change of PBG Phenotype Indicating Maturation During Proliferation and Regeneration
In general, 30%‐50% of the PBG contained Sox9‐expressing cells during all time points, indicating an endoderm progenitor phenotype (Fig. 7A). To explore maturation of proliferating and migrating PBG cells, we performed real‐time quantitative PCR to assess mRNA expression for homeobox protein Nanog (Nanog), a transcription factor critically involved with self‐renewal of undifferentiated stem cells, and mRNA expression of cystic fibrosis transmembrane conductance regulator (CFTR), a transporter that characterizes mature cholangiocytes. Relative Nanog gene expression decreased over time with a significant reduction at 144 hours of oxygenated incubation, compared with baseline (P = 0.001) (Fig. 7B). Presence of cells with nuclear Nanog positivity within PBG was also confirmed by immunohistochemistry (Fig. 7B). In contrast to Nanog, relative CFTR gene expression increased over time and levels were significantly higher at 144 hours compared with baseline (P = 0.025). Accordingly, the ratio between CFTR and Nanog gene expression increased over time, indicating an overall differentiation from primitive and pluripotent to mature phenotype (Fig. 7D). The increased gene expression of CFTR was paralleled by a progressively more extensive apical immunofluorescence staining of CFTR at 72 hours and 144 hours, compared with baseline (Fig. 7C). Maturation of proliferating pluripotent PBG cells into adult cholangiocytes was confirmed by the expression of secretin receptor, which mostly appeared after 144 hours (Fig. 7E). Changes in Nanog and CFTR expression were evident at 24 hours, which coincided with the initiation of PBG proliferation as demonstrated by Ki‐67 expression (Fig. 5A). Additionally, preservation of radial organized PBG has been studied in the present ex vivo model. Deep and periluminal PBG were phenotypically characterized in terms of Sox9 and PCNA expression (Fig. 8A). PBG located in the deeper position were characterized by a higher expression of Sox9 and PCNA compared with periluminal‐located PBG in continuity with luminal epithelium. Luminal epithelium was almost Sox9‐ and devoid of proliferating PCNA+ cells. In addition, Sox9+ PBG were characterized by a significantly higher proliferation index (i.e., percentage of PCNA positivity; Fig. 8B) and lower cleaved caspase‐3 expression compared with Sox9‐ PBG cells (Fig. 8C), thus indicating that progenitor cells were less likely to be affected by apoptosis.
Figure 7.
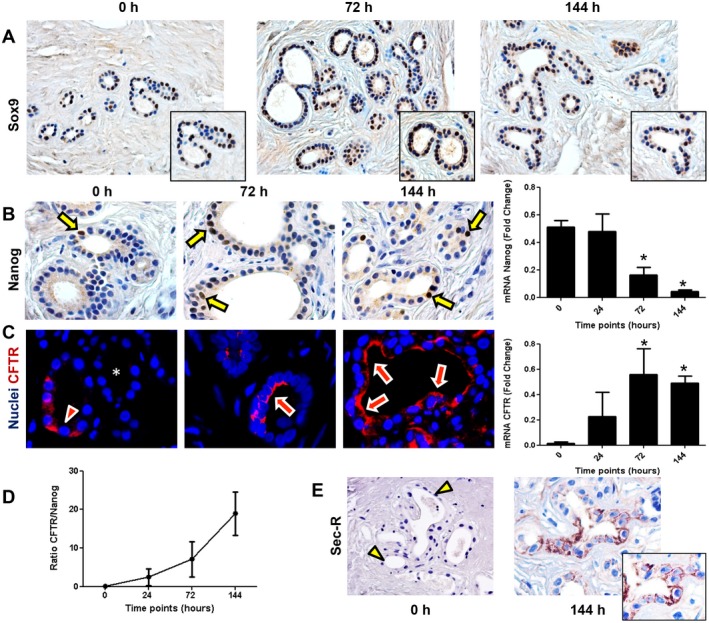
Cell maturation during 144 hours of oxygenated incubation of bile duct slices. (A) Immunohistochemistry for endoderm progenitor marker Sox9 showed expression in PBG cells at all time points. (B) Immunohistochemistry demonstrated the presence of Nanog‐positive cells at a nuclear level (arrows) within PBG. Only pluripotent and primitive cells expressed Nanog; this cell population decreased over time and was significant lower after 144 hours of incubation (*P < 0.05). (C) Immunofluorescence for CFTR, expressed by mature biliary cells, showed less evident apical expression at baseline (arrowhead) and in some PBG no expression (asterisk) compared with PBG cells after 72 hours and 144 hours of incubation (arrows). Nuclei are displayed in blue. Real‐time quantitative PCR confirmed that CFTR gene expression increased over time and was significant after 144 hours of incubation compared with baseline (*P < 0.05). (D) Ratio between CFTR and Nanog increased during incubation, indicating maturation of the viable cells in the bile duct slices. (E) Immunohistochemistry for Sec‐R. Secretin receptor expression of PBG cells appeared after 144 hours of incubation (arrow). At baseline, PBG were almost negative for secretin receptor (arrowheads). (A,E) Original magnification ×20. (B,C) Original magnification ×40. Abbreviations: h, hours; Sec‐R, secretin receptor.
Figure 8.
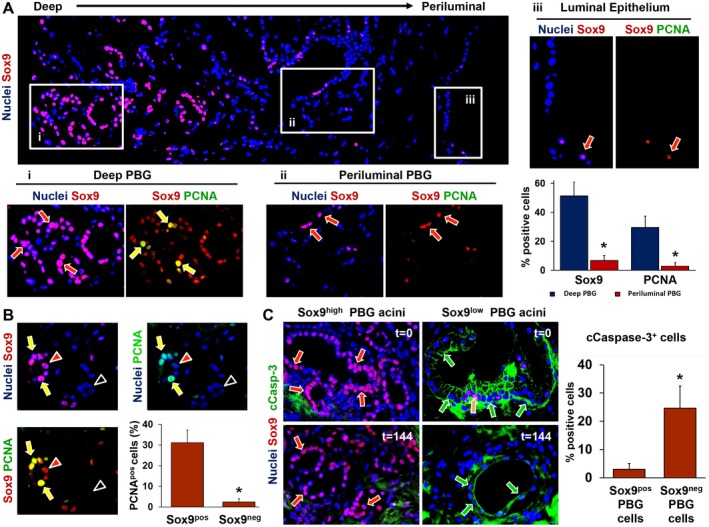
Immunophenotype of deep and periluminal PBG. (A) Immunofluorescence for Sox9, which identifies endoderm‐derived progenitor cells, showed that PBG located in deeper position (i) with respect to the luminal epithelium were characterized by higher expression of Sox9 compared with PBG acini located in a periluminal position (ii) and in continuity with luminal epithelium (iii). Sox9+ cells (red arrows) coexpressed the proliferation marker PCNA, merely in the deeper‐located PBG (i: yellow arrows). Periluminal PBG showed less Sox9 expression and almost no PCNA expression (ii: red arrows). The luminal epithelium (iii) showed rare Sox9+ cells (red arrow) and negligible levels of PCNA. The corresponding graph shows that both Sox9 and PCNA expression were significantly higher in deeper PBG, compared with periluminal PBG. (B) Specifically, PBG acini with Sox9‐ cells expressed no PCNA (black arrowheads) and acini with abundant Sox9 expression stained positive for PCNA (yellow arrows). Red arrowheads point toward Sox9+ cells that were PCNA negative. Almost all PCNA+ cells were Sox9+ as displayed in the graph, confirming that the proliferating cell population consisted of mainly progenitor cells. (C) PBG harboring Sox9+ cells (red arrows) were less positive for the apoptosis marker cCasp‐3. PBG harboring mainly Sox9‐ cells and a few Sox9+ cells (yellow arrow) showed marked expression of cleaved caspase‐3 (green arrows). This was evident during all time points. Quantification of Sox9/cCasp‐3 coexpression revealed significantly higher expression of cCasp‐3 in Sox9‐ PBG cells, compared with Sox9+ PBG cells. (A) Original magnification ×10. Area in the boxes is magnified at ×20. (B,C) Original magnification ×20. Abbreviation: cCasp‐3, cleaved caspase‐3.
Discussion
This study provides evidence that supports the concept of proliferation, maturation, and migration of PBG‐derived cells toward mature cholangiocytes after severe bile duct injury. It also provides evidence that PBG play a role in the restoration of biliary epithelial lining after severe bile duct injury in the human liver.
The main observations of this study indicate that after severe ischemia‐induced bile duct wall injury and luminal biliary epithelial cell loss, PBG cells are relatively spared and remain viable. Although some PBG are affected and react with dilatation, necrosis, and apoptosis, surviving PBG respond with proliferation and regeneration of the epithelial lining, paralleled by a concentric organization of myofibroblasts and activation of HIF and VEGF signaling. During this process, PBG‐derived cells change from a primitive and pluripotent phenotype located in the deeper layers of the bile duct wall to a mature biliary epithelial cell phenotype near the luminal surface.
In the present study, we used a model to assess the spatiotemporal activation of PBG cells and biliary epithelial regeneration after severe injury, including loss of the luminal biliary epithelial lining, of large human bile ducts. Other models that have aimed to study activation of the biliary stem cell compartment and thereby attempted to recapitulate the human situation included lineage‐tracing studies in mice and organoid systems.12, 13 Whereas lineage tracing is restricted to animal models, organoid systems fail to capture the actual human anatomical organization of various cell types, including stromal cells, endothelium, and PBG cells.14 With the described model of precision‐cut bile duct slices, we succeeded in providing an ex vivo situation with an intact anatomical organization of cellular structures using human tissue, avoiding the limitations of the aforementioned research models.
Until recently, PBG were mainly considered secretory glands, producing mucus and humoral factors relevant for maintaining a healthy biliary epithelium.15 However, over the past decade, PBG cells have been characterized in more detail and stem cell properties of PBG have come to light.1, 3, 16, 17 Although marked proliferation of PBG in the context of large bile duct pathologies has been described for hepatolithiasis, for primary sclerosing cholangitis, and after ischemia,4, 5, 6 today’s view on PBG and their counterparts in the pancreas and liver suggests that several other hepato‐pancreato‐biliary diseases are also linked with these progenitor cell compartments.2, 18, 19 In support of this, the current ex vivo study demonstrated the central role of PBG in bile duct recovery after severe ischemic damage.
We found a specific pattern of PBG cell proliferation with a noticeable increase in the first 24 hours after reoxygenation of ischemically injured human bile ducts. These findings are in accordance with previous observations in animal models of other types of cholangiopathy. In a model of mechanically induced bile duct injury in guinea pigs, PBG have been described as crypts and glands in which all stages of mitoses can be observed 24 hours after the injury, resulting in small patches of newly formed epithelial layers.20 In addition, pronounced PBG cell proliferation has been described 24 hours after bile duct ligation in mice.21
In our ex vivo model of human precision‐cut bile duct slices, patches of newly formed epithelial cell layers appeared in the proximity of PBG collections, yet at both the basolateral and luminal side of the slices. The formation of new epithelium at the basolateral sides may, at first glance, seem contradictory to the peribiliary anatomical design in which PBG cells can replenish the luminal epithelium through small connecting tubules that run transversely through the mural stroma.21 However, in our model of cultured, ultrathin bile duct slices of approximately 300 µm, connecting tubules between PBG and the central lumen may be transected, resulting in a lack of mechanical guidance for migrating PBG cells. Our observations suggest that because of the lack of navigating tubules, proliferation and migration of PBG cells in our model occurred in random directions until the migrating cells encountered an open space to line its uncovered surface.
In addition to the maturation and migration of PBG cells, we also found evidence for a change from a quiescent phenotype toward a more reactive and activated phenotype. This was illustrated by the increased expression of HIF1‐α, Glut‐1, VEGF‐A, VEGFR‐1, and VEGFR‐2 during 144 hours of oxygenated incubation. It is well known that HIF1‐α is translocated into the nucleus of the cell in response to hypoxia, leading to increased transcription of VEGF, Glut‐1, and carbonic anhydrase 9. VEGF and Glut‐1 orchestrate angiogenesis and glucose metabolism, respectively.22 Our findings suggest that hypoxia, manifest during static cold storage before oxygenated incubation, stimulated translocation of HIF1‐α and subsequent initiated proangiogenic and metabolic pathways. Interestingly, PBG express VEGF‐R, thus suggesting not only a paracrine effect on neighboring endothelial cells but also an autocrine/paracrine effect on PBG cells. This aspect parallels studies on mature cholangiocytes, indicating VEGF as a growth factor implicated in cholangiocyte proliferation.23, 24
Notably, a reorganization of stromal cells was evident during incubation, with a concentric arrangement of myofibroblasts encircling PBG clusters. In addition, the distance between PBG acini increased, suggesting stromal cell expansion within the normally compact PBG clusters. At baseline, the freshly isolated donor bile ducts presented with a normal morphology of PBG clusters: small cells forming small acini in compact clusters. However, during 144 hours of postischemic incubation, PBG started to proliferate and differentiate into mature cholangiocytes, generally recognizable by their higher cytoplasm‐to‐nucleus ratio.25 In the current study, the presence of larger PBG acini could be due to differentiation toward mature (and large) cholangiocytes. Studies on hepatic stem cells have demonstrated that lineage‐stage appropriate epithelial‐mesenchymal partners with relevant paracrine signaling are highly effective in stimulating differentiation.26, 27 In addition, differentiation of bipotent progenitor cells toward a biliary fate in the hepatic progenitor niche, known as the Canals of Hering, requires deposition of collagens.28, 29 Thus, we speculate that the observed stromal remodeling could be a consequence of proliferation and differentiation of the progenitor stem cell compartment within PBG and activation of its stromal companion in similarity with the hepatic progenitor niche behavior.
Previous studies using in vitro cell cultures of isolated PBG cells have demonstrated the ability of these cells to proliferate and differentiate into mature cell types, including hepatocytes, cholangiocytes, and pancreatic cells.1 This confirms the pluripotency of PBG along the biliary tree, which is indicative of a primitive cell type. Primitive and pluripotent cells are known to be highly resistant to ischemia and other forms of damage, compared with mature cells.30, 31 This is confirmed by our findings of a relative preservation of PBG despite massive luminal epithelial cell loss and mural stroma necrosis in ischemically injured large extrahepatic and intrahepatic bile ducts. The epithelium of the biliary tree consists of small cholangiocytes that populate the proximal side of the biliary tree and large cholangiocytes that cover the large intrahepatic bile ducts and extrahepatic bile duct.25, 32, 33 Large cholangiocytes respond to damage with different intracellular pathways and are more differentiated than small cholangiocytes. Over the course of biliary damage, large cholangiocytes are the first to be affected and are sequentially replenished by proliferating small cholangiocytes. Previous experiments on the role of PBG in cholangiopathies have reported that PBG respond with low proliferation rates to mild biliary injuries whereas severe posttransplant cholangiopathy results in high rates of PBG proliferation.17 Moreover, PBG activation corresponded with disease progression in primary sclerosing cholangitis.4 Altogether, these findings and our current results indicate that following bile duct damage, PBG may serve as a cholangiocytic regenerative reservoir and that the rate of PBG activation is influenced by the extent and progression of the defects.
The proliferation and migration of PBG cells have been associated with a maturational lineage process from the bile duct periphery to the luminal surface.34 In the current study, we were able to confirm this by demonstrating that in ischemically injured bile ducts, Sox9+/PCNA+ cells were situated in deeper‐located PBG. In general, our results indicated that progenitor cells with high regenerative capacities were settled in the deeper layers of the bile duct wall and were able to mature and regenerate the biliary epithelium.
The current view of the biliary tree as a heterogeneous cellular network is supported by the clinical spectrum of cholangiopathies that exclusively manifest at specific sites. Primary biliary cholangitis, for example, is restricted to the small intrahepatic bile duct and involves the hepatic progenitor compartment, whereas in primary sclerosing cholangitis the large intrahepatic and extrahepatic bile ducts are affected, including involvement of the PBG.35 Ischemia‐reoxygenation injury, as can be found after liver transplantation, mainly affects the large cholangiocytes of the larger bile ducts. Therefore, posttransplant cholangiopathy mainly affects the larger intrahepatic and extrahepatic bile ducts and involves damage to the PBG cell compartment, a finding that is supported by our results.6 Unfortunately, we could not obtain sufficient numbers of bile duct slices from different parts of the large intrahepatic and extrahepatic bile ducts to demonstrate differences in PBG expression profiles between these different parts. Therefore, the inability to consider the longitudinal axis of biliary heterogeneity should be noted as a limitation of the current study. In addition, pathways that drive ischemia‐reoxygenation–induced biliary proliferation and remodeling could have been characterized in more detail by biochemical analyses of culture medium samples. Unfortunately, we did not collect these samples in the current study.
In conclusion, we succeeded in recapitulating human biliary regeneration driven by PBG proliferation and maturation in its original anatomical cellular organization. In contrast to biliary epithelial luminal lining and stromal cells, PBG are remarkably resistant to ischemia‐reoxygenation injury. After severe bile duct injury, PBG cells are able to respond with proliferation, migration, and maturation to restore biliary integrity. Therefore, this study provides evidence to support the concept that PBG respond to bile duct injuries by restoration of the biliary integrity and confirms the protective role of PBG in the development of large duct cholangiopathies.
Supporting information
Supported by a research project grant from the Sapienza University of Rome (E.G.) and ZonMW grants (P.O.) 114021010 and 114025003, by a sponsored research agreement (SRAs) from Vesta Therapeutics (Bethesda, MD), and by a research grant from de Cock‐Hadders Stichting, University Medical Center Groningen.
Potential conflict of interest: Nothing to report.
References
Author names in bold designate shared co‐first authorship.
- 1. Cardinale V, Wang Y, Carpino G, Cui CB, Gatto M, Rossi M, et al. Multipotent stem/progenitor cells in human biliary tree give rise to hepatocytes, cholangiocytes, and pancreatic islets. Hepatology 2011;54:2159‐2172. [DOI] [PubMed] [Google Scholar]
- 2. Lanzoni G, Cardinale V, Carpino G. The hepatic, biliary, and pancreatic network of stem/progenitor cell niches in humans: A new reference frame for disease and regeneration. Hepatology 2016;64:277‐286. [DOI] [PubMed] [Google Scholar]
- 3. de Jong IEM, van Leeuwen OB, Lisman T, Gouw ASH, Porte RJ. Repopulating the biliary tree from the peribiliary glands. Biochim Biophys Acta 2018;1864:1524‐1531. [DOI] [PubMed] [Google Scholar]
- 4. Carpino G, Cardinale V, Renzi A, Hov JR, Berloco PB, Rossi M, et al. Activation of biliary tree stem cells within peribiliary glands in primary sclerosing cholangitis. J Hepatol 2015;63:1220‐1228. [DOI] [PubMed] [Google Scholar]
- 5. Igarashi S, Sato Y, Ren XS, Harada K, Sasaki M, Nakanuma Y. Participation of peribiliary glands in biliary tract pathophysiologies. World J Hepatol 2013;5:425‐432. [DOI] [PMC free article] [PubMed] [Google Scholar]
- 6. op den Dries S, Westerkamp AC, Karimian N, Gouw AS, Bruinsma BG, Markmann JF, et al. Injury to peribiliary glands and vascular plexus before liver transplantation predicts formation of non‐anastomotic biliary strictures. J Hepatol 2014;60:1172‐1179. [DOI] [PubMed] [Google Scholar]
- 7. Luangmonkong T, Suriguga S, Bigaeva E, Boersema M, Oosterhuis D, de Jong KP, et al. Evaluating the antifibrotic potency of galunisertib in a human ex vivo model of liver fibrosis. Br J Pharmacol 2017;174:3107‐3117. [DOI] [PMC free article] [PubMed] [Google Scholar]
- 8. Olinga P, Schuppan D. Precision‐cut liver slices: a tool to model the liver ex vivo. J Hepatol 2013;58:1252‐1253. [DOI] [PubMed] [Google Scholar]
- 9. Stribos EG, Hillebrands Jl, Olinga P, Mutsaers HA. Renal fibrosis in precision‐cut kidney slices. Eur J Pharmacol 2016;790:57‐61. [DOI] [PubMed] [Google Scholar]
- 10. Carpino G, Renzi A, Cardinale V, Franchitto A, Onori P, Overi D, et al. Progenitor cell niches in the human pancreatic duct system and associated pancreatic duct glands: an anatomical and immunophenotyping study. J Anat 2016;228:474‐486. [DOI] [PMC free article] [PubMed] [Google Scholar]
- 11. Glaser SS, Gaudio E, Rao A, Pierce LM, Onori P, Franchitto A, et al. Morphological and functional heterogeneity of the mouse intrahepatic biliary epithelium. Lab Invest 2009;89:456‐469. [DOI] [PMC free article] [PubMed] [Google Scholar]
- 12. Nakagawa H, Suzuki N, Hirata Y, Hikiba Y, Hayakawa Y, Kinoshita H, et al. Biliary epithelial injury‐induced regenerative response by IL‐33 promotes cholangiocarcinogenesis from peribiliary glands. Proc Natl Acad Sci U S A 2017;114:E3806‐E3815. [DOI] [PMC free article] [PubMed] [Google Scholar]
- 13. Ogawa M, Ogawa S, Bear CE, Ahmadi S, Chin S, Li B, et al. Directed differentiation of cholangiocytes from human pluripotent stem cells. Nat Biotechnol 2015;33:853‐861. [DOI] [PubMed] [Google Scholar]
- 14. Fatehullah A, Tan SH, Barker N. Organoids as an in vitro model of human development and disease. Nat Cell Biol 2016;18:246‐254. [DOI] [PubMed] [Google Scholar]
- 15. Spitz L, Petropoulos A. The development of the glands of the common bile duct. J Pathol 1979;128:213‐220. [DOI] [PubMed] [Google Scholar]
- 16. Irie T, Asahina K, Shimizu‐Saito K, Teramoto K, Arii S, Teraoka H. Hepatic progenitor cells in the mouse extrahepatic bile duct after a bile duct ligation. Stem Cells Dev 2007;16:979‐987. [DOI] [PubMed] [Google Scholar]
- 17. Sutton ME, op den Dries S, Koster MH, Lisman T, Gouw AS, Porte RJ. Regeneration of human extrahepatic biliary epithelium: the peribiliary glands as progenitor cell compartment. Liver Int 2012;32:554‐559. [DOI] [PubMed] [Google Scholar]
- 18. Katabathina VS, Flaherty EM, Dasyam AK, Menias CO, Riddle ND, Lath N, et al. “Biliary Diseases with Pancreatic Counterparts”: Cross‐sectional Imaging Findings. Radiographics 2016;36:374‐392. [DOI] [PubMed] [Google Scholar]
- 19. Nakanuma Y, Harada K, Sasaki M, Sato Y. Proposal of a new disease concept “biliary diseases with pancreatic counterparts”. Anatomical and pathological bases. Histol Histopathol 2014;29:1‐10. [DOI] [PubMed] [Google Scholar]
- 20. Hou CT. Repair of the extrahepatic bile‐ducts after mechanical and chemical injury. J Pathol Bacteriol 1961;82:83‐94. [DOI] [PubMed] [Google Scholar]
- 21. DiPaola F, Shivakumar P, Pfister J, Walters S, Sabla G, Bezerra JA. Identification of intramural epithelial networks linked to peribiliary glands that express progenitor cell markers and proliferate after injury in mice. Hepatology 2013;58:1486‐1496. [DOI] [PMC free article] [PubMed] [Google Scholar]
- 22. Weidemann A, Johnson RS. Biology of HIF‐1alpha. Cell Death Differ 2008;15:621‐627. [DOI] [PubMed] [Google Scholar]
- 23. Gaudio E, Barbaro B, Alvaro D, Glaser S, Francis H, Franchitto A, et al. Administration of r‐VEGF‐A prevents hepatic artery ligation‐induced bile duct damage in bile duct ligated rats. Am J Physiol Gastrointest Liver Physiol 2006;291:G307‐G317. [DOI] [PubMed] [Google Scholar]
- 24. Gaudio E, Barbaro B, Alvaro D, Glaser S, Francis H, Ueno Y, et al. Vascular endothelial growth factor stimulates rat cholangiocyte proliferation via an autocrine mechanism. Gastroenterology 2006;130:1270‐1282. [DOI] [PubMed] [Google Scholar]
- 25. Han Y, Glaser S, Meng F, Francis H, Marzioni M, McDaniel K, et al. Recent advances in the morphological and functional heterogeneity of the biliary epithelium. Exp Biol Med (Maywood) 2013;238:549‐565. [DOI] [PMC free article] [PubMed] [Google Scholar]
- 26. Wang Y, Cui C, Yamauchi M, Miguez P, Roach M, Malavarca R, et al. Lineage restriction of human hepatic stem cells to mature fates is made efficient by tissue‐specific biomatrix scaffolds. Hepatology 2011;53:293‐305. [DOI] [PubMed] [Google Scholar]
- 27. Turner RA, Wauthier E, Lozoya O, McClelland R, Bowsher JE, Barbier C, et al. Successful transplantation of human hepatic stem cells with restricted localization to liver using hyaluronan grafts. Hepatology 2013;57:775‐784. [DOI] [PMC free article] [PubMed] [Google Scholar]
- 28. Williams MJ, Clouston AD, Forbes SJ. Links between hepatic fibrosis, ductular reaction, and progenitor cell expansion. Gastroenterology 2014;146:349‐356. [DOI] [PubMed] [Google Scholar]
- 29. Fabris L, Spirli C, Cadamuro M, Fiorotto R, Strazzabosco M. Emerging concepts in biliary repair and fibrosis. Am J Physiol Gastrointest Liver Physiol 2017;313:G102‐G116. [DOI] [PMC free article] [PubMed] [Google Scholar]
- 30. Vitale I, Manic G, De Maria R, Kroemer G, Galluzzi L. DNA damage in stem cells. Mol Cell 2017;66:306‐319. [DOI] [PubMed] [Google Scholar]
- 31. Rocha CRR, Lerner LK, Okamoto OK, Marchetto MC, Menck CFM. The role of DNA repair in the pluripotency and differentiation of human stem cells. Mutat Res 2013;752:25‐35. [DOI] [PubMed] [Google Scholar]
- 32. Marzioni M, Glaser SS, Francis H, Phinizy JL, LeSage G, Alpini G. Functional heterogeneity of cholangiocytes. Semin Liver Dis 2002;22:227‐240. [DOI] [PubMed] [Google Scholar]
- 33. Glaser S, Francis H, Demorrow S, Lesage G, Fava G, Marzioni M, et al. Heterogeneity of the intrahepatic biliary epithelium. World J Gastroenterol 2006;12:3523‐3536. [DOI] [PMC free article] [PubMed] [Google Scholar]
- 34. Carpino G, Cardinale V, Onori P, Franchitto A, Berloco PB, Rossi M, et al. Biliary tree stem/progenitor cells in glands of extrahepatic and intraheptic bile ducts: an anatomical in situ study yielding evidence of maturational lineages. J Anat 2012;220:186‐199. [DOI] [PMC free article] [PubMed] [Google Scholar]
- 35. Carpino G, Cardinale V, Folseraas T, Overi D, Floreani A, Franchitto A, et al. Hepatic stem/progenitor cell activation differs between primary sclerosing and primary biliary cholangitis. Am J Pathol 2018;188:627‐639. [DOI] [PubMed] [Google Scholar]
Associated Data
This section collects any data citations, data availability statements, or supplementary materials included in this article.
Supplementary Materials


