Fig. 6.

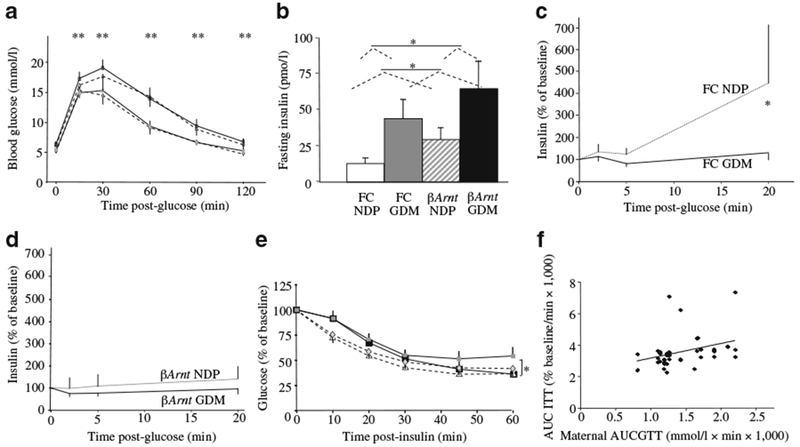
Glucose metabolism in offspring. a GTT at 16 weeks did not differ between GDM and NDP offspring; **p<0.01 for βArnt vs floxed-control (FC) offspring (ANOVA) (n=10 FC GDM, n=16 FC NDP, n=8 βArnt GDM, n=12 βArnt NDP). b Fasting serum insulin at 17 weeks; *p<0.05 (ANOVA) for GDM vs NDP offspring and for βArnt vs FC offspring. c GSIS was impaired in FC GDM (continuous line) vs FC NDP (dotted line) at 17 weeks; *p<0.05 (t test). d GSIS was impaired in all βArnt offspring (dotted line, βArnt NDP; continuous line, βArnt GDM). e ITT at 15 weeks; *p<0.05 for GDM vs NDP offspring (ANOVA). f Correlation between maternal AUCGTT and offspring AUCITT; r2=0.30, p<0.001 (Spearman bivariate correlation). Data represent means±SEM. Key (a, e): grey diamonds, FC NDP; grey squares, FC GDM; white triangles βArnt NDP; black squares, βArnt GDM
